In the fast-evolving technology sector, Coherent, Inc. and Cognex Corporation stand out as key players in the hardware and equipment space. Both companies innovate in precision optical and machine vision solutions, serving industries from manufacturing to scientific research. Their overlapping markets and distinct approaches to innovation make them compelling candidates for investment consideration. In this article, I will help you identify which company presents the most promising opportunity for your portfolio.

Table of contents
Companies Overview
I will begin the comparison between Coherent, Inc. and Cognex Corporation by providing an overview of these two companies and their main differences.
Coherent, Inc. Overview
Coherent, Inc. specializes in lasers, laser-based technologies, and system solutions serving commercial, industrial, and scientific research markets. The company operates two segments: OEM Laser Sources and Industrial Lasers & Systems. Founded in 1966 and headquartered in Santa Clara, California, Coherent is a subsidiary of II-VI Incorporated and holds a strong market position in precision optics and laser measurement products.
Cognex Corporation Overview
Cognex Corporation focuses on machine vision products that automate manufacturing and distribution by capturing and analyzing visual data. Its offerings include VisionPro software, vision sensors, and image-based barcode readers. Founded in 1981 and based in Natick, Massachusetts, Cognex serves diverse industries such as consumer electronics, automotive, and pharmaceuticals through distributors and integrators worldwide.
Key similarities and differences
Both companies operate in the technology sector within hardware and equipment industries, focusing on precision technology solutions. However, Coherent concentrates on laser technologies and optics, while Cognex specializes in machine vision and image analysis systems. Coherent has a significantly larger workforce and market capitalization, reflecting differences in scale and market reach.
Income Statement Comparison
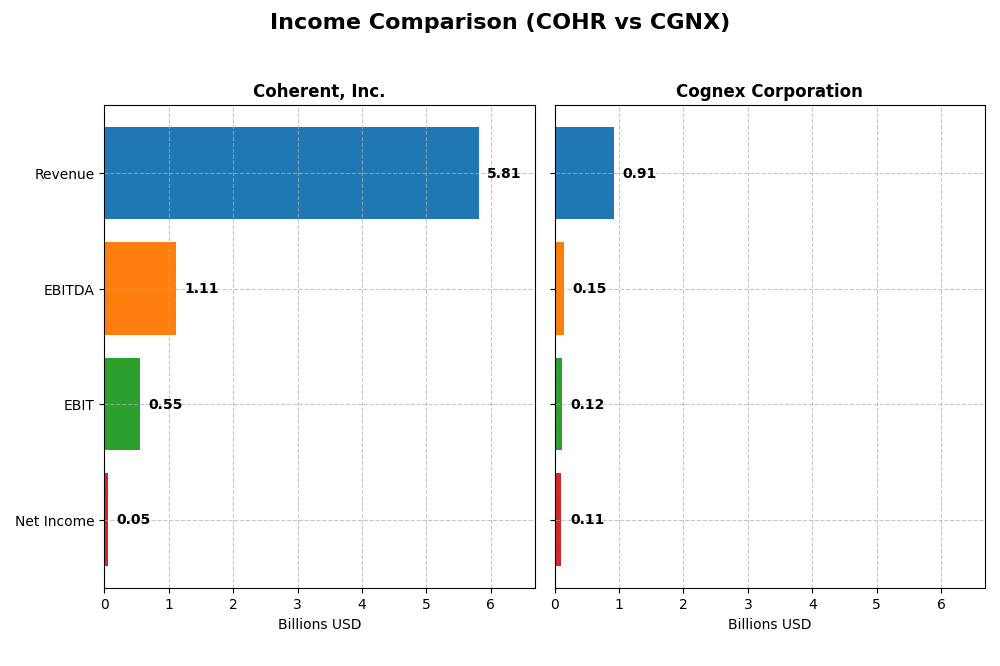
This table compares the key income statement metrics for Coherent, Inc. and Cognex Corporation for their most recent fiscal years, providing a snapshot of their financial performance.
| Metric | Coherent, Inc. (2025) | Cognex Corporation (2024) |
|---|---|---|
| Market Cap | 29.5B | 6.6B |
| Revenue | 5.81B | 915M |
| EBITDA | 1.11B | 148M |
| EBIT | 552M | 115M |
| Net Income | 49.4M | 106M |
| EPS | -0.52 | 0.62 |
| Fiscal Year | 2025 | 2024 |
Income Statement Interpretations
Coherent, Inc.
Coherent’s revenue grew significantly by 87% from 2021 to 2025, with a notable 23.4% increase in the most recent year. Gross margin remained favorable at 35.4%, while EBIT margin stabilized at 9.5%. Despite strong revenue and EBIT growth, net income and net margin declined overall, though the last year showed recovery with positive net income and margin growth.
Cognex Corporation
Cognex reported moderate revenue growth of 12.8% over 2020-2024, with a 9.2% increase in the latest year. Gross margin stayed robust at 68.4%, supported by a favorable EBIT margin of 12.6%. However, recent declines in EBIT and net margin indicate pressure on profitability, with net income dropping nearly 40% over the period and EPS also falling.
Which one has the stronger fundamentals?
Coherent demonstrates stronger top-line growth and significant recent improvements in EBIT and net margin, despite historical net income challenges. Cognex maintains higher margins but faces declining profitability and EPS trends. Both companies show a favorable global income statement opinion, though Coherent’s stronger revenue and margin recovery suggest more dynamic recent fundamentals.
Financial Ratios Comparison
The table below presents key financial ratios for Coherent, Inc. and Cognex Corporation for their most recent fiscal years, offering a snapshot of their operational efficiency, profitability, liquidity, and valuation metrics.
| Ratios | Coherent, Inc. (2025 FY) | Cognex Corporation (2024 FY) |
|---|---|---|
| ROE | 0.61% | 7.00% |
| ROIC | 1.31% | 5.07% |
| P/E | 280 | 57.9 |
| P/B | 1.70 | 4.05 |
| Current Ratio | 2.19 | 3.62 |
| Quick Ratio | 1.39 | 2.69 |
| D/E | 0.48 | 0.05 |
| Debt-to-Assets | 26.1% | 3.5% |
| Interest Coverage | 2.26 | 0 (not available) |
| Asset Turnover | 0.39 | 0.46 |
| Fixed Asset Turnover | 3.09 | 5.52 |
| Payout ratio | 23.2% | 49.3% |
| Dividend yield | 0.08% | 0.85% |
Interpretation of the Ratios
Coherent, Inc.
Coherent, Inc. displays a mixed financial profile with a slight tilt towards unfavorable ratios. Key profitability measures like net margin (0.85%), ROE (0.61%), and ROIC (1.31%) are weak, while liquidity ratios such as current ratio (2.19) and quick ratio (1.39) are favorable. The high PE ratio (279.75) and low dividend yield (0.08%) raise concerns. The company does not pay dividends, likely reflecting reinvestment or growth priorities.
Cognex Corporation
Cognex Corporation shows some strengths in profitability, with a favorable net margin of 11.61%, but other ratios like ROE (7.0%) and WACC (10.84%) are unfavorable or neutral. Liquidity is mixed; quick ratio (2.69) is favorable, but current ratio (3.62) is marked unfavorable. Dividend yield stands at 0.85%, though payout sustainability is unclear. Overall, the firm pays dividends, balancing returns with growth investments.
Which one has the best ratios?
Both companies have roughly half their ratios rated unfavorable, with Coherent leaning more on liquidity strength and Cognex showing better net margin and interest coverage. However, high valuation multiples and mixed returns weigh on both. The global ratios opinions for both are slightly unfavorable, indicating neither stands out decisively as superior based solely on these metrics.
Strategic Positioning
This section compares the strategic positioning of Coherent, Inc. and Cognex Corporation, including their market position, key segments, and exposure to disruption:
Coherent, Inc.
- Large market cap of 29.5B in laser and precision optics, facing competition in hardware and equipment sectors.
- Focused on two segments: OEM Laser Sources and Industrial Lasers & Systems driving revenue from microelectronics and scientific research.
- Exposure to technological disruption in laser-based technologies and precision optics within industrial and research applications.
Cognex Corporation
- Smaller market cap of 6.6B specializing in machine vision products in a competitive hardware and equipment market.
- Revenue driven by customer-specific solutions and standard products automating manufacturing for various industries.
- Faces disruption risk in advanced vision software and deep learning for manufacturing automation and inspection tasks.
Coherent, Inc. vs Cognex Corporation Positioning
Coherent operates with a diversified segment approach focusing on laser systems and materials, while Cognex concentrates on machine vision and automation solutions. Coherent’s larger scale contrasts with Cognex’s specialized product focus, highlighting different strategic scopes and industry applications.
Which has the best competitive advantage?
Both companies show very unfavorable MOAT evaluations with declining ROIC trends and value destruction, indicating neither currently holds a sustainable competitive advantage based on invested capital efficiency.
Stock Comparison
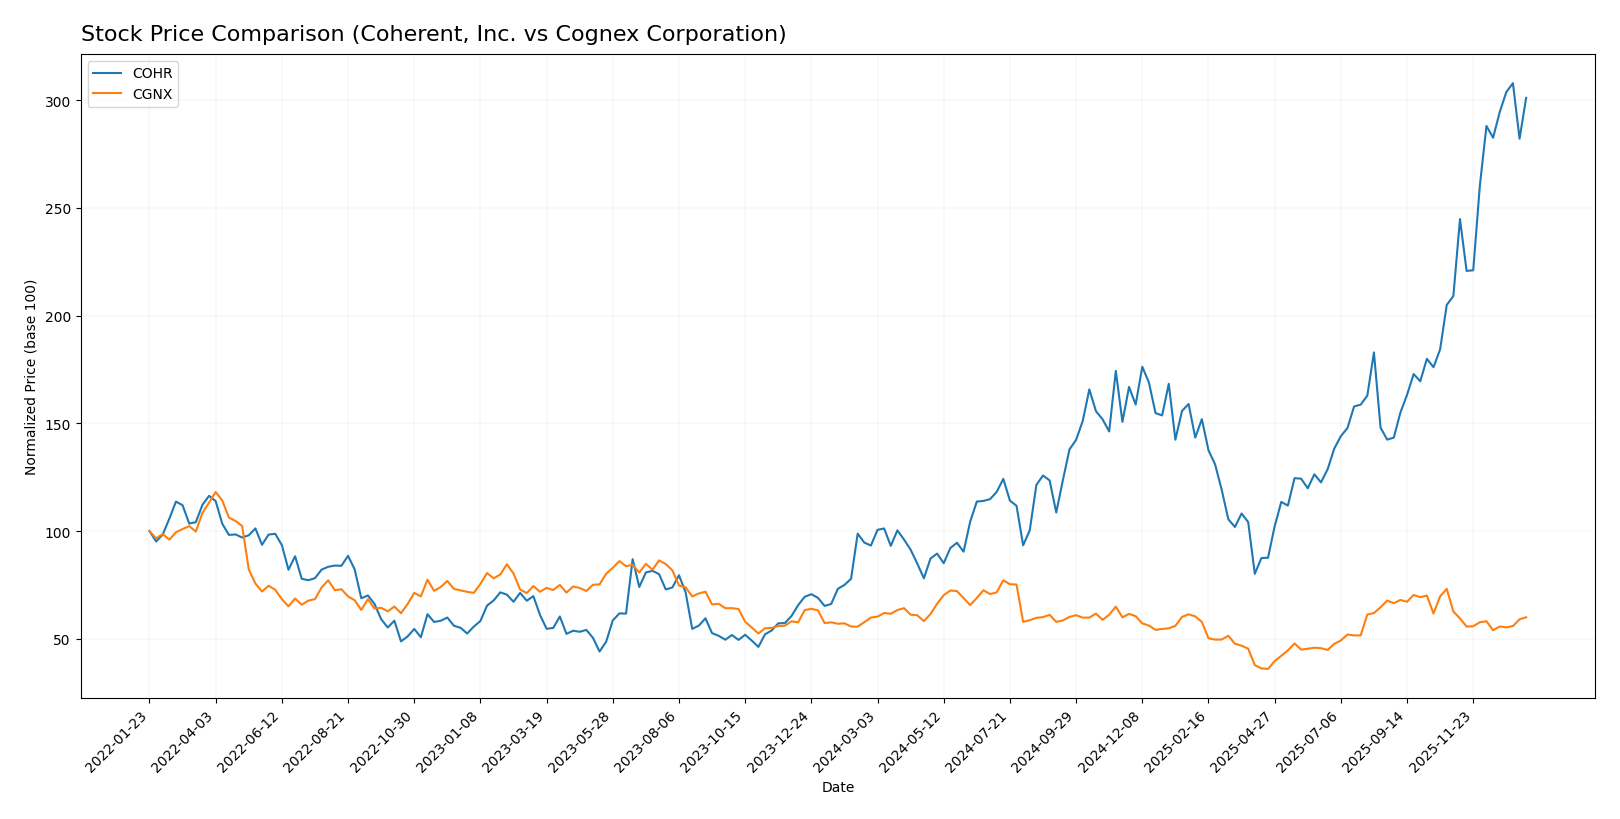
The stock price chart highlights pronounced bullish momentum for Coherent, Inc. with significant gains and acceleration over the past year, contrasted by a near-neutral overall trend and recent slight bearishness in Cognex Corporation’s shares.
Trend Analysis
Coherent, Inc. exhibited a strong bullish trend over the past 12 months with a 222.85% price increase, showing acceleration and a high volatility level (std deviation 34.26), with prices ranging from 49.26 to 194.33.
Cognex Corporation’s stock showed an overall neutral trend with a 0.18% increase over 12 months, accompanied by deceleration and low volatility (std deviation 5.92). Recently, it recorded a -4.25% decline indicating a short-term bearish movement.
Comparing both stocks, Coherent, Inc. delivered the highest market performance with robust gains and accelerating momentum, while Cognex’s trend remained largely flat with a recent dip.
Target Prices
Here is the consensus target price outlook for Coherent, Inc. and Cognex Corporation based on verified analyst data:
| Company | Target High | Target Low | Consensus |
|---|---|---|---|
| Coherent, Inc. | 210 | 135 | 175 |
| Cognex Corporation | 58 | 38 | 48.14 |
Analysts expect Coherent’s stock to trade near 175 USD, slightly below its current price of 190.03 USD, while Cognex’s consensus target of 48.14 USD suggests moderate upside from its current 39.63 USD.
Analyst Opinions Comparison
This section compares analysts’ ratings and grades for Coherent, Inc. (COHR) and Cognex Corporation (CGNX):
Rating Comparison
COHR Rating
- Rating: B- with a very favorable status.
- Discounted Cash Flow Score: 3 (Moderate).
- ROE Score: 2 (Moderate efficiency).
- ROA Score: 3 (Moderate asset utilization).
- Debt To Equity Score: 2 (Moderate risk).
- Overall Score: 2 (Moderate).
CGNX Rating
- Rating: B with a very favorable status.
- Discounted Cash Flow Score: 3 (Moderate).
- ROE Score: 3 (Moderate efficiency).
- ROA Score: 4 (Favorable asset utilization).
- Debt To Equity Score: 4 (Favorable risk).
- Overall Score: 3 (Moderate).
Which one is the best rated?
Based strictly on the provided data, CGNX is better rated than COHR. CGNX holds a higher overall score and stronger financial metrics in ROE, ROA, and debt-to-equity scores, indicating more favorable financial health.
Scores Comparison
Here is a comparison of the Altman Z-Score and Piotroski Score for Coherent, Inc. and Cognex Corporation:
COHR Scores
- Altman Z-Score: 3.70, indicating a safe zone
- Piotroski Score: 7, classified as strong
CGNX Scores
- Altman Z-Score: 9.07, indicating a safe zone
- Piotroski Score: 7, classified as strong
Which company has the best scores?
Both companies are in the safe zone for the Altman Z-Score, but CGNX has a notably higher score of 9.07 compared to COHR’s 3.70. Both have the same Piotroski Score of 7, reflecting strong financial health.
Grades Comparison
Here is the detailed grades comparison for Coherent, Inc. and Cognex Corporation:
Coherent, Inc. Grades
The following table summarizes recent grades assigned to Coherent, Inc. by reputable grading companies:
| Grading Company | Action | New Grade | Date |
|---|---|---|---|
| Morgan Stanley | Maintain | Equal Weight | 2025-12-17 |
| JP Morgan | Maintain | Overweight | 2025-12-05 |
| Barclays | Maintain | Overweight | 2025-11-07 |
| Morgan Stanley | Maintain | Equal Weight | 2025-11-06 |
| Stifel | Maintain | Buy | 2025-11-06 |
| Rosenblatt | Maintain | Buy | 2025-11-06 |
| Needham | Maintain | Buy | 2025-11-06 |
| Susquehanna | Maintain | Positive | 2025-10-22 |
| Barclays | Maintain | Overweight | 2025-10-20 |
| Rosenblatt | Maintain | Buy | 2025-10-14 |
Grades for Coherent, Inc. consistently indicate a positive outlook, with multiple “Buy” and “Overweight” ratings maintained by major firms.
Cognex Corporation Grades
Below is the recent grading data for Cognex Corporation from reliable grading companies:
| Grading Company | Action | New Grade | Date |
|---|---|---|---|
| Barclays | Maintain | Overweight | 2026-01-12 |
| Truist Securities | Maintain | Hold | 2025-12-18 |
| Goldman Sachs | Upgrade | Buy | 2025-12-16 |
| JP Morgan | Downgrade | Underweight | 2025-12-03 |
| DA Davidson | Maintain | Neutral | 2025-11-03 |
| Barclays | Maintain | Overweight | 2025-10-31 |
| Needham | Maintain | Buy | 2025-10-31 |
| Baird | Maintain | Neutral | 2025-10-31 |
| Truist Securities | Maintain | Hold | 2025-10-08 |
| Goldman Sachs | Maintain | Sell | 2025-09-16 |
Grades for Cognex Corporation show a mixed trend with recent upgrades offset by downgrades, including “Buy,” “Hold,” and “Underweight” ratings.
Which company has the best grades?
Coherent, Inc. has received stronger and more consistent positive grades, mainly “Buy” and “Overweight,” compared to Cognex Corporation’s mixed ratings including “Hold” and “Underweight.” This suggests Coherent, Inc. currently enjoys more favorable analyst sentiment, potentially influencing investor confidence and portfolio decisions accordingly.
Strengths and Weaknesses
Below is a comparison of key strengths and weaknesses for Coherent, Inc. (COHR) and Cognex Corporation (CGNX) based on the most recent financial and operational data.
| Criterion | Coherent, Inc. (COHR) | Cognex Corporation (CGNX) |
|---|---|---|
| Diversification | Focused on two main segments: Lasers (1.43B) and Materials (0.95B) in 2025; moderate diversification within tech hardware | Primarily in Standard Products & Services (795M) and Customer Specific Solutions (119M); more focused on machine vision tech |
| Profitability | Very low net margin (0.85%), unfavorable ROIC (1.31%), declining profitability; value destroying | Better net margin (11.61%) but ROIC (5.07%) and WACC unfavorable; also value destroying but more profitable than COHR |
| Innovation | Moderate fixed asset turnover (3.09), but declining ROIC trend suggests innovation challenges | Higher fixed asset turnover (5.52) indicates efficient use of assets; innovation likely stronger but profitability pressures remain |
| Global presence | Strong current (2.19) and quick ratios (1.39) indicating good liquidity to support operations globally | Strong quick ratio (2.69) but weak current ratio (3.62 unfavorable) may reflect working capital management issues internationally |
| Market Share | Large revenue base in lasers segment but declining market competitiveness indicated by high P/E (279.75) | Smaller revenue base but steady growth in customer-specific solutions; high valuation multiples (P/E 57.9) suggest investor expectations |
Key takeaways: Both COHR and CGNX face challenges with declining ROIC and unfavorable profitability metrics, indicating value destruction. CGNX shows stronger profitability and asset efficiency, while COHR benefits from better liquidity. Caution is advised due to profitability erosion and high valuation multiples.
Risk Analysis
Below is a comparison of key risks for Coherent, Inc. (COHR) and Cognex Corporation (CGNX) based on the most recent data available.
| Metric | Coherent, Inc. (COHR) | Cognex Corporation (CGNX) |
|---|---|---|
| Market Risk | High beta (1.835) indicates higher volatility and market sensitivity. | Moderate beta (1.519) suggests moderate market volatility. |
| Debt Level | Moderate debt-to-equity ratio (0.48), manageable leverage. | Very low debt-to-equity ratio (0.05), low financial risk. |
| Regulatory Risk | Moderate, as a technology hardware company subject to export controls and industry standards. | Moderate, with exposure to manufacturing regulations globally. |
| Operational Risk | Large workforce (26K employees) with complex manufacturing increases operational risk. | Smaller workforce (2.9K), less operational complexity but dependency on key customers. |
| Environmental Risk | Manufacturing processes may involve hazardous materials; compliance essential. | Lower environmental impact, mainly software and sensor production. |
| Geopolitical Risk | Global sales with exposure to trade tensions affecting supply chain. | International sales but lesser scale; moderate geopolitical exposure. |
Coherent faces higher market and operational risks due to its larger scale and higher beta, while Cognex benefits from low debt and strong financial stability but carries moderate market risk. Both companies are exposed to regulatory and geopolitical uncertainties, with Coherent’s supply chain more vulnerable to global trade tensions.
Which Stock to Choose?
Coherent, Inc. (COHR) shows a favorable income growth with a 23.42% revenue rise in 2025 and a solid gross margin of 35.41%. However, profitability ratios such as net margin (0.85%) and ROE (0.61%) are unfavorable. The company carries moderate debt with a net debt to EBITDA ratio of 2.7 and has a B- rating, indicating a slightly unfavorable overall financial ratio profile.
Cognex Corporation (CGNX) presents a favorable income statement with a high gross margin of 68.43% and a net margin of 11.61%, despite a recent slight decline in net margin growth. Financial ratios show a mixed picture: favorable asset and debt metrics but elevated valuation multiples. The company’s rating is B, reflecting a moderately favorable financial health, supported by a safe-zone Altman Z-Score and strong Piotroski score.
For investors, CGNX’s stronger profitability and higher-quality financial scores might suggest suitability for those seeking established financial strength, while COHR’s accelerating revenue growth and moderate debt levels might appeal to investors prioritizing growth potential despite some ratio weaknesses. Both companies face value destruction issues indicated by declining ROIC trends, signaling caution.
Disclaimer: Investment carries a risk of loss of initial capital. The past performance is not a reliable indicator of future results. Be sure to understand risks before making an investment decision.
Go Further
I encourage you to read the complete analyses of Coherent, Inc. and Cognex Corporation to enhance your investment decisions: