The Coca-Cola Company (KO) and Coca-Cola Consolidated, Inc. (COKE) are two key players in the non-alcoholic beverage industry, sharing a close business relationship yet operating distinct roles—KO as a global beverage giant and COKE as a leading bottler and distributor. Both companies innovate within the evolving beverage market, focusing on expanding product portfolios and distribution efficiency. This article will dissect their fundamentals to help you decide which is the more compelling investment opportunity today.

Table of contents
Companies Overview
I will begin the comparison between The Coca-Cola Company and Coca-Cola Consolidated, Inc. by providing an overview of these two companies and their main differences.
The Coca-Cola Company Overview
The Coca-Cola Company is a leading global beverage company specializing in manufacturing, marketing, and selling a diverse range of nonalcoholic beverages. Headquartered in Atlanta, Georgia, it offers sparkling soft drinks, waters, juices, coffees, teas, and plant-based beverages under numerous brands like Coca-Cola, Sprite, and Minute Maid. Founded in 1886, the company operates through a vast network of bottling partners and distributors worldwide.
Coca-Cola Consolidated, Inc. Overview
Coca-Cola Consolidated, Inc., based in Charlotte, North Carolina, primarily manufactures, markets, and distributes nonalcoholic beverages, including products from The Coca-Cola Company, across the United States. It supplies grocery stores, restaurants, and other retail outlets with sparkling and still beverages and distributes other brands like Dr Pepper and Monster Energy. Founded in 1980, it focuses on direct distribution and post-mix product sales.
Key similarities and differences
Both companies operate within the nonalcoholic beverage sector and share a focus on sparkling and still beverages. The Coca-Cola Company is a global producer and marketer of beverage brands, while Coca-Cola Consolidated acts mainly as a regional bottler and distributor for The Coca-Cola Company and other brands. The former has a significantly larger market cap and employee base, reflecting its global scale compared to the more regionally focused distribution model of the latter.
Income Statement Comparison
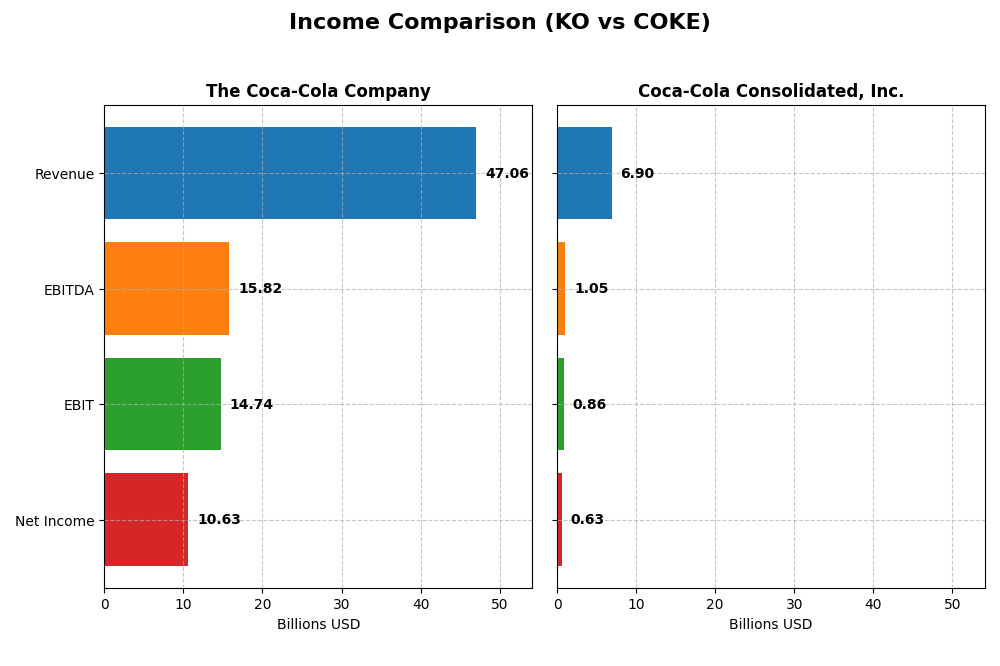
The table below compares the key income statement figures for The Coca-Cola Company and Coca-Cola Consolidated, Inc. for the fiscal year 2024, providing a clear overview of their financial performance.
| Metric | The Coca-Cola Company | Coca-Cola Consolidated, Inc. |
|---|---|---|
| Market Cap | 303.4B | 13.1B |
| Revenue | 47.1B | 6.9B |
| EBITDA | 15.8B | 1.1B |
| EBIT | 14.7B | 859M |
| Net Income | 10.6B | 633M |
| EPS | 2.47 | 7.01 |
| Fiscal Year | 2024 | 2024 |
Income Statement Interpretations
The Coca-Cola Company
Over 2020–2024, The Coca-Cola Company showed a steady increase in revenue and net income, with revenue growing 42.55% and net income up 37.23%. Margins remained strong, with a gross margin of 61.06% and net margin near 22.59%, although net margin slightly declined recently. In 2024, revenue grew modestly by 2.86%, while net income edged down 0.4%, reflecting margin pressure.
Coca-Cola Consolidated, Inc.
From 2020 to 2024, Coca-Cola Consolidated’s revenue expanded by 37.79%, with net income surging 267.04%, signaling robust profitability improvements. Margins, including a 39.9% gross margin and 9.18% net margin, improved significantly. The latest year saw a 3.69% revenue increase and a sharp 60.69% EPS rise, supported by a 49.51% net margin growth, indicating accelerating earnings strength.
Which one has the stronger fundamentals?
Both companies exhibit favorable income statement fundamentals, but Coca-Cola Consolidated reports more pronounced margin and earnings growth, particularly in the latest year, with net income and EPS surging. The Coca-Cola Company maintains higher absolute revenue and margins but faces slight margin contraction recently. Overall, Coca-Cola Consolidated displays stronger recent earnings momentum, while The Coca-Cola Company shows stable scale and profitability.
Financial Ratios Comparison
The table below presents a side-by-side comparison of key financial ratios for The Coca-Cola Company (KO) and Coca-Cola Consolidated, Inc. (COKE) based on the most recent fiscal year data available (2024).
| Ratios | The Coca-Cola Company (KO) | Coca-Cola Consolidated, Inc. (COKE) |
|---|---|---|
| ROE | 42.8% | 44.7% |
| ROIC | 10.5% | 15.5% |
| P/E | 25.2 | 18.0 |
| P/B | 10.8 | 8.0 |
| Current Ratio | 1.03 | 1.94 |
| Quick Ratio | 0.84 | 1.69 |
| D/E (Debt-to-Equity) | 1.84 | 1.35 |
| Debt-to-Assets | 45.5% | 35.9% |
| Interest Coverage | 6.03 | 498.0 |
| Asset Turnover | 0.47 | 1.30 |
| Fixed Asset Turnover | 4.10 | 4.26 |
| Payout Ratio | 78.6% | 29.3% |
| Dividend Yield | 3.12% | 1.63% |
Interpretation of the Ratios
The Coca-Cola Company
The Coca-Cola Company shows a mixed ratios profile with strong profitability metrics like a 42.77% ROE and a 22.59% net margin, both favorable. However, valuation ratios such as P/E at 25.24 and P/B at 10.79 are marked unfavorable, signaling potentially high market expectations. The dividend yield at 3.12% is supported by stable payouts, but moderate debt levels and neutral liquidity ratios suggest some caution.
Coca-Cola Consolidated, Inc.
Coca-Cola Consolidated, Inc. exhibits generally favorable financial ratios, including a high ROE of 44.66% and a solid ROIC of 15.55%. Liquidity is strong with a current ratio of 1.94 and quick ratio of 1.69, while interest coverage is exceptionally high. The dividend yield is modest at 1.63%, consistent with a balanced shareholder return approach amid some neutral valuation ratios.
Which one has the best ratios?
Coca-Cola Consolidated, Inc. presents a more favorable overall ratio profile, with higher liquidity, stronger operating efficiency, and fewer unfavorable metrics compared to The Coca-Cola Company. While both companies have robust returns, Coca-Cola Consolidated’s lower debt impact and better asset turnover suggest a comparatively stronger financial position in 2024.
Strategic Positioning
This section compares the strategic positioning of The Coca-Cola Company and Coca-Cola Consolidated, Inc., focusing on Market position, Key segments, and Exposure to technological disruption:
The Coca-Cola Company
- Leading global beverage company with extensive market presence and strong competitive pressure.
- Diverse product portfolio including sparkling drinks, water, coffee, tea, juices, dairy, and plant-based beverages.
- Operates through independent bottlers and distributors, adapting to industry changes with established network.
Coca-Cola Consolidated, Inc.
- Regional beverage bottler and distributor primarily serving the US market with competitive pressures locally.
- Focused on manufacturing, marketing, and distributing primarily Coca-Cola products and other beverage brands in the US.
- Distribution-centric model with exposure to post-mix products and partnerships with other beverage brands.
The Coca-Cola Company vs Coca-Cola Consolidated, Inc. Positioning
The Coca-Cola Company has a diversified global strategy with a broad product range, providing scale advantages but facing complex market pressures. Coca-Cola Consolidated focuses on concentrated US distribution, enabling operational efficiency but limiting geographic reach.
Which has the best competitive advantage?
Both companies demonstrate very favorable MOATs with growing ROIC above WACC, indicating durable competitive advantages. Coca-Cola Consolidated shows stronger ROIC growth, suggesting more rapid value creation in recent years.
Stock Comparison
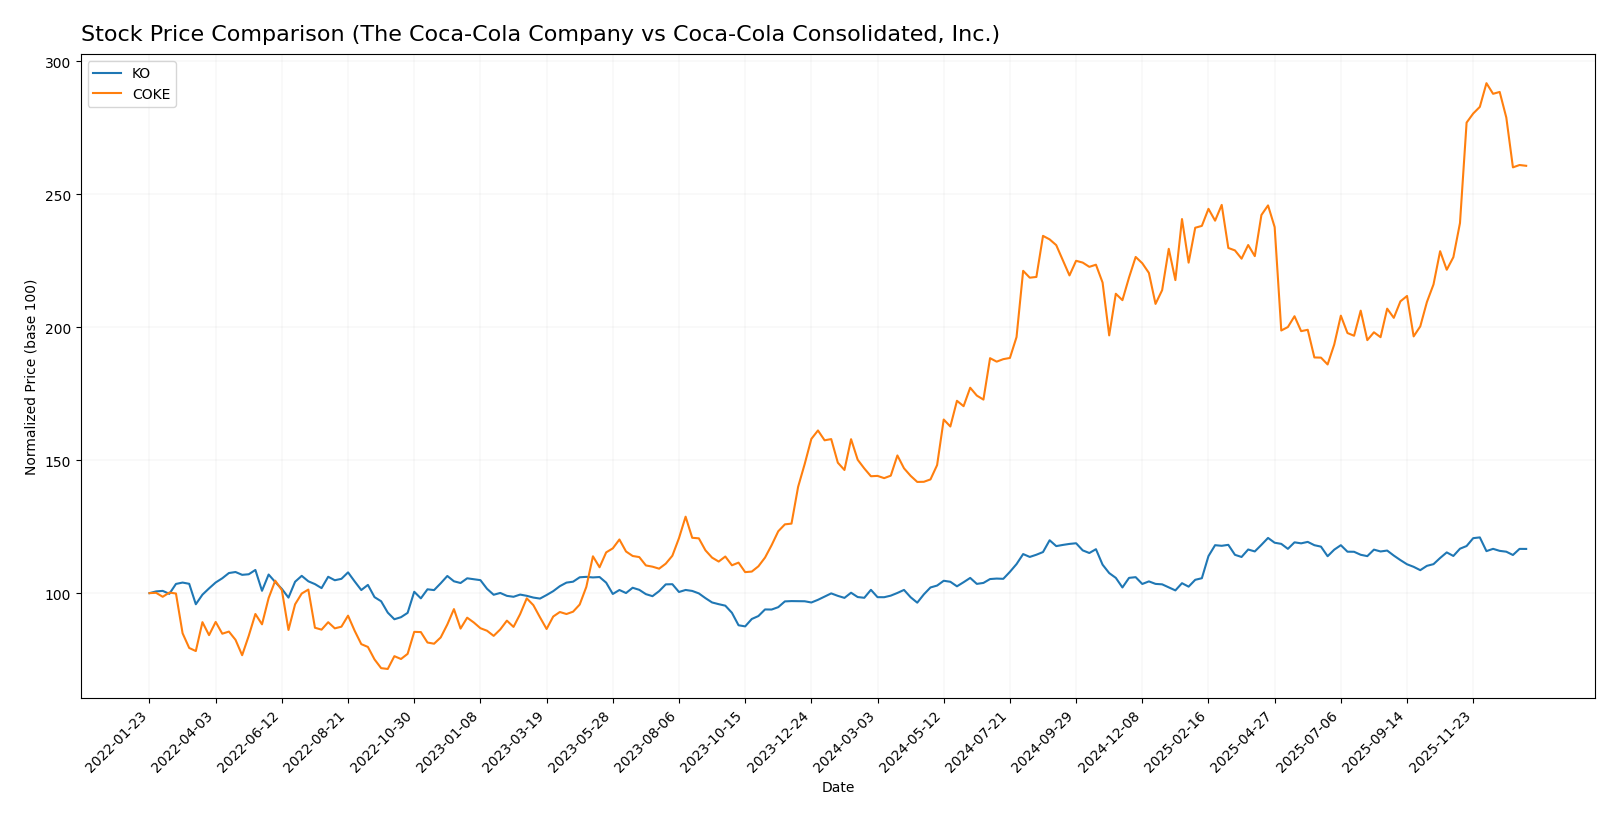
The stock price movements over the past 12 months reveal distinct bullish trends for both The Coca-Cola Company and Coca-Cola Consolidated, Inc., with notable differences in momentum and volatility impacting their trading dynamics.
Trend Analysis
The Coca-Cola Company (KO) experienced a 15.2% price increase over the past year, indicating a bullish trend with deceleration in momentum. The stock ranged between 58.28 and 73.12, showing moderate volatility with a standard deviation of 4.08.
Coca-Cola Consolidated, Inc. (COKE) recorded an 81.11% price rise over the same period, reflecting a strong bullish trend with accelerating momentum. The price fluctuated between 81.69 and 168.08, accompanied by significant volatility marked by a 20.47 standard deviation.
Comparing both stocks, Coca-Cola Consolidated, Inc. delivered the highest market performance with a markedly stronger bullish trend and acceleration relative to The Coca-Cola Company.
Target Prices
Analysts provide a clear target price consensus for The Coca-Cola Company, reflecting moderate upside potential.
| Company | Target High | Target Low | Consensus |
|---|---|---|---|
| The Coca-Cola Company | 82 | 76 | 79 |
The consensus target price of 79 USD suggests an upside of about 12% from the current price of 70.5 USD, indicating generally positive analyst expectations. No verified target price data is available for Coca-Cola Consolidated, Inc.
Analyst Opinions Comparison
This section compares analysts’ ratings and grades for The Coca-Cola Company and Coca-Cola Consolidated, Inc.:
Rating Comparison
KO Rating
- Rating: B+ with a very favorable overall evaluation.
- Discounted Cash Flow Score: 5, indicating very favorable future cash flow projections.
- ROE Score: 5, demonstrating very efficient profit generation from shareholders’ equity.
- ROA Score: 5, indicating very effective asset utilization to generate earnings.
- Debt To Equity Score: 1, considered very unfavorable due to high financial risk.
- Overall Score: 3, indicating a moderate summary assessment of financial standing.
COKE Rating
- Rating: B+ with a very favorable overall evaluation.
- Discounted Cash Flow Score: 3, showing moderate valuation based on future cash flow.
- ROE Score: 5, also reflecting very efficient use of shareholders’ equity.
- ROA Score: 5, similarly showing very effective asset use for earnings.
- Debt To Equity Score: 1, likewise very unfavorable, suggesting high financial risk.
- Overall Score: 3, also reflecting a moderate financial standing summary.
Which one is the best rated?
Both KO and COKE share an identical overall rating of B+ and a moderate overall score of 3. KO has a higher discounted cash flow score (5 vs. 3), suggesting a more favorable valuation outlook, while other key financial metrics are equal.
Scores Comparison
The scores comparison between The Coca-Cola Company and Coca-Cola Consolidated, Inc. highlights their financial health and bankruptcy risk:
KO Scores
- Altman Z-Score of 4.59, placing KO in the safe zone.
- Piotroski Score of 7, reflecting strong financial health.
COKE Scores
- Altman Z-Score of 4.33, indicating COKE is in the safe zone.
- Piotroski Score of 7, also reflecting strong financial health.
Which company has the best scores?
Both KO and COKE have Altman Z-Scores well within the safe zone and identical Piotroski Scores of 7, indicating equally strong financial health based on the provided data.
Grades Comparison
Here is a detailed comparison of the grades assigned to The Coca-Cola Company and Coca-Cola Consolidated, Inc.:
The Coca-Cola Company Grades
The table below presents recent grades from reputable grading companies for The Coca-Cola Company:
| Grading Company | Action | New Grade | Date |
|---|---|---|---|
| B of A Securities | Buy | Buy | 2025-11-07 |
| Barclays | Hold | Overweight | 2025-10-23 |
| Wells Fargo | Hold | Overweight | 2025-10-22 |
| TD Cowen | Buy | Buy | 2025-10-22 |
| Piper Sandler | Hold | Overweight | 2025-10-22 |
| Wells Fargo | Hold | Overweight | 2025-09-25 |
| UBS | Buy | Buy | 2025-09-11 |
| JP Morgan | Hold | Overweight | 2025-07-23 |
| UBS | Buy | Buy | 2025-07-23 |
| BNP Paribas | Buy | Outperform | 2025-07-21 |
Overall, The Coca-Cola Company maintains a strong consensus with most grades clustered around Buy and Overweight ratings, indicating positive analyst sentiment.
Coca-Cola Consolidated, Inc. Grades
The table below shows older grades from a single grading company for Coca-Cola Consolidated, Inc.:
| Grading Company | Action | New Grade | Date |
|---|---|---|---|
| Citigroup | Hold | Neutral | 2016-05-20 |
| Citigroup | Hold | Neutral | 2016-05-19 |
| Citigroup | Hold | Neutral | 2015-07-27 |
| Citigroup | Hold | Neutral | 2015-07-26 |
| Citigroup | Hold | Neutral | 2015-05-07 |
| Citigroup | Hold | Neutral | 2015-05-06 |
| Citigroup | Hold | Neutral | 2015-03-06 |
| Citigroup | Hold | Neutral | 2015-03-05 |
| Citigroup | Hold | Neutral | 2014-11-13 |
| Citigroup | Hold | Neutral | 2014-11-12 |
The grades for Coca-Cola Consolidated, Inc. are consistently Neutral and dated, reflecting a more cautious or less active analyst coverage over several years.
Which company has the best grades?
The Coca-Cola Company has clearly received stronger and more recent grades, predominantly Buy and Overweight, compared to Coca-Cola Consolidated, Inc.’s older and Neutral ratings. This suggests more bullish analyst sentiment towards The Coca-Cola Company, which could influence investor confidence and portfolio positioning.
Strengths and Weaknesses
Below is a comparison of key strengths and weaknesses of The Coca-Cola Company (KO) and Coca-Cola Consolidated, Inc. (COKE) based on their latest financial and strategic data.
| Criterion | The Coca-Cola Company (KO) | Coca-Cola Consolidated, Inc. (COKE) |
|---|---|---|
| Diversification | High diversification with segments like Pacific, Bottling, and Global Ventures generating multi-billion revenues. | Primarily focused on Nonalcoholic Beverage segment, less diversified but specialized. |
| Profitability | Strong profitability with net margin at 22.6% and ROIC of 10.46%, value creator with growing ROIC. | Moderate net margin at 9.18%, but higher ROIC of 15.55%, also a value creator with robust ROIC growth. |
| Innovation | Large investments in bottling and global ventures suggest ongoing innovation and expansion. | Focused innovation in beverage distribution and operational efficiency. |
| Global presence | Extensive global presence, especially in the Pacific region, with revenues over 38B USD. | More regional/national focus with revenues near 6.8B USD in beverages. |
| Market Share | Dominant global market share with diversified product portfolio and strong brand recognition. | Strong regional market share as a key bottler and distributor in the U.S. |
The Coca-Cola Company (KO) excels in global reach and diversification, supporting stable profitability and innovation. Coca-Cola Consolidated (COKE) shows exceptional capital efficiency and profitability growth with a focused operational model, making it a strong regional player. Investors should weigh KO’s global scale against COKE’s high ROIC and operational focus.
Risk Analysis
Below is a comparison of key risks facing The Coca-Cola Company (KO) and Coca-Cola Consolidated, Inc. (COKE) as of 2024.
| Metric | The Coca-Cola Company (KO) | Coca-Cola Consolidated, Inc. (COKE) |
|---|---|---|
| Market Risk | Moderate (Beta 0.39, stable demand but evolving consumer preferences) | Moderate (Beta 0.64, regional exposure to US market fluctuations) |
| Debt level | Elevated (D/E 1.84, interest coverage good at 8.9) | Moderate (D/E 1.35, excellent interest coverage at 464.6) |
| Regulatory Risk | Moderate (Global operations face diverse regulations) | Moderate (US-focused, subject to federal and state beverage regulations) |
| Operational Risk | Moderate (Global supply chain complexity) | Moderate (Concentrated US bottling and distribution risks) |
| Environmental Risk | Moderate (Sustainability initiatives ongoing but water use scrutiny) | Moderate (Environmental impact from bottling and logistics) |
| Geopolitical Risk | Moderate (Global footprint, some exposure to trade tensions) | Low to Moderate (Primarily US market, less geopolitical exposure) |
The most impactful risks for both companies include market shifts driven by changing consumer preferences and debt levels. KO’s higher leverage poses financial risk, though interest coverage is adequate. Regulatory and environmental risks remain moderate, with KO’s global presence increasing complexity. COKE benefits from strong debt coverage but faces concentrated operational risks.
Which Stock to Choose?
The Coca-Cola Company (KO) shows a favorable income statement with strong net margin (22.59%) and stable profitability, though recent revenue growth slowed. Its financial ratios are slightly favorable, supported by a very favorable moat and a very favorable B+ rating, despite some debt concerns.
Coca-Cola Consolidated, Inc. (COKE) exhibits favorable income growth, notably in net margin and EPS over recent years, with strong profitability metrics. Its financial ratios are favorable overall, supported by a very favorable moat and a comparable B+ rating, with better liquidity but moderate debt levels.
For investors, KO might appear suitable for those valuing stability and durable competitive advantage, while COKE could be seen as attractive for growth-focused investors given its accelerating price trend and robust income growth metrics.
Disclaimer: Investment carries a risk of loss of initial capital. The past performance is not a reliable indicator of future results. Be sure to understand risks before making an investment decision.
Go Further
I encourage you to read the complete analyses of The Coca-Cola Company and Coca-Cola Consolidated, Inc. to enhance your investment decisions: