Home > Comparison > Consumer Defensive > PEP vs COKE
The strategic rivalry between PepsiCo, Inc. and Coca-Cola Consolidated, Inc. shapes the competitive landscape of the non-alcoholic beverages sector. PepsiCo operates as a diversified consumer defensive powerhouse with a broad portfolio spanning snacks and beverages. In contrast, Coca-Cola Consolidated focuses on beverage distribution, primarily bottling and delivering The Coca-Cola Company’s products. This analysis evaluates which operational model offers superior risk-adjusted returns for a well-diversified investment portfolio.
Table of contents
Companies Overview
PepsiCo and Coca-Cola Consolidated dominate the non-alcoholic beverages sector with distinct market approaches and scale.
PepsiCo, Inc.: Diversified Food and Beverage Powerhouse
PepsiCo leads as a global consumer goods giant with a broad portfolio spanning beverages and convenient foods. Its core revenue engine combines snack sales with beverage distribution across seven geographic segments. In 2026, PepsiCo strategically emphasizes integrated supply chains and expanding direct-to-consumer e-commerce to strengthen its competitive moat.
Coca-Cola Consolidated, Inc.: Regional Beverage Bottler
Coca-Cola Consolidated acts as the largest independent bottler of Coca-Cola products in the United States. It generates revenue by manufacturing, marketing, and distributing sparkling and still beverages, including energy drinks, primarily for Coca-Cola and other brands. The company’s 2026 focus lies in deepening retail partnerships and optimizing fountain syrup sales channels to enhance market penetration.
Strategic Collision: Similarities & Divergences
PepsiCo pursues a diversified portfolio and global scale, while Coca-Cola Consolidated specializes in beverage bottling with a regional footprint. Their primary battleground is beverage distribution, where PepsiCo’s vertical integration contrasts with Coca-Cola Consolidated’s focused bottling expertise. This creates distinct investment profiles: one prioritizes broad market reach and product diversity, the other emphasizes operational efficiency and niche dominance.
Income Statement Comparison
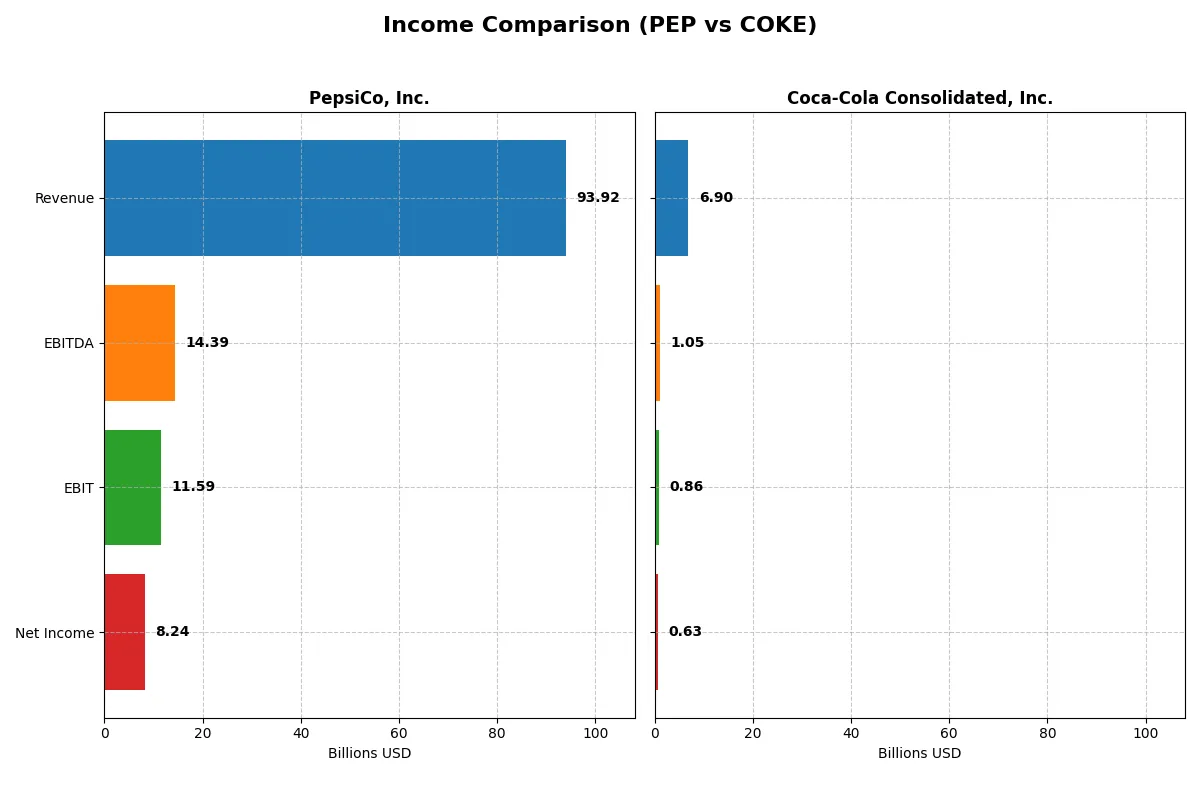
This data dissects the core profitability and scalability of both corporate engines to reveal who dominates the bottom line:
| Metric | PepsiCo, Inc. (PEP) | Coca-Cola Consolidated, Inc. (COKE) |
|---|---|---|
| Revenue | 93.9B | 6.9B |
| Cost of Revenue | 43.1B | 4.1B |
| Operating Expenses | 39.4B | 1.8B |
| Gross Profit | 50.9B | 2.8B |
| EBITDA | 14.4B | 1.1B |
| EBIT | 11.6B | 859M |
| Interest Expense | 1.1B | 1.8M |
| Net Income | 8.2B | 633M |
| EPS | 6.01 | 7.01 |
| Fiscal Year | 2025 | 2024 |
Income Statement Analysis: The Bottom-Line Duel
This income statement comparison reveals the true efficiency and profitability of two iconic beverage giants over recent years.
PepsiCo, Inc. Analysis
PepsiCo’s revenue climbed steadily from $79B in 2021 to $94B in 2025, signaling consistent top-line growth. Net income rose from $7.6B to $9.6B by 2024 but dipped to $8.2B in 2025, reflecting margin pressure. Gross margins remain strong at 54%, yet net margins shrank to 8.8%, indicating rising costs and lower operating efficiency in the latest year.
Coca-Cola Consolidated, Inc. Analysis
Coca-Cola Consolidated’s revenue gained from $5.0B in 2020 to $6.9B in 2024, marking solid expansion. Net income surged dramatically from $172M to $633M, boosted by improved margin control. Gross margin stands at 40%, and net margin improved to 9.2%. The company shows notable momentum with a 60.7% EPS growth in the latest year, highlighting operational leverage.
Margin Power vs. Revenue Scale
PepsiCo dominates with scale and stable gross margins but faces recent margin compression and net income decline. Coca-Cola Consolidated, while smaller, excels in margin expansion and earnings growth, displaying sharper profitability improvement. Investors seeking steady revenue with scale might favor PepsiCo, while those prioritizing margin momentum and EPS growth may prefer Coca-Cola Consolidated’s profile.
Financial Ratios Comparison
These vital ratios act as a diagnostic tool to expose the underlying fiscal health, valuation premiums, and capital efficiency of the companies compared below:
| Ratios | PepsiCo, Inc. (PEP) | Coca-Cola Consolidated, Inc. (COKE) |
|---|---|---|
| ROE | 40.4% | 44.7% |
| ROIC | 11.3% | 15.5% |
| P/E | 23.9 | 18.0 |
| P/B | 9.66 | 8.03 |
| Current Ratio | 0.85 | 1.94 |
| Quick Ratio | 0.67 | 1.69 |
| D/E | 2.45 | 1.35 |
| Debt-to-Assets | 46.5% | 35.9% |
| Interest Coverage | 10.3 | 498.0 |
| Asset Turnover | 0.87 | 1.30 |
| Fixed Asset Turnover | 2.79 | 4.26 |
| Payout Ratio | 92.7% | 29.3% |
| Dividend Yield | 3.87% | 1.63% |
| Fiscal Year | 2025 | 2024 |
Efficiency & Valuation Duel: The Vital Signs
Financial ratios act as the company’s DNA, revealing hidden risks and operational excellence behind headline figures.
PepsiCo, Inc.
PepsiCo shows strong profitability with a 40.38% ROE and an 8.77% net margin, indicating efficient capital use. Its P/E of 23.92 suggests a fairly valued stock, though the high P/B ratio and low current ratio signal caution. A 3.87% dividend yield rewards shareholders, reflecting steady income distribution.
Coca-Cola Consolidated, Inc.
Coca-Cola Consolidated posts an impressive 44.66% ROE and a 9.18% net margin, demonstrating operational strength. Its P/E of 17.99 is more attractive, indicating relative undervaluation. High current and quick ratios highlight liquidity, while a modest 1.63% dividend yield suggests balanced shareholder returns with room for reinvestment.
Balanced Strength vs. Liquidity Edge
Coca-Cola Consolidated offers stronger liquidity and a cheaper valuation, while PepsiCo provides higher dividend income with solid profitability. Investors seeking operational safety may prefer Coca-Cola’s profile. Those prioritizing income might lean towards PepsiCo’s steady dividends.
Which one offers the Superior Shareholder Reward?
I see PepsiCo delivers a robust 3.87% dividend yield with a high 93% payout ratio, signaling near-full free cash flow distribution. Its buybacks are steady but less intense than Coca-Cola Consolidated’s. COKE pays a lower 1.63% yield with a conservative 29% payout ratio, preserving cash for aggressive buybacks and balance sheet strength. Historically, Pepsi’s model suits income-focused investors, while Coke’s reinvests more for capital appreciation. Given 2026’s market preference for sustainable growth plus income, I favor Coca-Cola Consolidated’s balanced approach for superior total shareholder return over PepsiCo.
Comparative Score Analysis: The Strategic Profile
The radar chart reveals the fundamental DNA and trade-offs of PepsiCo, Inc. and Coca-Cola Consolidated, Inc., highlighting their financial strengths and valuation nuances:
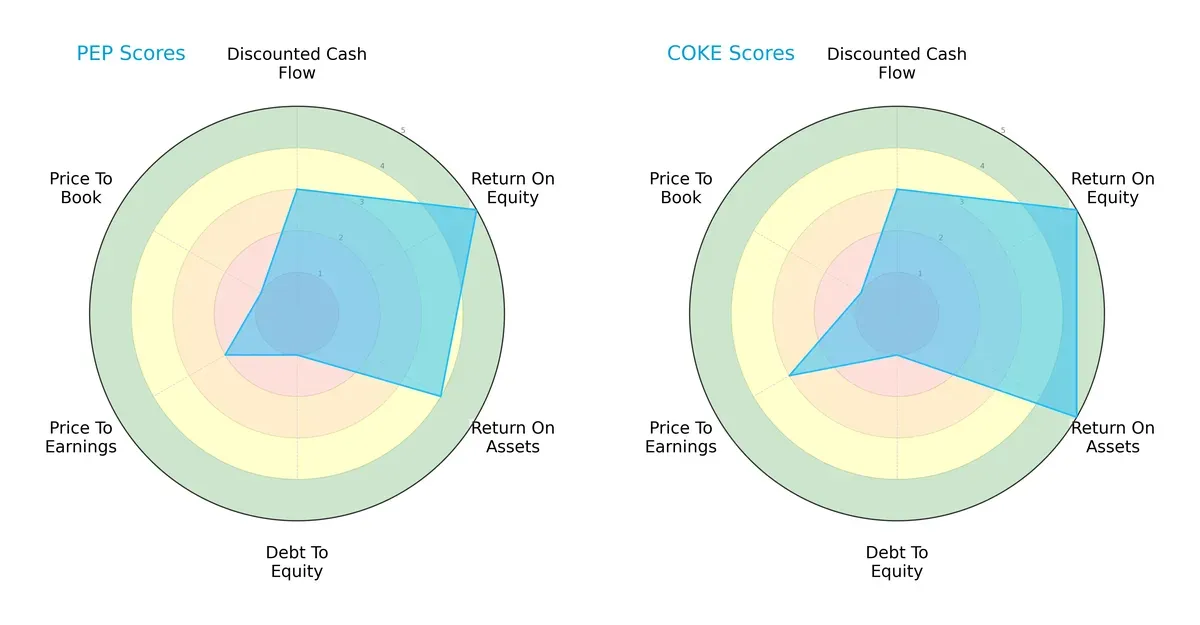
Both firms demonstrate strong Return on Equity (ROE) with top scores of 5, signaling efficient profit generation from shareholders’ equity. Coca-Cola leads slightly in Return on Assets (ROA) with a perfect 5 versus PepsiCo’s 4, indicating more effective asset utilization. Debt-to-Equity scores are equally weak at 1, reflecting high leverage risk for both. Valuation measures favor Coca-Cola modestly, with a Price-to-Earnings (P/E) score of 3 versus PepsiCo’s 2, suggesting a fairer market price. Overall, Coca-Cola presents a more balanced profile, while PepsiCo leans on its operational efficiency despite valuation and leverage concerns.
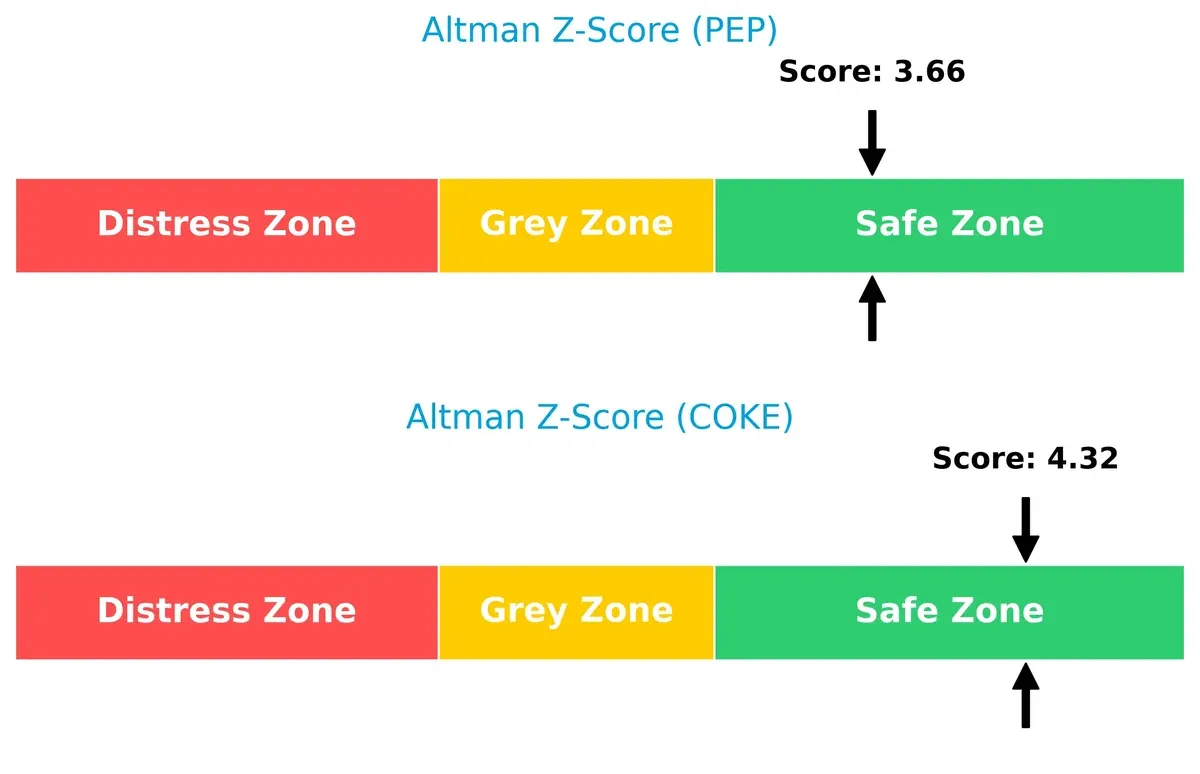
Bankruptcy Risk: Solvency Showdown
The Altman Z-Score difference signals Coca-Cola’s stronger solvency position with a 4.32 versus PepsiCo’s 3.66, both safely above the distress threshold, but Coca-Cola is more insulated from bankruptcy risk in this cycle:
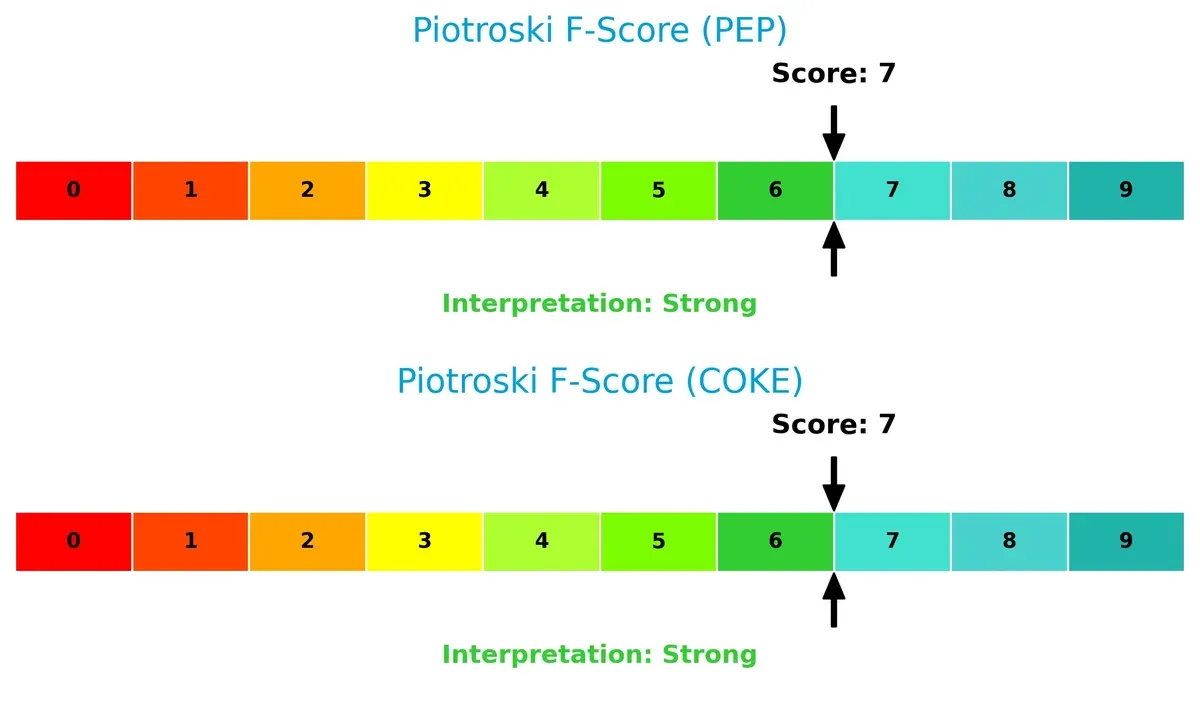
Financial Health: Quality of Operations
Both companies post strong Piotroski F-Scores of 7, indicating robust financial health and operational quality. Neither shows immediate red flags, but this score leaves room for improvement to reach peak financial strength:
How are the two companies positioned?
This section dissects the operational DNA of PepsiCo and Coca-Cola Consolidated by comparing their revenue distribution and internal dynamics. The goal is to confront their economic moats and reveal which model offers the most resilient competitive advantage today.
Revenue Segmentation: The Strategic Mix
This visual comparison dissects how PepsiCo, Inc. and Coca-Cola Consolidated, Inc. diversify their income streams and highlights their primary sector bets:
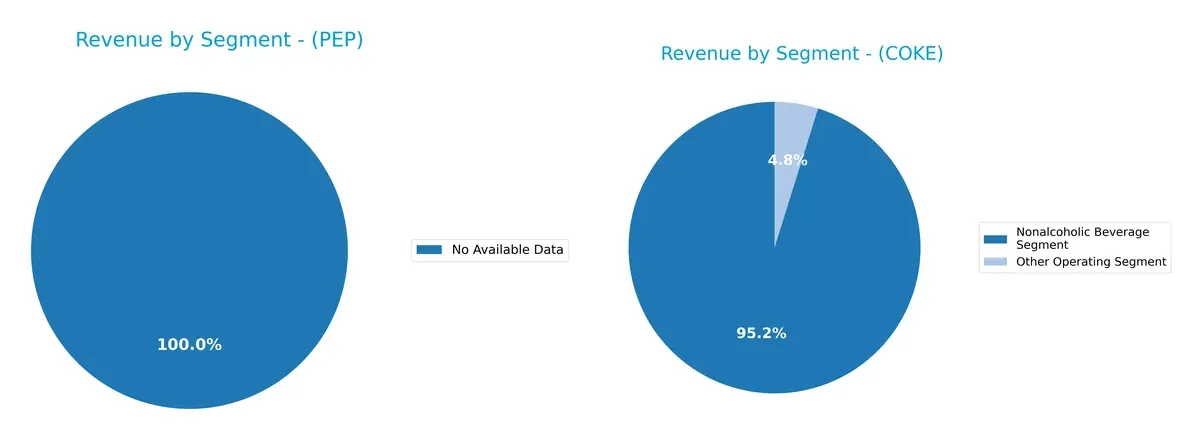
PepsiCo’s data is unavailable, preventing a direct mix comparison. Coca-Cola Consolidated anchors its revenue heavily in nonalcoholic beverages, generating around 6.8B in 2024. The other segments remain minor, under 350M, signaling high concentration risk. This reliance on beverages underscores Coca-Cola’s dominance in beverage infrastructure but limits diversification benefits. Without PepsiCo’s data, I note Coca-Cola’s strategic focus remains narrowly tied to its core segment.
Strengths and Weaknesses Comparison
This table compares the strengths and weaknesses of PepsiCo and Coca-Cola Consolidated:
PepsiCo Strengths
- Diverse global revenue across multiple countries
- Favorable ROE and ROIC indicate strong profitability
- Attractive dividend yield of 3.87%
- Favorable interest coverage supports debt servicing
Coca-Cola Strengths
- Favorable ROE and superior ROIC show effective capital use
- Strong liquidity with current and quick ratios well above 1
- High asset turnover signals operational efficiency
- Favorable interest coverage drastically reduces financial risk
PepsiCo Weaknesses
- Low current and quick ratios suggest liquidity concerns
- High debt-to-equity ratio at 2.45 indicates leverage risk
- Unfavorable price-to-book ratio may reflect market valuation pressure
Coca-Cola Weaknesses
- Elevated debt-to-equity ratio at 1.35 is a leverage risk
- Unfavorable price-to-book ratio signals valuation concerns
- Neutral dividend yield at 1.63% offers less income compared to peers
PepsiCo’s strengths lie in its diversified global footprint and solid profitability, but its liquidity and leverage ratios warrant caution. Coca-Cola shows strong operational efficiency and liquidity but carries moderate leverage and valuation risks. Both companies balance strengths with notable financial vulnerabilities that influence their strategic positioning.
The Moat Duel: Analyzing Competitive Defensibility
A structural moat protects a company’s long-term profits from relentless competitive pressure. Here’s how PepsiCo and Coca-Cola Consolidated safeguard their economic value:
PepsiCo, Inc.: Diversified Brand Power and Scale Economies
PepsiCo leverages strong brand recognition and extensive distribution networks as its moat. This manifests in stable gross margins near 54% and consistent value creation with ROIC exceeding WACC by 6%. However, declining ROIC signals emerging profitability pressure in 2026.
Coca-Cola Consolidated, Inc.: Focused Bottling Efficiency and Growing Returns
Unlike PepsiCo’s broad portfolio, Coca-Cola Consolidated’s moat centers on its bottling exclusivity and operational efficiency. Its ROIC surpasses WACC by over 9%, with a robust upward trend, reflecting expanding profitability and strengthening market control heading into 2026.
Scale and Efficiency: Brand Diversification vs. Bottling Mastery
PepsiCo’s moat is wide with diversified revenue streams, but Coca-Cola Consolidated’s moat is deeper due to improving capital returns and operational focus. I see Coca-Cola Consolidated better positioned to defend and grow its market share sustainably.
Which stock offers better returns?
The past year saw Coca-Cola Consolidated, Inc. surge with a steep bullish trend while PepsiCo, Inc. showed steady gains and accelerating momentum.
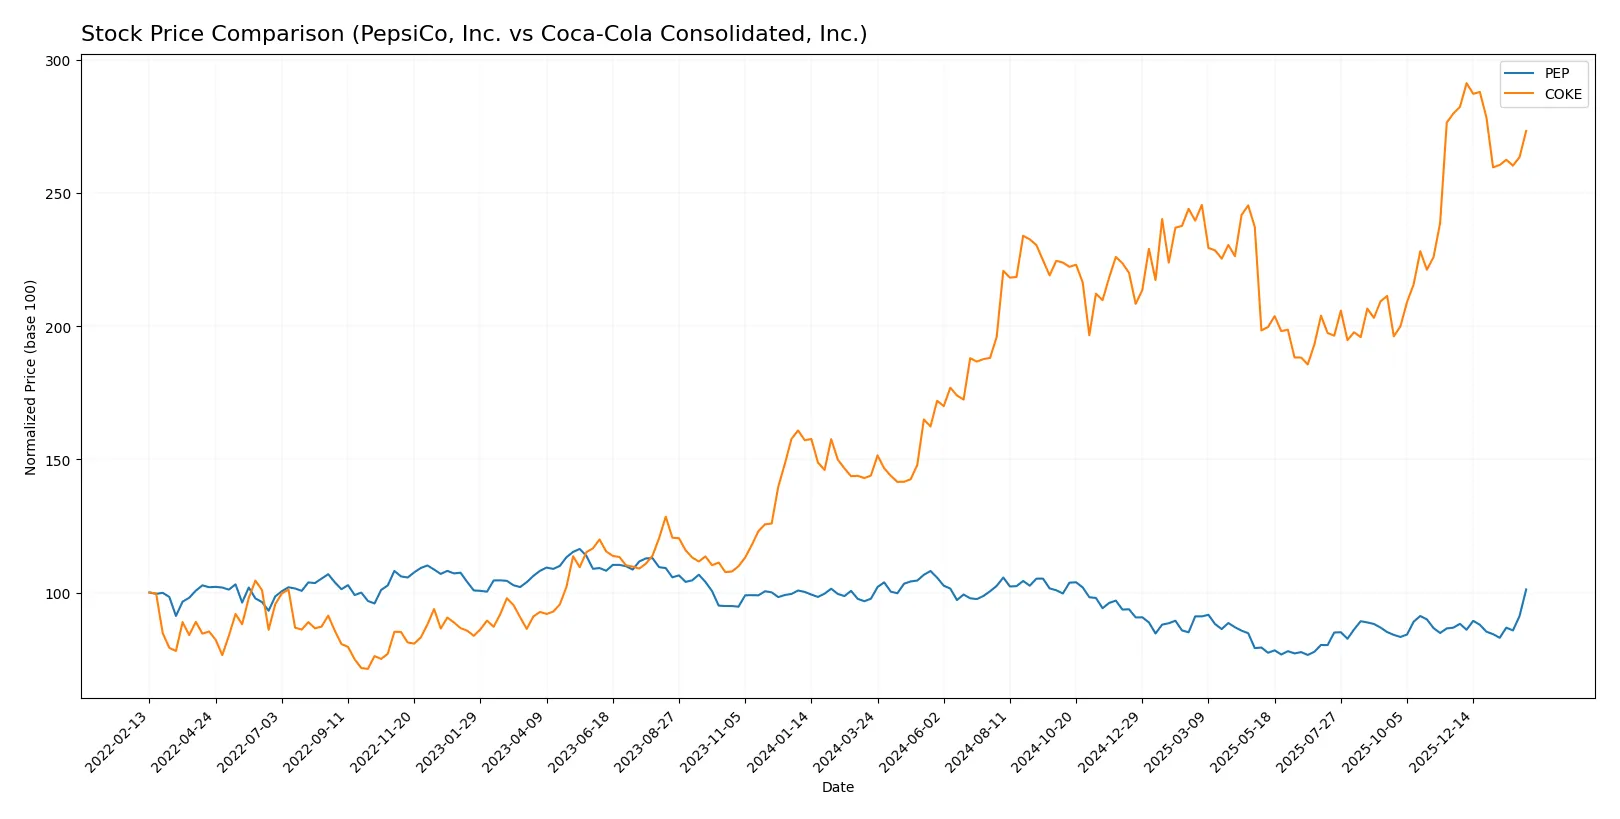
Trend Comparison
PepsiCo, Inc. delivered a 3.54% price increase over the last 12 months, marking a bullish trend with accelerating momentum and a price range between 129.07 and 182.19.
Coca-Cola Consolidated, Inc. surged 89.93% over the same period, showing a strong bullish trend but with decelerating momentum and a wider price range from 81.69 to 168.08.
Coca-Cola Consolidated, Inc. outperformed PepsiCo, Inc. significantly, despite recent short-term weakness, delivering the highest market returns over the past year.
Target Prices
Analysts present a clear target price consensus for PepsiCo, Inc., reflecting moderate upside potential.
| Company | Target Low | Target High | Consensus |
|---|---|---|---|
| PepsiCo, Inc. | 144 | 191 | 167.75 |
The consensus target of 167.75 suggests a slight undervaluation relative to PepsiCo’s current price of 170.49. No verified target price data is available for Coca-Cola Consolidated, Inc.

Don’t Let Luck Decide Your Entry Point
Optimize your entry points with our advanced ProRealTime indicators. You’ll get efficient buy signals with precise price targets for maximum performance. Start outperforming now!
How do institutions grade them?
Institutional grades for PepsiCo, Inc. and Coca-Cola Consolidated, Inc. show their recent analyst evaluations:
PepsiCo, Inc. Grades
The table below shows recent grades from notable financial institutions for PepsiCo, Inc.:
| Grading Company | Action | New Grade | Date |
|---|---|---|---|
| JP Morgan | Maintain | Overweight | 2026-02-04 |
| Citigroup | Maintain | Buy | 2026-02-04 |
| Wells Fargo | Maintain | Equal Weight | 2026-02-04 |
| UBS | Maintain | Buy | 2026-01-14 |
| Citigroup | Maintain | Buy | 2025-12-17 |
| Barclays | Maintain | Equal Weight | 2025-12-11 |
| JP Morgan | Upgrade | Overweight | 2025-12-10 |
| Piper Sandler | Maintain | Overweight | 2025-12-09 |
| Piper Sandler | Maintain | Overweight | 2025-11-21 |
| Freedom Capital Markets | Downgrade | Hold | 2025-10-23 |
Coca-Cola Consolidated, Inc. Grades
The table below shows past grades from Citigroup for Coca-Cola Consolidated, Inc.:
| Grading Company | Action | New Grade | Date |
|---|---|---|---|
| Citigroup | Maintain | Neutral | 2016-05-20 |
| Citigroup | Maintain | Neutral | 2016-05-19 |
| Citigroup | Maintain | Neutral | 2015-07-27 |
| Citigroup | Maintain | Neutral | 2015-07-26 |
| Citigroup | Maintain | Neutral | 2015-05-07 |
| Citigroup | Maintain | Neutral | 2015-05-06 |
| Citigroup | Maintain | Neutral | 2015-03-06 |
| Citigroup | Maintain | Neutral | 2015-03-05 |
| Citigroup | Maintain | Neutral | 2014-11-13 |
| Citigroup | Maintain | Neutral | 2014-11-12 |
Which company has the best grades?
PepsiCo, Inc. receives more recent and generally positive grades, including multiple “Buy” and “Overweight” ratings. Coca-Cola Consolidated, Inc. holds older, consistently “Neutral” grades. This suggests stronger institutional confidence in PepsiCo, potentially influencing investor perception and market demand.
Risks specific to each company
The following categories identify the critical pressure points and systemic threats facing both firms in the 2026 market environment:
1. Market & Competition
PepsiCo, Inc.
- Faces intense competition in snacks and beverages globally, with diversified product segments mitigating risks.
Coca-Cola Consolidated, Inc.
- Primarily a bottler with concentrated geographic exposure, heavily dependent on Coca-Cola product demand.
2. Capital Structure & Debt
PepsiCo, Inc.
- High debt-to-equity ratio (2.45) signals elevated leverage, raising financial risk despite favorable interest coverage.
Coca-Cola Consolidated, Inc.
- Lower leverage (1.35) and exceptional interest coverage (464.56) indicate a stronger balance sheet and lower debt risk.
3. Stock Volatility
PepsiCo, Inc.
- Low beta (0.416) suggests defensive stock behavior with limited market volatility exposure.
Coca-Cola Consolidated, Inc.
- Moderately higher beta (0.646) implies slightly more sensitivity to market swings but still relatively stable.
4. Regulatory & Legal
PepsiCo, Inc.
- Global operations expose it to diverse regulatory environments and compliance risks, including food safety and labeling.
Coca-Cola Consolidated, Inc.
- Primarily US-focused, facing fewer regulatory jurisdictions but still subject to federal and state beverage regulations.
5. Supply Chain & Operations
PepsiCo, Inc.
- Complex global supply chain with risks from raw material costs and logistics disruptions.
Coca-Cola Consolidated, Inc.
- Supply chain more localized but vulnerable to bottling and distribution network constraints.
6. ESG & Climate Transition
PepsiCo, Inc.
- Large footprint with significant initiatives in sustainability, but faces pressure to reduce environmental impact globally.
Coca-Cola Consolidated, Inc.
- Smaller scale but still under scrutiny for packaging waste and water usage in production processes.
7. Geopolitical Exposure
PepsiCo, Inc.
- Operates in multiple international markets, exposing it to geopolitical risks like trade tensions and currency fluctuations.
Coca-Cola Consolidated, Inc.
- Concentrated in the US, hence less exposed to direct geopolitical risks abroad.
Which company shows a better risk-adjusted profile?
Coca-Cola Consolidated’s lower leverage and stronger liquidity ratios signal a more robust financial footing. PepsiCo’s global reach boosts market diversification but introduces elevated geopolitical and operational risks. Both firms hold solid positions, but Coca-Cola Consolidated’s safer balance sheet and simpler structure deliver a superior risk-adjusted profile in 2026.
Final Verdict: Which stock to choose?
PepsiCo, Inc. excels as a cash-generating powerhouse with a robust economic moat, delivering strong returns on invested capital. Its key point of vigilance lies in a somewhat stretched liquidity position, which could pressure short-term flexibility. This stock fits well in an aggressive growth portfolio seeking steady income and capital appreciation.
Coca-Cola Consolidated, Inc. boasts a strategic moat through operational efficiency and a highly favorable financial stability profile. Its strong balance sheet and growing return on capital signal durable competitive advantages, offering better downside protection. This makes it suitable for a GARP (Growth at a Reasonable Price) portfolio seeking stability with growth potential.
If you prioritize aggressive growth and high cash flow generation, PepsiCo is the compelling choice due to its scale and profitability despite liquidity concerns. However, if you seek superior balance sheet strength and a sustainable competitive advantage with less volatility, Coca-Cola Consolidated offers better stability and an improving profitability trend.
Disclaimer: Investment carries a risk of loss of initial capital. The past performance is not a reliable indicator of future results. Be sure to understand risks before making an investment decision.
Go Further
I encourage you to read the complete analyses of PepsiCo, Inc. and Coca-Cola Consolidated, Inc. to enhance your investment decisions: