Keurig Dr Pepper Inc. (KDP) and Coca-Cola Consolidated, Inc. (COKE) are two prominent players in the non-alcoholic beverages industry, each with a unique market approach and innovation strategy. KDP excels in coffee systems and diverse beverage concentrates, while COKE focuses on bottling and distributing iconic Coca-Cola products alongside other popular brands. This comparison will help you identify which company offers the best investment opportunity in today’s competitive beverage market.
Table of contents
Companies Overview
I will begin the comparison between Keurig Dr Pepper Inc. and Coca-Cola Consolidated, Inc. by providing an overview of these two companies and their main differences.
Keurig Dr Pepper Inc. Overview
Keurig Dr Pepper Inc. operates as a diversified beverage company in the US and internationally, focusing on coffee systems, packaged beverages, beverage concentrates, and Latin American beverages. Its portfolio includes well-known brands such as Dr Pepper, Canada Dry, and Snapple, serving retailers, distributors, and end consumers. Founded in 1981 and headquartered in Burlington, Massachusetts, it employs around 29,000 people and trades on NASDAQ under the ticker KDP.
Coca-Cola Consolidated, Inc. Overview
Coca-Cola Consolidated, Inc. is the largest independent Coca-Cola bottler in the US, manufacturing, marketing, and distributing nonalcoholic beverages, including sparkling and still products like energy drinks and bottled water. It serves grocery stores, restaurants, and vending outlets, distributing both Coca-Cola products and other brands like Dr Pepper and Monster Energy. Established in 1980 and based in Charlotte, North Carolina, it has approximately 15,000 employees and trades on NASDAQ under the ticker COKE.
Key similarities and differences
Both companies operate in the non-alcoholic beverage industry and distribute major brands including Dr Pepper. Keurig Dr Pepper has a broader product range including coffee systems and Latin American beverages, while Coca-Cola Consolidated focuses primarily on bottling and distribution of Coca-Cola products and related brands. KDP has a larger workforce and market cap (37.6B vs. 13.1B), reflecting differences in scale and business scope.
Income Statement Comparison
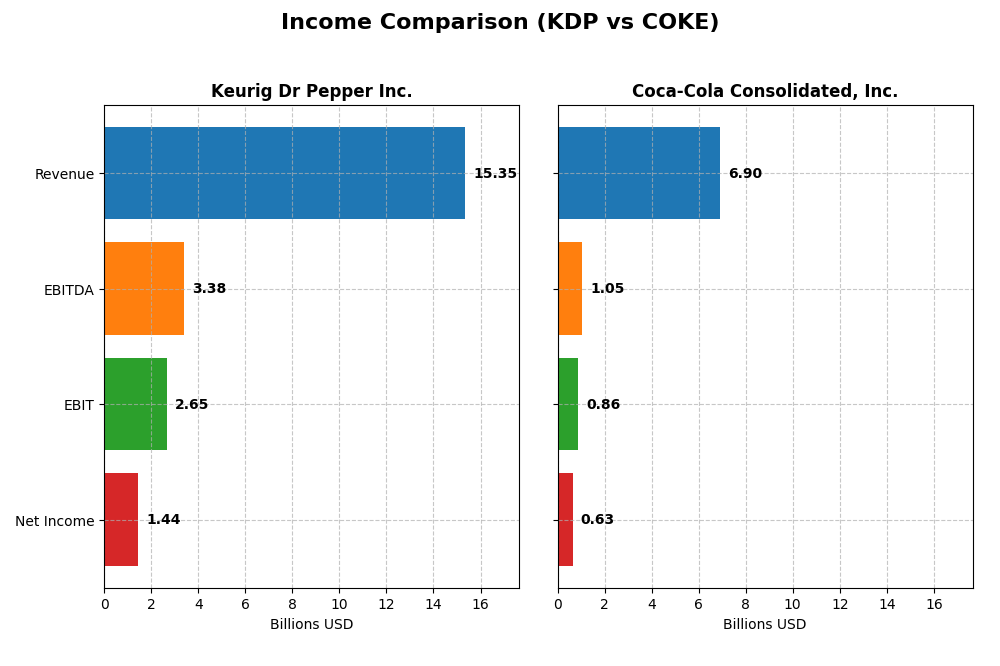
Below is a side-by-side comparison of key income statement metrics for Keurig Dr Pepper Inc. and Coca-Cola Consolidated, Inc. for the fiscal year 2024.
| Metric | Keurig Dr Pepper Inc. (KDP) | Coca-Cola Consolidated, Inc. (COKE) |
|---|---|---|
| Market Cap | 37.6B | 13.1B |
| Revenue | 15.35B | 6.90B |
| EBITDA | 3.38B | 1.05B |
| EBIT | 2.65B | 859M |
| Net Income | 1.44B | 633M |
| EPS | 1.06 | 7.01 |
| Fiscal Year | 2024 | 2024 |
Income Statement Interpretations
Keurig Dr Pepper Inc.
Keurig Dr Pepper’s revenue increased steadily from 11.6B in 2020 to 15.4B in 2024, showing 32.13% growth over five years. Net income fluctuated, peaking above 2.1B then falling to 1.44B in 2024, indicating some recent pressure. Margins remain solid with a 55.56% gross margin, though net margin declined by 36.24% in the last year, reflecting margin compression despite revenue growth.
Coca-Cola Consolidated, Inc.
Coca-Cola Consolidated’s revenue rose consistently from 5B in 2020 to nearly 6.9B in 2024, achieving 37.79% growth overall. Net income surged notably, from 172M to 633M, with a 267.04% increase over five years. Margins improved significantly, with the net margin growing 49.51% in the last year and a favorable gross margin near 40%, highlighting strong operational efficiency and profitability gains recently.
Which one has the stronger fundamentals?
Coca-Cola Consolidated exhibits stronger fundamentals with higher overall growth in net income and margin improvement, supported by favorable profitability metrics and significant EPS gains. Keurig Dr Pepper shows stable revenue growth but faces challenges with recent margin contraction and declining net income. Both maintain favorable income statements, yet Coca-Cola Consolidated’s stronger margin expansion and income growth lead in fundamental strength.
Financial Ratios Comparison
This table presents the most recent key financial ratios for Keurig Dr Pepper Inc. (KDP) and Coca-Cola Consolidated, Inc. (COKE) based on their 2024 fiscal year data, facilitating a clear side-by-side analysis.
| Ratios | Keurig Dr Pepper Inc. (KDP) | Coca-Cola Consolidated, Inc. (COKE) |
|---|---|---|
| ROE | 5.94% | 44.66% |
| ROIC | 4.04% | 15.55% |
| P/E | 30.36 | 17.99 |
| P/B | 1.80 | 8.03 |
| Current Ratio | 0.49 | 1.94 |
| Quick Ratio | 0.33 | 1.69 |
| D/E (Debt to Equity) | 0.71 | 1.35 |
| Debt-to-Assets | 32.33% | 35.89% |
| Interest Coverage | 3.79 | 498.02 |
| Asset Turnover | 0.29 | 1.30 |
| Fixed Asset Turnover | 3.99 | 4.26 |
| Payout Ratio | 82.86% | 29.32% |
| Dividend Yield | 2.73% | 1.63% |
Interpretation of the Ratios
Keurig Dr Pepper Inc.
Keurig Dr Pepper shows a mixed ratio profile with several unfavorable indicators such as low return on equity (5.94%) and return on invested capital (4.04%), alongside weak liquidity ratios (current ratio 0.49). Asset turnover is also low at 0.29, signaling efficiency concerns. The dividend yield is favorable at 2.73%, supported by a consistent payout, but free cash flow coverage and debt levels warrant caution.
Coca-Cola Consolidated, Inc.
Coca-Cola Consolidated presents a stronger ratio framework, with favorable returns on equity (44.66%) and invested capital (15.55%), alongside high interest coverage (465) and efficient asset turnover (1.3). Liquidity is robust, with a current ratio of 1.94. Its dividend yield is moderate at 1.63%, reflecting a stable payout policy supported by strong free cash flow and manageable debt.
Which one has the best ratios?
Coca-Cola Consolidated holds the advantage with predominantly favorable ratios, including superior profitability, liquidity, and operational efficiency. Keurig Dr Pepper’s ratios are more mixed, with several unfavorable metrics and liquidity concerns. Overall, Coca-Cola Consolidated exhibits a more robust financial profile based on the evaluated ratios.
Strategic Positioning
This section compares the strategic positioning of Keurig Dr Pepper Inc. and Coca-Cola Consolidated, Inc., focusing on market position, key segments, and exposure to disruption:
Keurig Dr Pepper Inc.
- Larger market cap at 37.6B with lower beta indicating less volatility and moderate competitive pressure.
- Diversified segments including Coffee Systems, Packaged Beverages, Beverage Concentrates, Latin America Beverages.
- Exposure to technological disruption moderate, mainly in coffee systems and packaged beverage innovation.
Coca-Cola Consolidated, Inc.
- Smaller market cap at 13.1B with higher beta, facing steady competitive pressure in beverage bottling.
- Concentrated mainly on nonalcoholic beverage bottling and distribution, including Coca-Cola products and partners.
- Limited direct technological disruption, focused on traditional bottling and distribution channels.
Keurig Dr Pepper Inc. vs Coca-Cola Consolidated, Inc. Positioning
KDP leverages a diversified beverage portfolio covering multiple product types and regions, offering broad revenue streams. COKE focuses on bottling and distribution of Coca-Cola and partner brands, concentrating its business model but with less product variety.
Which has the best competitive advantage?
Based on MOAT evaluation, COKE holds a very favorable position with growing ROIC and value creation, while KDP shows a very unfavorable trend with declining ROIC and value destruction, indicating COKE’s stronger competitive advantage.
Stock Comparison
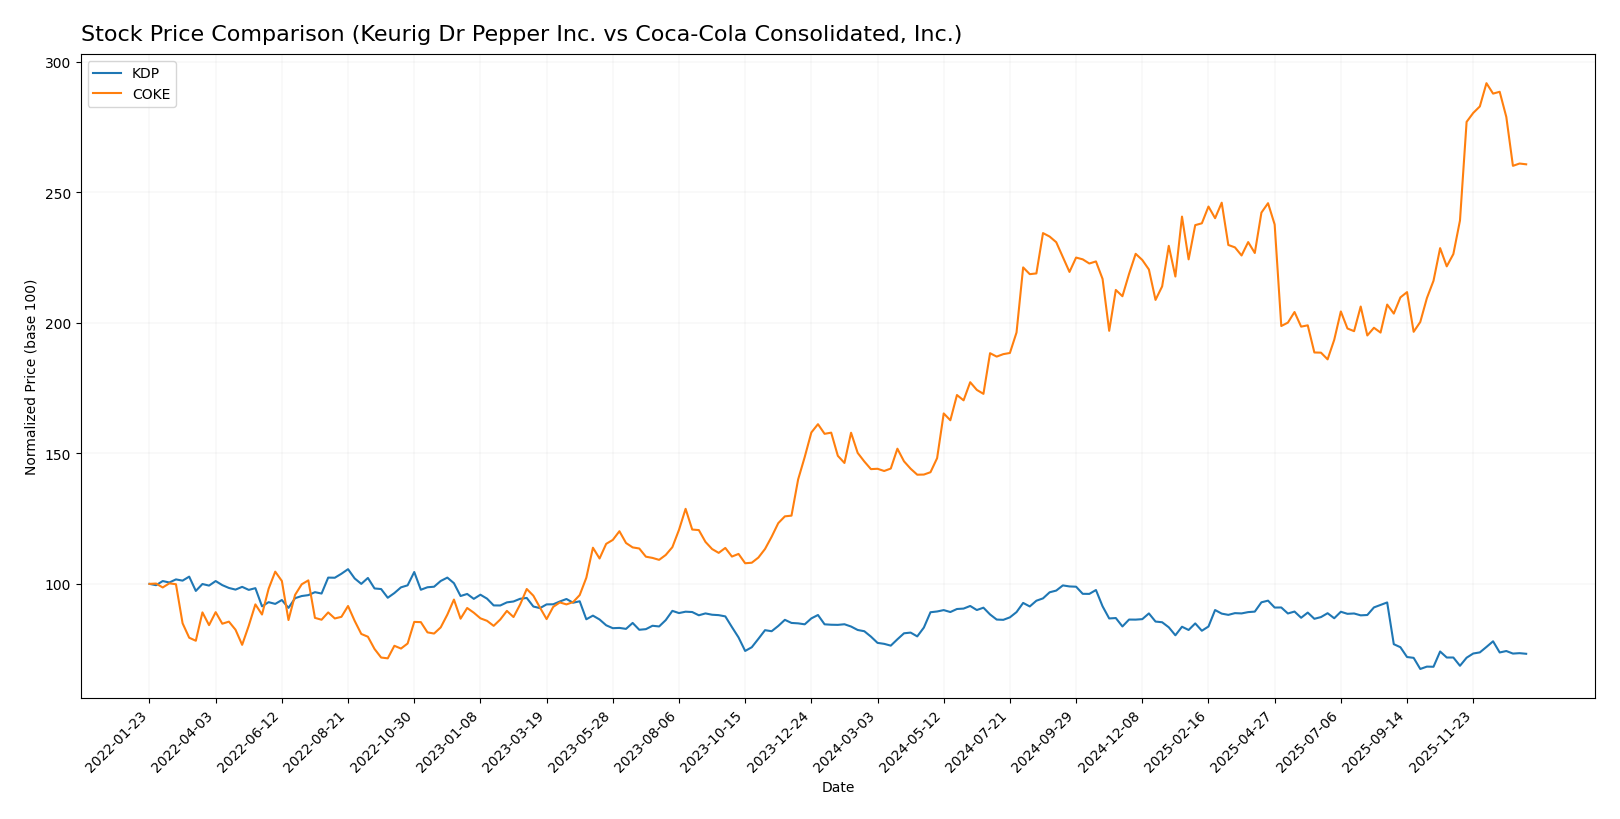
The stock price chart highlights divergent trends over the past 12 months, with Coca-Cola Consolidated, Inc. showing strong bullish momentum and Keurig Dr Pepper Inc. experiencing a bearish phase marked by accelerating decline.
Trend Analysis
Keurig Dr Pepper Inc. (KDP) showed a bearish trend over the past year with a price decline of 8.25%, accompanied by accelerating downward movement and moderate volatility (std. dev. 2.98). Recent weeks showed a slight positive trend of +1.99%.
Coca-Cola Consolidated, Inc. (COKE) delivered a robust bullish trend over the past year with an 81.11% price increase, accelerating gains, and high volatility (std. dev. 20.47). The recent period also showed strong upward momentum (+15.19%).
Comparing the two, COKE significantly outperformed KDP in market performance over the last 12 months, exhibiting a clear bullish trend versus KDP’s bearish trajectory.
Target Prices
The target price consensus for Keurig Dr Pepper Inc. suggests moderate upside potential.
| Company | Target High | Target Low | Consensus |
|---|---|---|---|
| Keurig Dr Pepper Inc. | 38 | 24 | 32 |
Analysts expect Keurig Dr Pepper’s stock to trade around $32 on average, above the current price of $27.7, indicating potential for appreciation. No verified target price data is available for Coca-Cola Consolidated, Inc.
Analyst Opinions Comparison
This section compares analysts’ ratings and grades for Keurig Dr Pepper Inc. and Coca-Cola Consolidated, Inc.:
Rating Comparison
KDP Rating
- Rating: B, considered very favorable overall.
- Discounted Cash Flow Score: 4, favorable indication of valuation.
- ROE Score: 3, moderate efficiency in generating profit from equity.
- ROA Score: 3, moderate effectiveness in asset utilization.
- Debt To Equity Score: 2, moderate financial risk.
- Overall Score: 3, moderate overall financial standing.
COKE Rating
- Rating: B+, also very favorable overall.
- Discounted Cash Flow Score: 3, moderate indication of valuation.
- ROE Score: 5, very favorable, highly efficient at generating profit from equity.
- ROA Score: 5, very favorable, highly effective at asset utilization.
- Debt To Equity Score: 1, very unfavorable, indicates higher financial risk.
- Overall Score: 3, moderate overall financial standing.
Which one is the best rated?
Coca-Cola Consolidated holds a slightly higher rating of B+ compared to KDP’s B, driven by superior ROE and ROA scores. However, KDP shows a better discounted cash flow score and a stronger debt-to-equity position, balancing the overall moderate scores equally.
Scores Comparison
Here is a comparison of the financial scores for Keurig Dr Pepper Inc. (KDP) and Coca-Cola Consolidated, Inc. (COKE):
KDP Scores
- Altman Z-Score: 1.33, indicating financial distress zone.
- Piotroski Score: 6, reflecting average financial strength.
COKE Scores
- Altman Z-Score: 4.33, indicating a safe financial zone.
- Piotroski Score: 7, reflecting strong financial strength.
Which company has the best scores?
Based on the provided data, COKE has the better financial scores with a safe zone Altman Z-Score and a strong Piotroski Score, while KDP is in distress and has only average strength.
Grades Comparison
The following is a comparison of the latest reliable grades given to Keurig Dr Pepper Inc. and Coca-Cola Consolidated, Inc.:
Keurig Dr Pepper Inc. Grades
Here are the recent grades assigned by reputable grading companies for Keurig Dr Pepper Inc.:
| Grading Company | Action | New Grade | Date |
|---|---|---|---|
| Jefferies | Downgrade | Hold | 2025-12-17 |
| Piper Sandler | Maintain | Overweight | 2025-12-15 |
| Barclays | Maintain | Equal Weight | 2025-10-28 |
| Wells Fargo | Maintain | Overweight | 2025-10-28 |
| JP Morgan | Maintain | Overweight | 2025-10-20 |
| B of A Securities | Maintain | Buy | 2025-10-08 |
| Goldman Sachs | Maintain | Neutral | 2025-10-02 |
| Wells Fargo | Maintain | Overweight | 2025-09-25 |
| Barclays | Downgrade | Equal Weight | 2025-09-24 |
| BNP Paribas | Downgrade | Underperform | 2025-09-22 |
Overall, the grades for Keurig Dr Pepper Inc. show a range from Buy to Underperform with several recent downgrades, indicating mixed but generally cautious sentiment.
Coca-Cola Consolidated, Inc. Grades
The available grades for Coca-Cola Consolidated, Inc. are dated and all from Citigroup:
| Grading Company | Action | New Grade | Date |
|---|---|---|---|
| Citigroup | Maintain | Neutral | 2016-05-20 |
| Citigroup | Maintain | Neutral | 2016-05-19 |
| Citigroup | Maintain | Neutral | 2015-07-27 |
| Citigroup | Maintain | Neutral | 2015-07-26 |
| Citigroup | Maintain | Neutral | 2015-05-07 |
| Citigroup | Maintain | Neutral | 2015-05-06 |
| Citigroup | Maintain | Neutral | 2015-03-06 |
| Citigroup | Maintain | Neutral | 2015-03-05 |
| Citigroup | Maintain | Neutral | 2014-11-13 |
| Citigroup | Maintain | Neutral | 2014-11-12 |
The grades for Coca-Cola Consolidated, Inc. have remained consistent at Neutral for several years, reflecting a stable but unenthusiastic outlook.
Which company has the best grades?
Keurig Dr Pepper Inc. has received generally more favorable and recent grades, with a consensus of Buy supported by multiple firms, despite some downgrades. Coca-Cola Consolidated, Inc.’s grades are older and uniformly Neutral, which may imply less current analyst engagement or a more cautious stance. This contrast could affect investor perception of growth potential and risk.
Strengths and Weaknesses
Below is a comparison table highlighting key strengths and weaknesses of Keurig Dr Pepper Inc. (KDP) and Coca-Cola Consolidated, Inc. (COKE) based on the latest financial and operational data.
| Criterion | Keurig Dr Pepper Inc. (KDP) | Coca-Cola Consolidated, Inc. (COKE) |
|---|---|---|
| Diversification | Moderate product range with focus on coffee systems and beverages; regional presence in Latin America | Strong focus on nonalcoholic beverages with broad product portfolio and operating segments |
| Profitability | Net margin ~9.4%, ROIC 4.0% below WACC; declining ROIC trend, value destroying | Net margin ~9.2%, ROIC 15.6% well above WACC; growing ROIC, value creating |
| Innovation | Moderate innovation mainly in coffee appliances and pods | Continuous innovation in beverage offerings and packaging |
| Global presence | Limited mostly to North America and Latin America markets | Strong US presence with expanding distribution and operational scale |
| Market Share | Significant in coffee pods and packaged beverages segments | Leading position in nonalcoholic beverage distribution in the US |
Key takeaways: Coca-Cola Consolidated demonstrates a stronger economic moat with efficient capital use, growing profitability, and favorable financial ratios. Keurig Dr Pepper faces challenges with declining returns and weaker liquidity, signaling higher investment risk despite solid product segments.
Risk Analysis
Below is a comparison of key risks faced by Keurig Dr Pepper Inc. (KDP) and Coca-Cola Consolidated, Inc. (COKE) as of 2024.
| Metric | Keurig Dr Pepper Inc. (KDP) | Coca-Cola Consolidated, Inc. (COKE) |
|---|---|---|
| Market Risk | Low beta (0.35) indicates lower volatility but high P/E (30.36) suggests valuation risk | Moderate beta (0.64) with more balanced P/E (17.99) reduces market risk |
| Debt level | Moderate debt-to-assets (32.3%), debt/equity 0.71 – manageable but watch liquidity (current ratio 0.49) | Slightly higher debt-to-assets (35.9%), higher debt/equity (1.35), but excellent interest coverage (464.56) |
| Regulatory Risk | Subject to US and Latin America beverage regulations; moderate risk from packaging and health policies | Similar regulatory exposure, potentially higher scrutiny due to larger footprint |
| Operational Risk | Lower asset turnover (0.29) signals operational inefficiency | Better asset utilization (1.3), more efficient operations |
| Environmental Risk | Moderate, linked to packaging waste and water use | Similar risks, with additional pressure on sustainability from Coca-Cola brand initiatives |
| Geopolitical Risk | Exposure to Latin America markets increases geopolitical uncertainties | Primarily US-focused, lower geopolitical risk |
KDP faces significant liquidity and operational efficiency challenges, with an Altman Z-Score in the distress zone highlighting financial fragility. COKE shows stronger financial health and operational metrics but carries higher leverage. Market valuation risk is notable for KDP due to its high P/E ratio.
Which Stock to Choose?
Keurig Dr Pepper Inc. (KDP) shows a generally favorable income statement with a 9.39% net margin, though recent declines in EBIT and net margin temper growth prospects. Its financial ratios are slightly unfavorable overall, with low current and quick ratios and moderate debt levels. The company carries a very favorable rating but suffers from a very unfavorable MOAT evaluation, indicating value destruction and declining ROIC.
Coca-Cola Consolidated, Inc. (COKE) exhibits a favorable income evolution with strong net margin growth and robust profitability metrics. Its financial ratios are predominantly favorable, including excellent return on equity and operating asset turnover, despite some unfavorable debt-to-equity and price-to-book ratios. The company holds a very favorable rating and a very favorable MOAT status, signaling durable competitive advantage and increasing profitability.
Investors focused on value creation and strong competitive moats may find COKE more aligned with stability and profitability, while those considering moderate growth amid financial challenges might interpret KDP’s profile differently. The contrast in ROIC trends and financial health suggests suitability varies by risk tolerance and investment strategy.
Disclaimer: Investment carries a risk of loss of initial capital. The past performance is not a reliable indicator of future results. Be sure to understand risks before making an investment decision.
Go Further
I encourage you to read the complete analyses of Keurig Dr Pepper Inc. and Coca-Cola Consolidated, Inc. to enhance your investment decisions: