Coca-Cola Europacific Partners PLC (CCEP) and Coca-Cola Consolidated, Inc. (COKE) are two leading players in the non-alcoholic beverages industry, both deeply connected to The Coca-Cola Company’s extensive portfolio. While CCEP operates primarily across Europe and the Pacific regions, COKE focuses on the U.S. market. Their shared innovation strategies and market overlap make them compelling subjects for comparison. This article will guide you through the key differences to identify which stock fits best in your investment portfolio.
Table of contents
Companies Overview
I will begin the comparison between Coca-Cola Europacific Partners PLC and Coca-Cola Consolidated, Inc. by providing an overview of these two companies and their main differences.
Coca-Cola Europacific Partners PLC Overview
Coca-Cola Europacific Partners PLC produces, distributes, and sells a diverse range of non-alcoholic ready-to-drink beverages, including soft drinks, waters, energy drinks, and ready-to-drink teas and coffees. Serving approximately 600 million consumers, the company operates primarily in Europe and the Pacific region, offering well-known brands such as Coca-Cola, Fanta, Sprite, and Monster Energy. It is headquartered in Uxbridge, UK, and employs 41,000 people.
Coca-Cola Consolidated, Inc. Overview
Coca-Cola Consolidated, Inc. manufactures, markets, and distributes nonalcoholic beverages of The Coca-Cola Company primarily in the United States. Its product portfolio includes sparkling and still beverages like carbonated drinks, bottled water, juices, and energy products. The company also distributes for other brands such as Dr Pepper and Monster Energy, serving retail and foodservice channels. It is based in Charlotte, North Carolina, with 15,000 employees.
Key similarities and differences
Both companies operate in the non-alcoholic beverage sector, focusing on manufacturing and distribution of Coca-Cola branded products alongside other beverage lines. While Coca-Cola Europacific Partners has a broad geographic reach in Europe and the Pacific with a larger workforce, Coca-Cola Consolidated focuses on the US market with fewer employees. Additionally, Coca-Cola Consolidated distributes for other beverage brands, highlighting a more diverse distribution portfolio in the US.
Income Statement Comparison
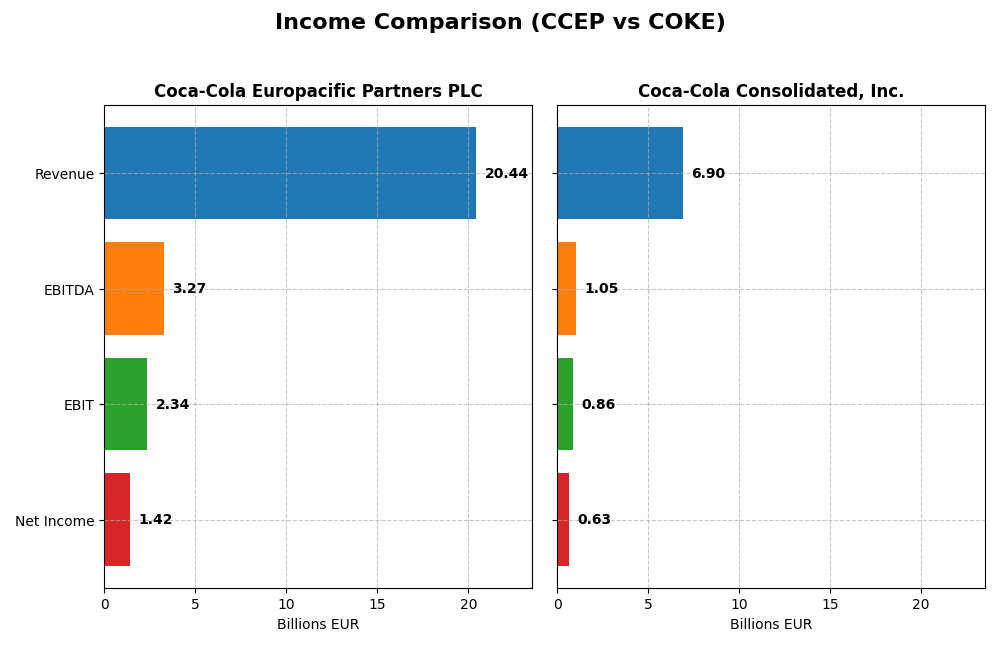
The table below presents a side-by-side comparison of key income statement metrics for Coca-Cola Europacific Partners PLC and Coca-Cola Consolidated, Inc. for the fiscal year 2024.
| Metric | Coca-Cola Europacific Partners PLC (CCEP) | Coca-Cola Consolidated, Inc. (COKE) |
|---|---|---|
| Market Cap | 40.4B EUR | 13.1B USD |
| Revenue | 20.4B EUR | 6.9B USD |
| EBITDA | 3.27B EUR | 1.05B USD |
| EBIT | 2.34B EUR | 859M USD |
| Net Income | 1.42B EUR | 633M USD |
| EPS | 3.08 EUR | 7.01 USD |
| Fiscal Year | 2024 | 2024 |
Income Statement Interpretations
Coca-Cola Europacific Partners PLC
Coca-Cola Europacific Partners PLC showed consistent revenue growth from 10.6B EUR in 2020 to 20.4B EUR in 2024, with net income rising from 498M EUR to 1.42B EUR over the same period. Margins remain generally stable, with a 35.63% gross margin and 6.94% net margin. In 2024, revenue growth accelerated by 11.67%, but net margin and EPS declined, indicating margin pressure despite top-line gains.
Coca-Cola Consolidated, Inc.
Coca-Cola Consolidated, Inc. experienced steady revenue growth from 5B USD in 2020 to 6.9B USD in 2024, while net income increased substantially from 172M USD to 633M USD. Margins improved, with a 39.9% gross margin and 9.18% net margin in 2024. The latest year showed moderate revenue growth of 3.69%, but net margin and EPS expanded significantly, reflecting improved profitability and operational efficiency.
Which one has the stronger fundamentals?
Both companies present favorable income statements with growth in revenue and net income over five years. Coca-Cola Europacific Partners has a higher absolute revenue and solid margin stability, while Coca-Cola Consolidated demonstrates stronger margin expansion and EPS growth recently. The latter’s lower interest expense and higher net margin suggest more efficient cost management. Overall, both maintain favorable fundamentals with distinct strengths.
Financial Ratios Comparison
The following table presents a selection of key financial ratios for Coca-Cola Europacific Partners PLC (CCEP) and Coca-Cola Consolidated, Inc. (COKE) for the fiscal year 2024, providing a snapshot of profitability, liquidity, leverage, efficiency, and shareholder returns.
| Ratios | Coca-Cola Europacific Partners PLC (CCEP) | Coca-Cola Consolidated, Inc. (COKE) |
|---|---|---|
| ROE | 16.7% | 44.7% |
| ROIC | 6.5% | 15.5% |
| P/E | 24.1 | 18.0 |
| P/B | 4.0 | 8.0 |
| Current Ratio | 0.81 | 1.94 |
| Quick Ratio | 0.62 | 1.69 |
| D/E (Debt-to-Equity) | 1.33 | 1.35 |
| Debt-to-Assets | 36.4% | 35.9% |
| Interest Coverage | 8.8 | 498.0 |
| Asset Turnover | 0.66 | 1.30 |
| Fixed Asset Turnover | 3.18 | 4.26 |
| Payout ratio | 64.2% | 29.3% |
| Dividend yield | 2.7% | 1.6% |
Interpretation of the Ratios
Coca-Cola Europacific Partners PLC
Coca-Cola Europacific Partners shows a mixed ratio profile with favorable returns on equity (16.7%) and interest coverage (9.67), but it faces challenges with liquidity ratios below 1 and a high price-to-book ratio (4.02). The dividend yield is attractive at 2.66%, supported by a payout ratio that appears sustainable given solid free cash flow coverage, though leverage remains a concern.
Coca-Cola Consolidated, Inc.
Coca-Cola Consolidated demonstrates strong financial health with favorable returns on equity (44.66%) and invested capital (15.55%), robust liquidity ratios above 1.5, and an exceptional interest coverage ratio (464.56). Its dividend yield of 1.63% is moderate with a stable payout, reflecting a balanced approach to shareholder returns amid solid operational efficiency and manageable debt levels.
Which one has the best ratios?
Coca-Cola Consolidated outperforms Coca-Cola Europacific Partners in most key financial metrics, displaying stronger profitability, liquidity, and interest coverage ratios. While both companies have unfavorable price-to-book ratios, Consolidated’s higher proportion of favorable ratios and lower leverage indicate a more robust financial position relative to Europacific Partners, whose liquidity and leverage metrics weigh on its profile.
Strategic Positioning
This section compares the strategic positioning of Coca-Cola Europacific Partners PLC and Coca-Cola Consolidated, Inc. focusing on Market position, Key segments, and exposure to disruption:
Coca-Cola Europacific Partners PLC
- Large market cap of 40.4B with lower beta indicates stable competitive positioning.
- Diverse beverage portfolio including soft drinks, energy drinks, waters, teas, coffees, and juices.
- No explicit data on technological disruption exposure available.
Coca-Cola Consolidated, Inc.
- Smaller market cap of 13.1B with higher beta suggests moderate market risk and competition.
- Primarily nonalcoholic beverages with sparkling, still, energy products, and distribution for other brands.
- No explicit data on technological disruption exposure available.
Coca-Cola Europacific Partners PLC vs Coca-Cola Consolidated, Inc. Positioning
Coca-Cola Europacific Partners has a more diversified product range and a significantly larger market presence, while Coca-Cola Consolidated focuses on the U.S. market with a narrower but stable segment concentration. Both face unknown disruption risks from the available data.
Which has the best competitive advantage?
Coca-Cola Consolidated shows a very favorable moat with a strong ROIC advantage and growing profitability, indicating a durable competitive advantage. Coca-Cola Europacific Partners has a slightly favorable moat with improving profitability but no confirmed competitive edge.
Stock Comparison
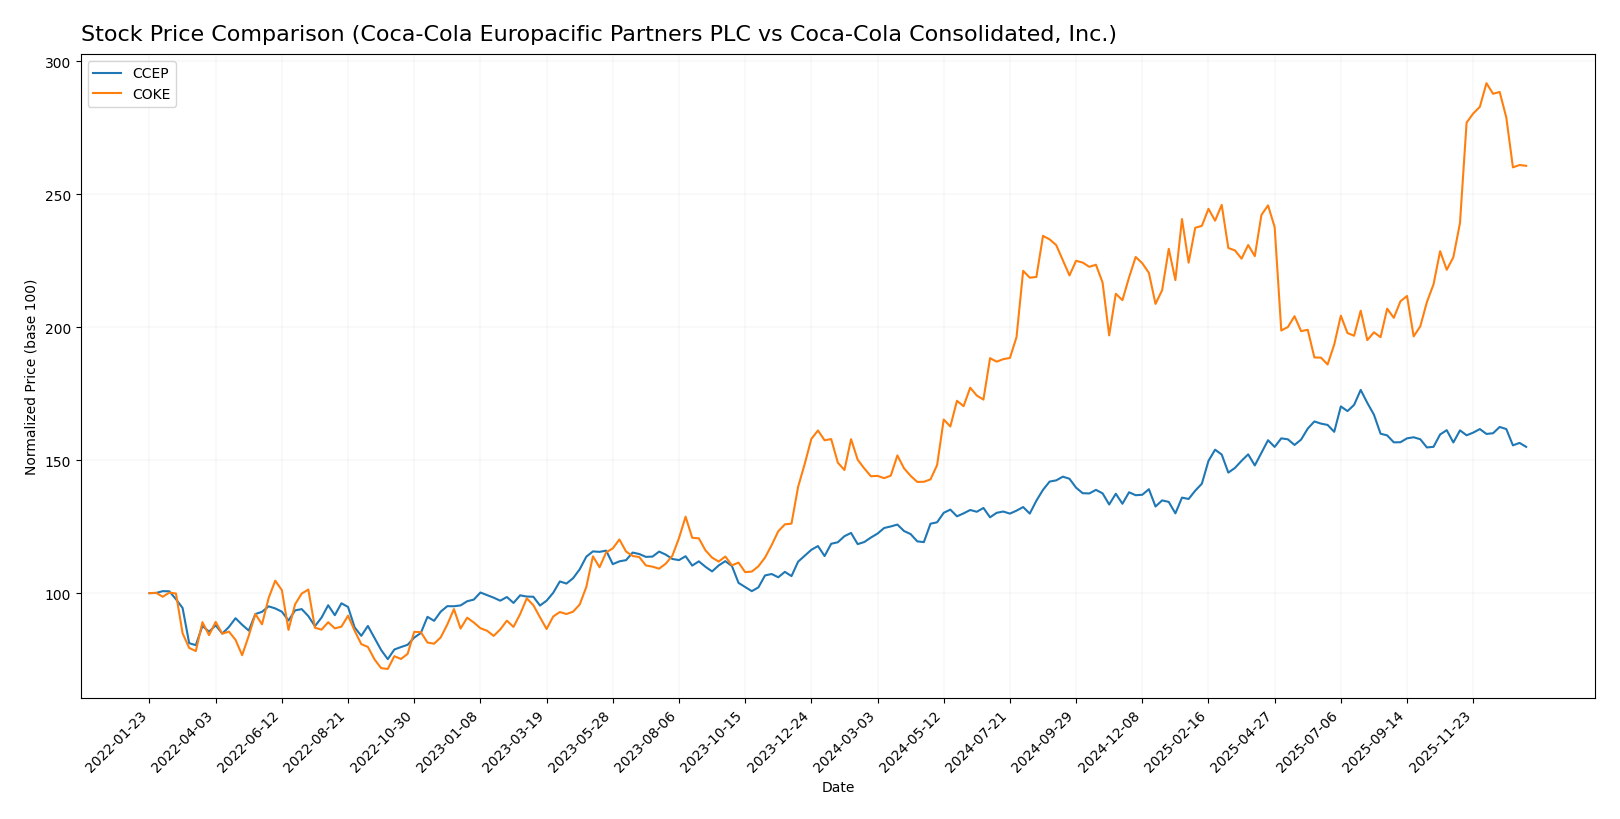
The stock price dynamics of Coca-Cola Europacific Partners PLC (CCEP) and Coca-Cola Consolidated, Inc. (COKE) over the past year reveal significant upward trends, with COKE showing stronger gains and accelerating momentum compared to CCEP’s decelerating bullish trend.
Trend Analysis
Coca-Cola Europacific Partners PLC (CCEP) experienced a bullish trend over the past 12 months with a 28.19% price increase, though momentum has decelerated recently, showing a slight negative change of -1.06% in the last quarter.
Coca-Cola Consolidated, Inc. (COKE) displayed a robust bullish trend with an 81.11% gain over the past year, accompanied by accelerating momentum and a recent 15.19% price increase, indicating strong upward movement.
Comparing both, COKE delivered the highest market performance with more pronounced acceleration and larger overall gains than CCEP in the analyzed period.
Target Prices
The target price consensus for Coca-Cola Europacific Partners PLC indicates strong analyst confidence in potential upside.
| Company | Target High | Target Low | Consensus |
|---|---|---|---|
| Coca-Cola Europacific Partners PLC | 114 | 114 | 114 |
Analysts expect Coca-Cola Europacific Partners PLC’s stock to rise from its current price of 87.89 to 114, suggesting a favorable outlook. No verified target price data is available for Coca-Cola Consolidated, Inc.
Analyst Opinions Comparison
This section compares analysts’ ratings and grades for Coca-Cola Europacific Partners PLC and Coca-Cola Consolidated, Inc.:
Rating Comparison
CCEP Rating
- Rating: B, considered very favorable overall.
- Discounted Cash Flow Score: 5, very favorable indicator of valuation.
- ROE Score: 5, very favorable efficiency in generating profit from equity.
- ROA Score: 3, moderate effectiveness in asset utilization.
- Debt To Equity Score: 1, very unfavorable, indicating higher financial risk.
- Overall Score: 3, moderate summary of financial standing.
COKE Rating
- Rating: B+, also very favorable overall.
- Discounted Cash Flow Score: 3, moderate valuation indicator.
- ROE Score: 5, equally very favorable.
- ROA Score: 5, very favorable asset utilization.
- Debt To Equity Score: 1, very unfavorable as well.
- Overall Score: 3, also moderate.
Which one is the best rated?
Based strictly on the provided data, COKE holds a slightly better rating at B+ versus CCEP’s B. COKE also scores higher on ROA and has a more moderate discounted cash flow score, while both share similar overall and debt-to-equity scores.
Scores Comparison
Here is a comparison of the key financial scores for Coca-Cola Europacific Partners PLC and Coca-Cola Consolidated, Inc.:
CCEP Scores
- Altman Z-Score of 3.17 indicating a safe financial zone
- Piotroski Score of 5, reflecting average financial strength
COKE Scores
- Altman Z-Score of 4.33 indicating a safe financial zone
- Piotroski Score of 7, reflecting strong financial strength
Which company has the best scores?
Based on the provided data, COKE demonstrates stronger financial health with a higher Altman Z-Score and a better Piotroski Score compared to CCEP, indicating a safer financial position and stronger overall financial strength.
Grades Comparison
The following tables present the recent grades assigned to Coca-Cola Europacific Partners PLC and Coca-Cola Consolidated, Inc. by recognized grading firms:
Coca-Cola Europacific Partners PLC Grades
This table summarizes recent grades from established financial institutions for CCEP.
| Grading Company | Action | New Grade | Date |
|---|---|---|---|
| UBS | Maintain | Buy | 2026-01-08 |
| Barclays | Maintain | Overweight | 2025-08-08 |
| Barclays | Maintain | Overweight | 2025-07-15 |
| UBS | Maintain | Buy | 2025-07-02 |
| Barclays | Maintain | Overweight | 2025-05-01 |
| UBS | Maintain | Buy | 2025-04-30 |
| Barclays | Maintain | Overweight | 2025-04-11 |
| Barclays | Maintain | Overweight | 2025-03-27 |
| Barclays | Maintain | Overweight | 2025-03-06 |
| Evercore ISI Group | Maintain | Outperform | 2025-02-18 |
Overall, CCEP’s grades consistently reflect positive sentiment with multiple Buy and Overweight ratings, indicating general confidence from analysts.
Coca-Cola Consolidated, Inc. Grades
This table shows past grades for COKE from a reputable grading firm, though data is dated.
| Grading Company | Action | New Grade | Date |
|---|---|---|---|
| Citigroup | Maintain | Neutral | 2016-05-20 |
| Citigroup | Maintain | Neutral | 2016-05-19 |
| Citigroup | Maintain | Neutral | 2015-07-27 |
| Citigroup | Maintain | Neutral | 2015-07-26 |
| Citigroup | Maintain | Neutral | 2015-05-07 |
| Citigroup | Maintain | Neutral | 2015-05-06 |
| Citigroup | Maintain | Neutral | 2015-03-06 |
| Citigroup | Maintain | Neutral | 2015-03-05 |
| Citigroup | Maintain | Neutral | 2014-11-13 |
| Citigroup | Maintain | Neutral | 2014-11-12 |
Grades for COKE have remained consistently Neutral but are outdated, indicating a lack of recent analyst updates.
Which company has the best grades?
Coca-Cola Europacific Partners PLC has received more favorable and recent grades, predominantly Buy and Overweight ratings, compared to Coca-Cola Consolidated, Inc.’s older Neutral ratings. This difference may affect investor perception of each stock’s growth potential and risk profile.
Strengths and Weaknesses
Below is a comparison table highlighting the key strengths and weaknesses of Coca-Cola Europacific Partners PLC (CCEP) and Coca-Cola Consolidated, Inc. (COKE) based on recent financial and operational data.
| Criterion | Coca-Cola Europacific Partners PLC (CCEP) | Coca-Cola Consolidated, Inc. (COKE) |
|---|---|---|
| Diversification | Moderate; primarily beverage-focused | Moderate; strong in nonalcoholic beverages with some other segments |
| Profitability | Neutral net margin (6.94%), favorable ROE (16.7%) but slightly unfavorable liquidity ratios | Higher net margin (9.18%), very favorable ROE (44.66%) and strong liquidity |
| Innovation | Slightly favorable moat with growing ROIC but no clear durable competitive advantage yet | Very favorable moat with growing ROIC, demonstrating durable competitive advantage |
| Global presence | Strong presence in Europe and Asia-Pacific | Primarily focused on the U.S. market |
| Market Share | Large market share in Europe and Asia-Pacific markets | Strong market share in U.S. nonalcoholic beverages |
Key takeaways: COKE demonstrates stronger profitability, liquidity, and a very favorable competitive moat, indicating a durable advantage and efficient capital use. CCEP shows improving profitability and a growing economic moat but faces some challenges with liquidity and value creation. Investors should weigh global exposure against financial robustness.
Risk Analysis
Below is a comparative table highlighting key risks for Coca-Cola Europacific Partners PLC (CCEP) and Coca-Cola Consolidated, Inc. (COKE) based on the most recent data in 2024.
| Metric | Coca-Cola Europacific Partners PLC (CCEP) | Coca-Cola Consolidated, Inc. (COKE) |
|---|---|---|
| Market Risk | Low beta (0.36) suggests lower volatility but exposed to consumer demand shifts globally. | Moderate beta (0.64), more sensitive to US market fluctuations. |
| Debt level | Debt-to-equity ratio elevated at 1.33, indicating higher leverage and financial risk. | Similar debt-to-equity at 1.35, also a concern for financial stability. |
| Regulatory Risk | Faces EU and UK regulations; potential for stricter environmental and packaging laws. | US regulatory environment, including FDA and state-level regulations, can impact operations. |
| Operational Risk | Large workforce (41K) and complex supply chains across multiple regions increase operational complexity. | Smaller workforce (15K) with a focus on US distribution, operational risks more localized. |
| Environmental Risk | Moderate risk due to global footprint; sustainability initiatives ongoing but packaging waste remains a challenge. | Focused on US markets; increasing pressure on water usage and waste management. |
| Geopolitical Risk | Exposure to currency fluctuations and trade tensions in Asia-Pacific and Europe. | Primarily US-focused, lower geopolitical exposure but sensitive to domestic policy changes. |
In summary, both companies carry moderate debt levels that could affect financial flexibility. CCEP’s global exposure introduces higher geopolitical and environmental risks, while COKE faces concentrated market and regulatory risks in the US. Operational and regulatory risks are the most impactful to monitor given their potential to affect supply chains and compliance costs.
Which Stock to Choose?
Coca-Cola Europacific Partners PLC (CCEP) shows favorable income growth over the 2020-2024 period, with improving profitability and a slightly favorable financial ratios profile. However, it carries unfavorable liquidity and leverage ratios, and its rating is very favorable with some moderate scores.
Coca-Cola Consolidated, Inc. (COKE) presents favorable income growth and profitability, supported by a favorable financial ratios profile with strong liquidity and efficient asset use. It holds a very favorable rating and demonstrates a strong financial health profile with a very favorable moat.
For investors prioritizing durable competitive advantage and strong financial health, COKE may appear more favorable due to its very favorable moat and higher return metrics. Conversely, CCEP might appeal to those accepting moderate financial risks while valuing steady income growth and improving profitability.
Disclaimer: Investment carries a risk of loss of initial capital. The past performance is not a reliable indicator of future results. Be sure to understand risks before making an investment decision.
Go Further
I encourage you to read the complete analyses of Coca-Cola Europacific Partners PLC and Coca-Cola Consolidated, Inc. to enhance your investment decisions: