Home > Comparison > Consumer Defensive > PEP vs CCEP
The strategic rivalry between PepsiCo, Inc. and Coca-Cola Europacific Partners PLC defines the current trajectory of the global non-alcoholic beverages sector. PepsiCo operates as a diversified consumer defensive giant with extensive food and beverage segments, while Coca-Cola Europacific Partners focuses on bottling and beverage distribution within the same industry. This analysis examines which model offers superior risk-adjusted returns amid evolving consumer trends and competitive pressures.
Table of contents
Companies Overview
PepsiCo, Inc. and Coca-Cola Europacific Partners PLC dominate the global non-alcoholic beverages market with distinct scale and strategies.
PepsiCo, Inc.: Diversified Food and Beverage Powerhouse
PepsiCo excels as a global consumer defensive leader in beverages and convenient foods. It generates revenue across seven segments, from snacks to beverages, leveraging a vast distribution network. In 2026, its strategic focus centers on expanding e-commerce and enhancing product innovation to sustain growth across diverse regions.
Coca-Cola Europacific Partners PLC: Premier Beverage Bottler and Distributor
Coca-Cola Europacific Partners operates as a major bottler and distributor of non-alcoholic beverages under iconic brands like Coca-Cola and Monster Energy. It drives revenue through manufacturing and direct distribution to roughly 600M consumers. Its 2026 strategy emphasizes strengthening brand portfolios and optimizing bottling operations across Europe and the Pacific.
Strategic Collision: Similarities & Divergences
Both companies emphasize beverage leadership but differ markedly; PepsiCo pursues a diversified food-beverage model, while Coca-Cola Europacific focuses on bottling excellence. They compete primarily in beverage market share through innovation and distribution reach. Their investment profiles diverge by scale and product breadth, reflecting distinct risk and growth dynamics.
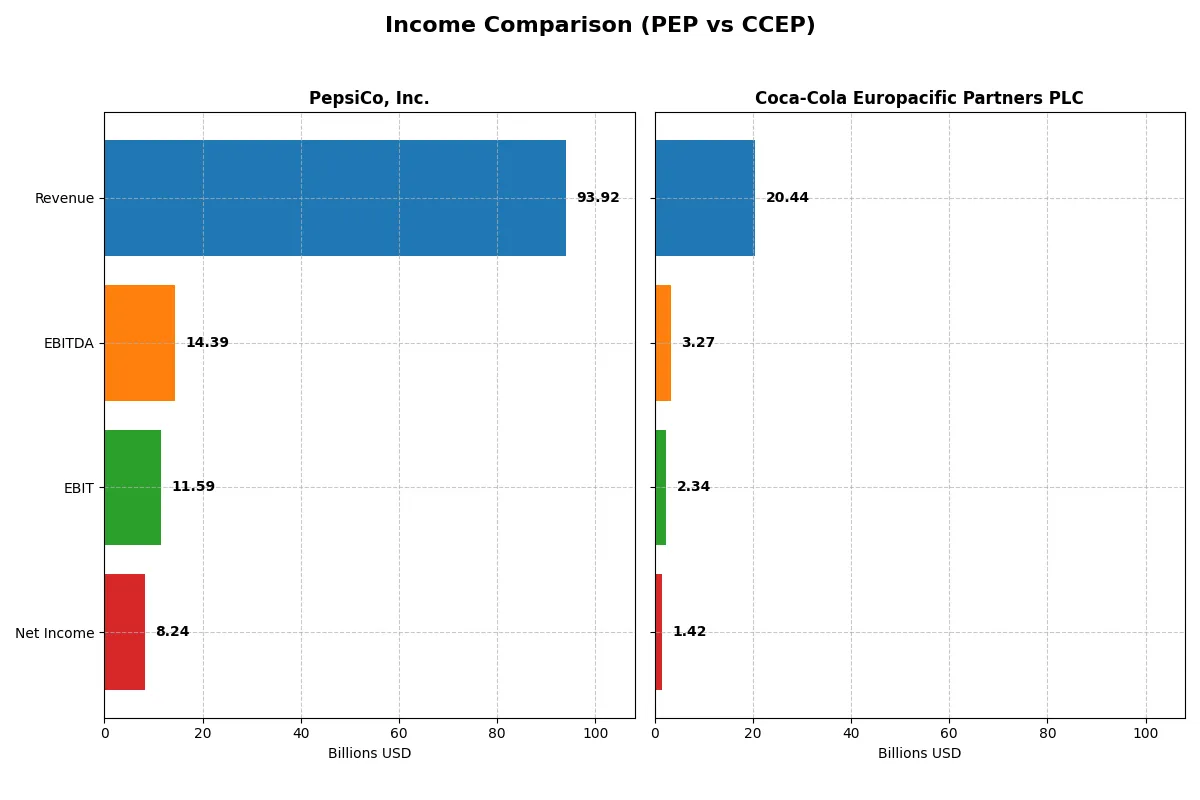
Income Statement Comparison
This data dissects the core profitability and scalability of both corporate engines to reveal who dominates the bottom line:
| Metric | PepsiCo, Inc. (PEP) | Coca-Cola Europacific Partners PLC (CCEP) |
|---|---|---|
| Revenue | 93.9B | 20.4B |
| Cost of Revenue | 43.1B | 13.2B |
| Operating Expenses | 39.4B | 5.2B |
| Gross Profit | 50.9B | 7.3B |
| EBITDA | 14.4B | 3.3B |
| EBIT | 11.6B | 2.3B |
| Interest Expense | 1.1B | 242M |
| Net Income | 8.2B | 1.4B |
| EPS | 6.01 | 3.08 |
| Fiscal Year | 2025 | 2024 |
Income Statement Analysis: The Bottom-Line Duel
This income statement comparison reveals how efficiently each company converts sales into profits, exposing their true operational strength.
PepsiCo, Inc. Analysis
PepsiCo’s revenue grew steadily to $93.9B in 2025, while net income slipped to $8.24B, reflecting margin pressure. Its gross margin remains robust at 54.15%, but net margin fell to 8.77%. Recent declines in EBIT and EPS highlight challenges in sustaining momentum despite strong scale.
Coca-Cola Europacific Partners PLC Analysis
CCEP posted a strong 11.7% revenue gain to €20.4B in 2024, with net income at €1.42B. Gross margin is lower at 35.63%, but it maintains solid EBIT (11.44%) and net margins (6.94%). The company shows impressive long-term growth, though recent net margin contraction signals some operational strain.
Margin Resilience vs. Growth Trajectory
PepsiCo leads in margin quality and scale, delivering stable profits but facing recent margin erosion. CCEP excels in revenue and net income growth, with strong margin improvement overall despite short-term dips. Investors seeking established margin power may prefer PepsiCo, while those favoring dynamic growth could lean toward CCEP’s profile.
Financial Ratios Comparison
These vital ratios act as a diagnostic tool to expose the underlying fiscal health, valuation premiums, and capital efficiency of the companies compared below:
| Ratios | PepsiCo, Inc. (PEP) | Coca-Cola Europacific Partners PLC (CCEP) |
|---|---|---|
| ROE | 40.4% | 16.7% |
| ROIC | 11.3% | 6.5% |
| P/E | 23.9 | 24.1 |
| P/B | 9.66 | 4.02 |
| Current Ratio | 0.85 | 0.81 |
| Quick Ratio | 0.67 | 0.62 |
| D/E (Debt-to-Equity) | 2.45 | 1.33 |
| Debt-to-Assets | 46.5% | 36.4% |
| Interest Coverage | 10.3 | 8.8 |
| Asset Turnover | 0.87 | 0.66 |
| Fixed Asset Turnover | 2.79 | 3.18 |
| Payout Ratio | 92.7% | 64.2% |
| Dividend Yield | 3.87% | 2.66% |
| Fiscal Year | 2025 | 2024 |
Efficiency & Valuation Duel: The Vital Signs
Financial ratios act as a company’s DNA, unveiling hidden risks and operational strengths critical to informed investment decisions.
PepsiCo, Inc.
PepsiCo exhibits strong profitability with a 40.38% ROE and an 8.77% net margin, signaling efficient capital use. Its P/E ratio at 23.92 suggests a fairly valued stock. The company supports shareholders with a solid 3.87% dividend yield, reflecting steady returns rather than aggressive buybacks or growth reinvestment.
Coca-Cola Europacific Partners PLC
Coca-Cola Europacific Partners shows moderate profitability, with a 16.7% ROE and a 6.94% net margin, indicating decent efficiency. Its P/E ratio stands at 24.08, indicating a valuation on par with PepsiCo. The firm offers a 2.66% dividend yield, balancing shareholder returns with careful capital management amid neutral to slightly favorable operational metrics.
Balanced Profitability Meets Cautious Valuation
PepsiCo delivers higher returns on equity and capital, supporting a stronger dividend yield, while Coca-Cola Europacific Partners maintains a comparable valuation with moderate efficiency. Investors prioritizing robust profitability and income may favor PepsiCo, whereas those seeking moderate risk and steady dividends might lean toward Coca-Cola Europacific Partners.
Which one offers the Superior Shareholder Reward?
PepsiCo and Coca-Cola Europacific Partners both reward shareholders through dividends and buybacks but follow distinct approaches. PepsiCo yields around 3.87% with a high payout ratio near 93%, indicating aggressive cash return. Its free cash flow comfortably covers dividends and capex, supporting sustainability. Buybacks complement returns but are less intense than dividends. Coca-Cola Europacific Partners yields about 2.66%, with a lower payout ratio near 64%, preserving more cash for reinvestment. Its free cash flow coverage exceeds 1.7x, allowing robust dividend sustainability and more balanced capital allocation. Buybacks appear moderate but significant. I see PepsiCo’s model as more rewarding for immediate income, yet Coca-Cola Europacific Partners offers a more sustainable total return by balancing dividends and growth capital. For 2026, I favor PepsiCo for superior shareholder yield and total return potential, tempered by slightly higher leverage risk.
Comparative Score Analysis: The Strategic Profile
The radar chart reveals the fundamental DNA and trade-offs of PepsiCo and Coca-Cola Europacific Partners, highlighting their financial strengths and weaknesses:
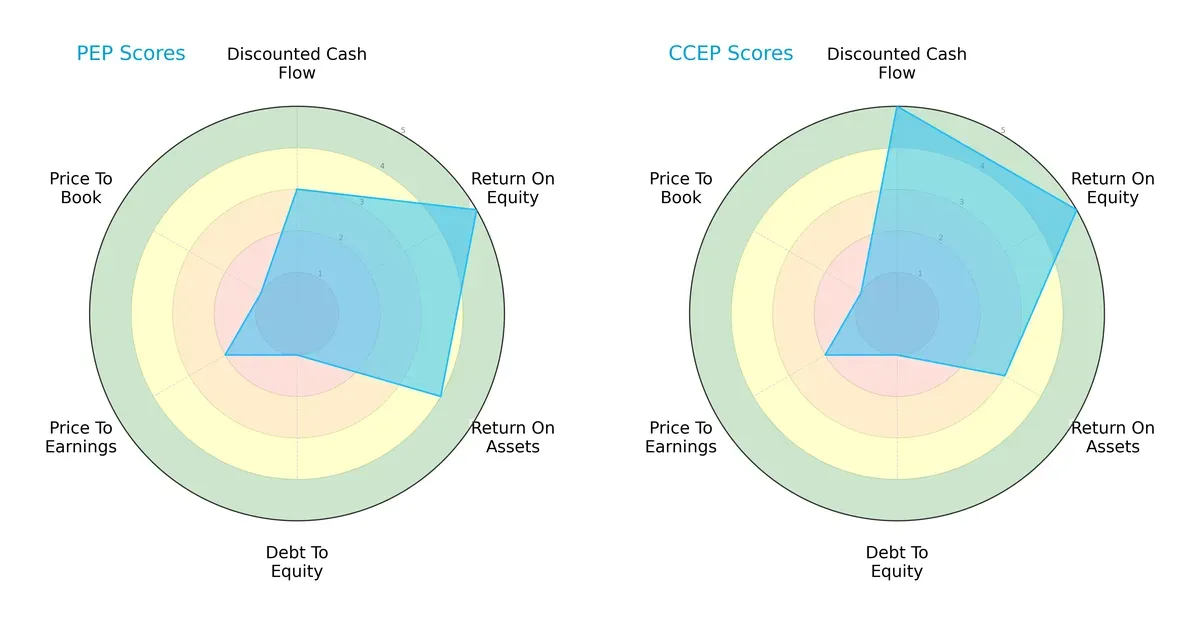
PepsiCo shows a more balanced operational efficiency with strong ROE (5) and ROA (4) scores but suffers from weak valuation and leverage metrics (P/E 2, P/B 1, Debt/Equity 1). Coca-Cola Europacific Partners excels in discounted cash flow (5) and matches PepsiCo’s ROE (5) but lags slightly in asset utilization (ROA 3). Both firms share high financial risk due to poor debt management, yet Coca-Cola relies more on cash flow strength, while PepsiCo’s edge lies in profitability ratios.
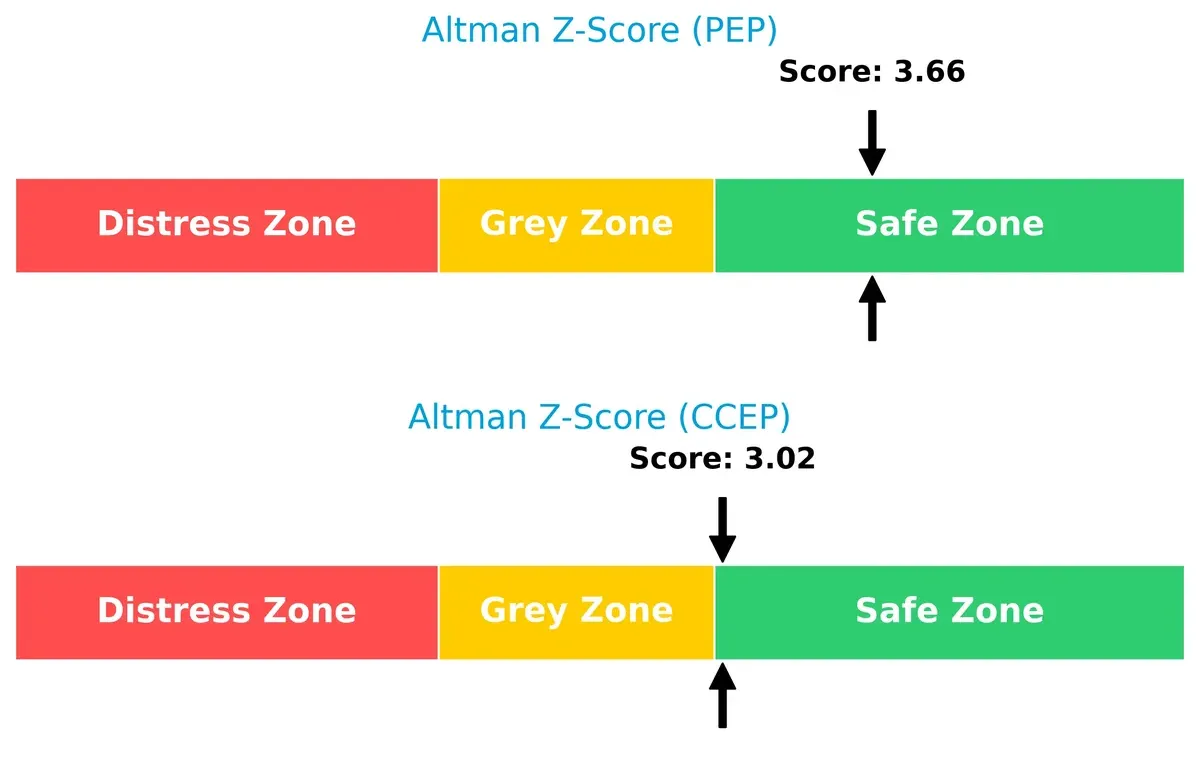
Bankruptcy Risk: Solvency Showdown
PepsiCo’s Altman Z-Score of 3.66 versus Coca-Cola Europacific Partners’ 3.02 places both comfortably in the safe zone, suggesting robust long-term survival prospects amid current market volatility:
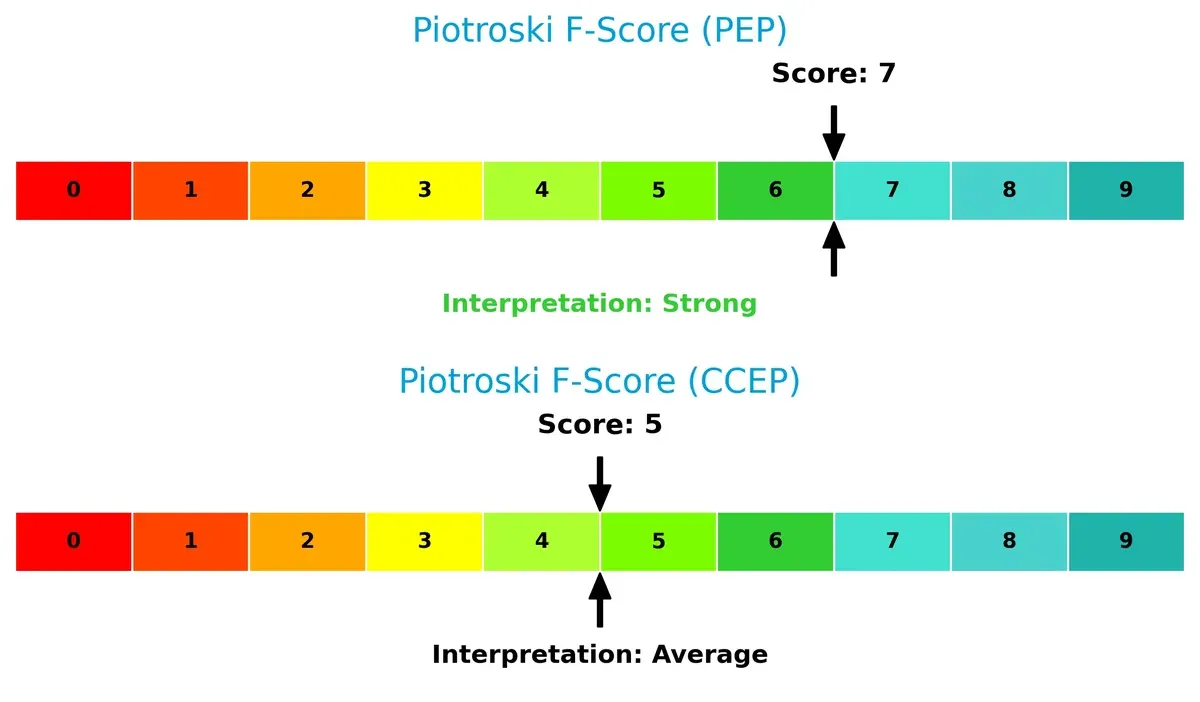
Financial Health: Quality of Operations
PepsiCo’s stronger Piotroski F-Score of 7 versus Coca-Cola Europacific Partners’ 5 signals superior internal financial health and operational quality. PepsiCo displays fewer red flags, indicating a more resilient balance sheet and profitability profile:
How are the two companies positioned?
This section dissects the operational DNA of PepsiCo and CCEP by comparing their revenue distribution by segment and internal dynamics. The goal is to confront their economic moats and identify which business model offers the most resilient, sustainable competitive advantage today.
Strengths and Weaknesses Comparison
This table compares the strengths and weaknesses of PepsiCo and Coca-Cola Europacific Partners:
PepsiCo Strengths
- Strong profitability with ROE at 40.38% and ROIC at 11.3%
- Favorable interest coverage of 10.34
- Diversified global presence including US, Mexico, China, Russia
- Slightly favorable overall financial ratios
- Solid dividend yield at 3.87%
Coca-Cola Europacific Partners Strengths
- Favorable ROE at 16.7% and WACC at 4.72%
- Strong fixed asset turnover at 3.18
- Favorable interest coverage at 9.67
- Diversified European and Asia Pacific presence
- Slightly favorable overall financial ratios
- Dividend yield at 2.66%
PepsiCo Weaknesses
- Unfavorable liquidity ratios with current ratio 0.85 and quick ratio 0.67
- High debt-to-equity at 2.45
- Unfavorable price-to-book at 9.66
- Neutral net margin at 8.77%
- Neutral asset turnover at 0.87
Coca-Cola Europacific Partners Weaknesses
- Unfavorable liquidity ratios with current ratio 0.81 and quick ratio 0.62
- Elevated debt-to-equity at 1.33
- Unfavorable price-to-book at 4.02
- Neutral net margin at 6.94%
- Lower asset turnover at 0.66
PepsiCo exhibits superior profitability metrics and a broader global footprint, but faces liquidity and leverage challenges. Coca-Cola Europacific Partners maintains solid asset efficiency and geographic focus but also struggles with liquidity and leverage. Both companies show slightly favorable overall financial health, underscoring strategic priorities around balance sheet optimization.
The Moat Duel: Analyzing Competitive Defensibility
A structural moat is the only true shield protecting long-term profits from relentless competitive erosion. Let’s dissect the moats of two beverage giants:
PepsiCo, Inc.: Diversified Brand & Scale Moat
PepsiCo leverages its vast product portfolio and global distribution, generating stable gross margins above 54%. Its slightly declining ROIC warns of margin pressure, but new market expansions could reinforce its wide moat in 2026.
Coca-Cola Europacific Partners PLC: Regional Bottling & Growth Moat
Coca-Cola Europacific Partners relies on strong regional bottling networks and rising operational efficiency. Its ROIC, though below WACC, is growing sharply, signaling a building moat with significant revenue growth potential across Europe and Asia-Pacific.
Scale & Diversification vs. Regional Expansion: The Moat Face-off
PepsiCo boasts a wider moat with steady value creation from diversified brands and scale economies. Coca-Cola Europacific’s moat is narrower but deepening rapidly through operational improvements. PepsiCo remains better equipped to defend market share amid intensifying competition.
Which stock offers better returns?
The past year shows contrasting price dynamics between PepsiCo and Coca-Cola Europacific Partners, with both stocks exhibiting bullish trends but differing in acceleration and recent momentum.
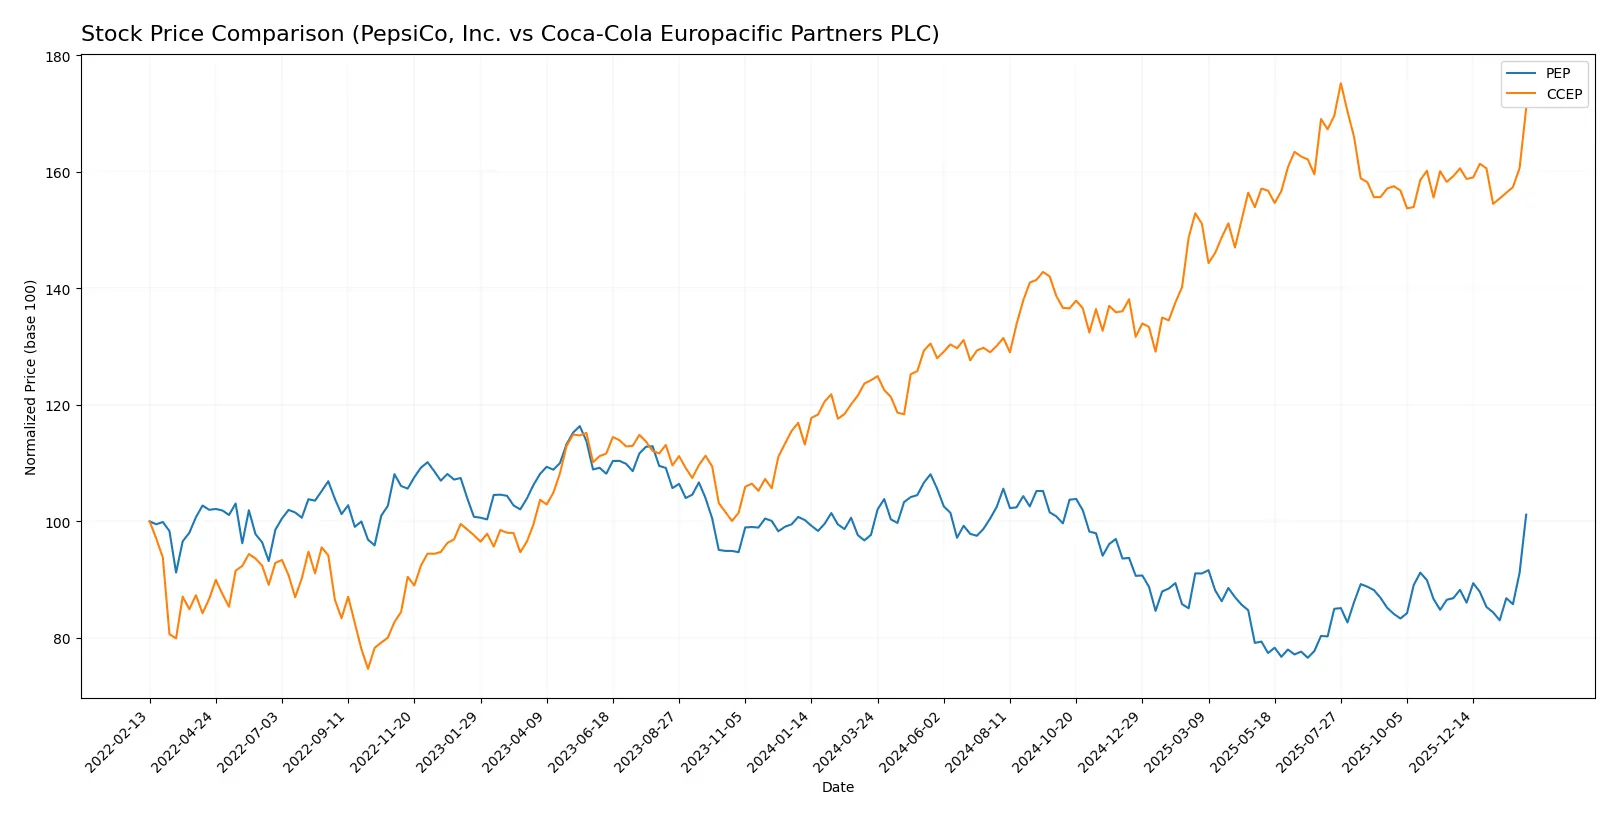
Trend Comparison
PepsiCo’s stock rose 3.54% over the past 12 months, indicating a bullish trend with accelerating momentum and a high volatility level (14.65% std deviation).
Coca-Cola Europacific Partners gained 37.56% over the same period, also bullish but with decelerating momentum and lower volatility (8.15% std deviation).
Coca-Cola Europacific Partners delivered a significantly higher market performance than PepsiCo, despite slower recent trend acceleration.
Target Prices
Analysts project moderate upside for both PepsiCo and Coca-Cola Europacific Partners based on current consensus targets.
| Company | Target Low | Target High | Consensus |
|---|---|---|---|
| PepsiCo, Inc. | 144 | 191 | 167.75 |
| Coca-Cola Europacific Partners PLC | 101 | 114 | 107.5 |
PepsiCo’s target consensus suggests a slight premium to its current price of 170.49 USD, indicating moderate growth expectations. Coca-Cola Europacific Partners trades below its 107.5 USD consensus, signaling potential upside.
How do institutions grade them?
PepsiCo, Inc. Grades
The latest institutional grades for PepsiCo reflect consistent buy and overweight ratings:
| Grading Company | Action | New Grade | Date |
|---|---|---|---|
| Citigroup | Maintain | Buy | 2026-02-04 |
| JP Morgan | Maintain | Overweight | 2026-02-04 |
| Wells Fargo | Maintain | Equal Weight | 2026-02-04 |
| UBS | Maintain | Buy | 2026-01-14 |
| Barclays | Maintain | Equal Weight | 2025-12-11 |
Coca-Cola Europacific Partners PLC Grades
Institutional grades for Coca-Cola Europacific Partners show mostly overweight and buy ratings, with one recent downgrade:
| Grading Company | Action | New Grade | Date |
|---|---|---|---|
| B of A Securities | Downgrade | Neutral | 2026-01-14 |
| UBS | Maintain | Buy | 2026-01-08 |
| Barclays | Maintain | Overweight | 2025-08-08 |
| UBS | Maintain | Buy | 2025-07-02 |
| Barclays | Maintain | Overweight | 2025-05-01 |
Which company has the best grades?
PepsiCo holds a more stable profile with recent buy and overweight ratings, while Coca-Cola Europacific Partners features some downgrades to neutral. This stability could influence investor confidence and portfolio weighting decisions.

Don’t Let Luck Decide Your Entry Point
Optimize your entry points with our advanced ProRealTime indicators. You’ll get efficient buy signals with precise price targets for maximum performance. Start outperforming now!
Risks specific to each company
The following categories identify the critical pressure points and systemic threats facing both firms in the 2026 market environment:
1. Market & Competition
PepsiCo, Inc.
- Diversified product portfolio supports resilience but faces intense global competition.
Coca-Cola Europacific Partners PLC
- Strong brand presence in Europe and Asia, yet highly dependent on beverage segment competition.
2. Capital Structure & Debt
PepsiCo, Inc.
- High debt-to-equity ratio (2.45) signals elevated financial leverage risk.
Coca-Cola Europacific Partners PLC
- Lower debt-to-equity (1.33) but still unfavorable; leverage remains a concern.
3. Stock Volatility
PepsiCo, Inc.
- Beta of 0.41 indicates lower volatility and defensive stock characteristics.
Coca-Cola Europacific Partners PLC
- Even lower beta at 0.33, reflecting slightly less market sensitivity.
4. Regulatory & Legal
PepsiCo, Inc.
- Subject to US food and beverage regulations with potential for litigation and compliance costs.
Coca-Cola Europacific Partners PLC
- Exposed to EU regulatory frameworks and Brexit-related legal complexities.
5. Supply Chain & Operations
PepsiCo, Inc.
- Complex global supply chain with risks from raw material price fluctuations and logistics.
Coca-Cola Europacific Partners PLC
- Regional operations may face disruption from European supply chain challenges.
6. ESG & Climate Transition
PepsiCo, Inc.
- Increasing pressure to improve sustainability practices amid rising consumer ESG awareness.
Coca-Cola Europacific Partners PLC
- Faces similar ESG challenges, especially regarding packaging waste and carbon footprint.
7. Geopolitical Exposure
PepsiCo, Inc.
- Broad international exposure includes emerging markets with geopolitical instability risks.
Coca-Cola Europacific Partners PLC
- More concentrated in Europe and Asia-Pacific, subject to regional political tensions.
Which company shows a better risk-adjusted profile?
PepsiCo’s most impactful risk is its elevated financial leverage that strains liquidity, flagged by low current and quick ratios. Coca-Cola Europacific’s greatest risk lies in its concentrated regional exposure and moderate financial health indicated by average Piotroski scores. Both carry debt risks, but PepsiCo’s stronger Altman Z-score and broader diversification improve its risk-adjusted profile. Notably, PepsiCo’s safer zone Altman Z-score (3.66) versus Coca-Cola Europacific’s near-threshold 3.02 reflects greater bankruptcy resilience in today’s volatile market.
Final Verdict: Which stock to choose?
PepsiCo, Inc. impresses with its superpower in delivering robust returns on equity and capital, showcasing a proven ability to create shareholder value. However, its elevated leverage and liquidity ratios are points of vigilance that could amplify risks during economic downturns. This stock suits investors with an appetite for aggressive growth balanced by strong operational efficiency.
Coca-Cola Europacific Partners PLC leverages a strategic moat in its expanding European market presence and improving profitability trajectory. Its free cash flow yield stands out, offering a safer profile relative to PepsiCo’s higher leverage. This makes it more appealing for investors seeking growth at a reasonable price with moderate risk exposure.
If you prioritize aggressive capital efficiency and established market leadership, PepsiCo is the compelling choice due to its superior returns and cash generation. However, if you seek steady growth with better stability and improving profitability, Coca-Cola Europacific Partners offers a more balanced risk-reward profile. Both companies present slightly favorable financial health but cater to distinct investor strategies.
Disclaimer: Investment carries a risk of loss of initial capital. The past performance is not a reliable indicator of future results. Be sure to understand risks before making an investment decision.
Go Further
I encourage you to read the complete analyses of PepsiCo, Inc. and Coca-Cola Europacific Partners PLC to enhance your investment decisions: