Home > Comparison > Utilities > XEL vs CMS
The strategic rivalry between Xcel Energy Inc. and CMS Energy Corporation shapes the Utilities sector’s future. Xcel Energy operates as a diversified, multi-state regulated electric and gas utility with a broad renewable footprint. CMS Energy focuses on Michigan-centric electric and gas utilities with extensive transmission infrastructure. This analysis contrasts their operational models and investment appeal, aiming to identify which trajectory offers superior risk-adjusted returns for a diversified portfolio in a sector defined by stability and transition.
Table of contents
Companies Overview
Xcel Energy and CMS Energy both stand as key players in the regulated electric market, commanding significant regional influence.
Xcel Energy Inc.: Diverse Energy Powerhouse
Xcel Energy Inc. dominates as a regulated electric utility across eight states, generating revenue by producing and selling electricity and natural gas. Its diversified energy mix includes coal, nuclear, natural gas, hydroelectric, solar, wind, and biomass. In 2026, the company strategically emphasizes expanding renewable generation and infrastructure to meet evolving energy demands and regulatory requirements.
CMS Energy Corporation: Michigan’s Energy Custodian
CMS Energy Corporation operates primarily in Michigan as a regulated electric and gas utility, generating revenue through electricity and natural gas sales. It maintains an extensive electric and gas distribution network and invests in renewable power production. Its 2026 strategy focuses on upgrading infrastructure and enhancing renewable energy capacity to serve 3.7 million combined customers efficiently.
Strategic Collision: Similarities & Divergences
Both companies embrace regulated utility models emphasizing renewable transitions but differ in geographic reach and scale. Xcel Energy balances a broader multi-state footprint with diverse energy sources, while CMS Energy concentrates on Michigan’s market with extensive infrastructure control. Their competition centers on regulatory adaptation and clean energy leadership, offering distinct investment profiles—Xcel’s scale contrasts with CMS’s focused regional dominance.
Income Statement Comparison
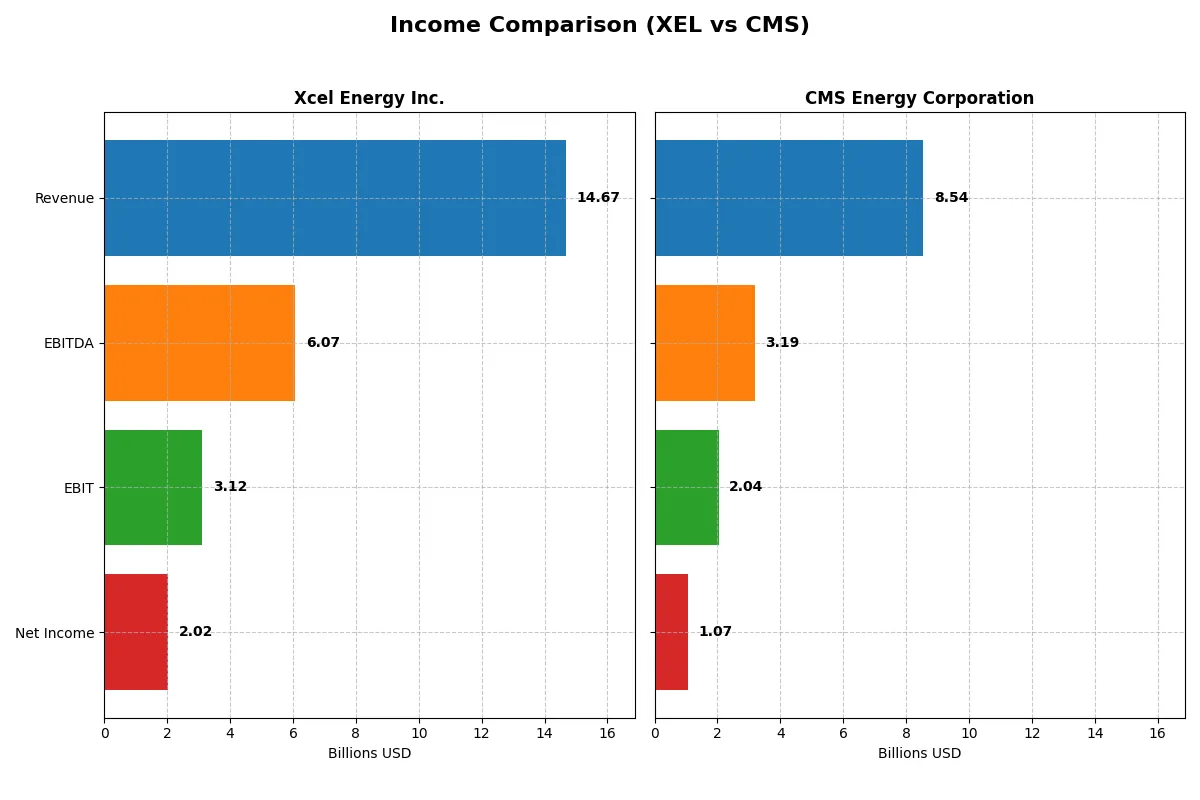
This data dissects the core profitability and scalability of both corporate engines to reveal who dominates the bottom line:
| Metric | Xcel Energy Inc. (XEL) | CMS Energy Corporation (CMS) |
|---|---|---|
| Revenue | 14.67B | 8.54B |
| Cost of Revenue | 11.10B | 3.34B |
| Operating Expenses | 686M | 3.47B |
| Gross Profit | 3.57B | 5.20B |
| EBITDA | 6.07B | 3.19B |
| EBIT | 3.12B | 2.04B |
| Interest Expense | 1.34B | 789M |
| Net Income | 2.02B | 1.07B |
| EPS | 3.44 | 3.53 |
| Fiscal Year | 2025 | 2025 |
Income Statement Analysis: The Bottom-Line Duel
This income statement comparison reveals which company operates with superior efficiency and profitability under current market conditions.
Xcel Energy Inc. Analysis
Xcel Energy’s revenue rose steadily from 13.4B in 2021 to 14.7B in 2025, with net income climbing from 1.6B to 2.0B. The company maintains a robust gross margin of 24.3%, and a healthy net margin near 13.8%, signaling solid cost control. Efficiency improved in 2025, as EBIT grew 14.7%, reflecting strong operating momentum.
CMS Energy Corporation Analysis
CMS Energy’s revenue grew from 7.3B in 2021 to 8.5B in 2025, with net income fluctuating and ending at about 1.1B, down from a peak in 2021. Its gross margin stands high at 60.9%, with EBIT margin at 23.9%, demonstrating operational leverage. However, net margin slightly declined to 12.5%, indicating margin pressure despite revenue growth.
Margin Strength vs. Earnings Consistency
Xcel Energy delivers steady net income growth and improving margins, underscoring consistent operational efficiency. CMS Energy boasts stronger gross and EBIT margins but struggles with net income volatility and margin erosion. For investors seeking reliable earnings expansion, Xcel’s profile appears more attractive, while CMS offers higher margin potential but increased risk.
Financial Ratios Comparison
These vital ratios act as a diagnostic tool to expose the underlying fiscal health, valuation premiums, and capital efficiency of the companies compared below:
| Ratios | Xcel Energy Inc. (XEL) | CMS Energy Corporation (CMS) |
|---|---|---|
| ROE | 9.9% | 12.0% |
| ROIC | 3.6% | 3.7% |
| P/E | 21.5 | 19.5 |
| P/B | 1.95 | 2.34 |
| Current Ratio | 0.67 | 1.34 |
| Quick Ratio | 0.57 | 1.34 |
| D/E (Debt-to-Equity) | 1.55 | 2.12 |
| Debt-to-Assets | 43.1% | 47.3% |
| Interest Coverage | 2.14 | 2.19 |
| Asset Turnover | 0.19 | 0.21 |
| Fixed Asset Turnover | 0.23 | 0.28 |
| Payout ratio | 82.2% | 60.5% |
| Dividend yield | 3.83% | 3.10% |
| Fiscal Year | 2025 | 2025 |
Efficiency & Valuation Duel: The Vital Signs
Financial ratios act as the company’s DNA, uncovering hidden risks and operational strengths critical for investment decisions.
Xcel Energy Inc.
Xcel Energy posts a favorable net margin of 13.76%, signaling decent profitability. However, its ROE and ROIC show zero returns, indicating inefficiencies in capital use. The P/E ratio at 21.48 suggests a fairly priced stock. A 3.83% dividend yield reflects a shareholder-friendly return, balancing reinvestment with income.
CMS Energy Corporation
CMS shows solid profitability with a 12.54% net margin and a neutral 12.01% ROE, hinting at steady equity returns. Its P/E ratio of 19.49 also points to a fair valuation. CMS offers a 3.1% dividend yield and maintains a neutral stance on debt, blending income distribution with manageable leverage.
Balanced Profitability vs. Valuation Stability
CMS balances profitability and valuation slightly better with a neutral overall ratio profile, while Xcel Energy’s mix signals slight weaknesses despite strong dividends. Investors seeking consistent returns and moderate risk may find CMS’s profile more aligned with their goals.
Which one offers the Superior Shareholder Reward?
I compare Xcel Energy Inc. (XEL) and CMS Energy Corporation (CMS) by their dividend yields, payout ratios, and buyback intensity. XEL yields 3.8% with a high 82% payout ratio, limiting buybacks due to heavy capex and negative free cash flow. CMS yields 3.1%, pays out 60%, but supports robust buybacks funded by positive free cash flow of 7.5B. Historically, CMS’s balanced distribution through dividends and buybacks sustains shareholder value better. I favor CMS for superior total return potential in 2026, given its cash flow strength and prudent capital allocation.
Comparative Score Analysis: The Strategic Profile
The radar chart reveals the fundamental DNA and trade-offs of Xcel Energy Inc. and CMS Energy Corporation, highlighting their financial strengths and weaknesses:
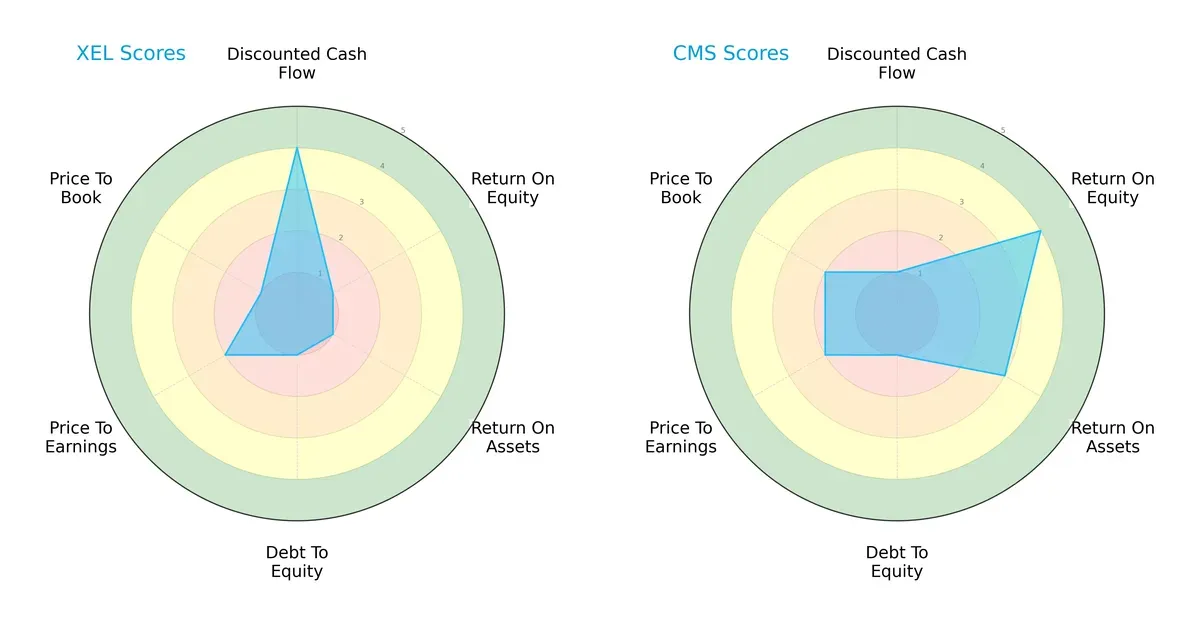
Xcel Energy leans heavily on a favorable discounted cash flow score (4) but struggles with very unfavorable returns on equity (1) and assets (1), plus weak debt management. CMS shows strength in profitability metrics (ROE 4, ROA 3) but suffers from poor debt-to-equity scores like Xcel. CMS’s balanced profitability contrasts with Xcel’s reliance on cash flow valuation, marking CMS as the more well-rounded operator.
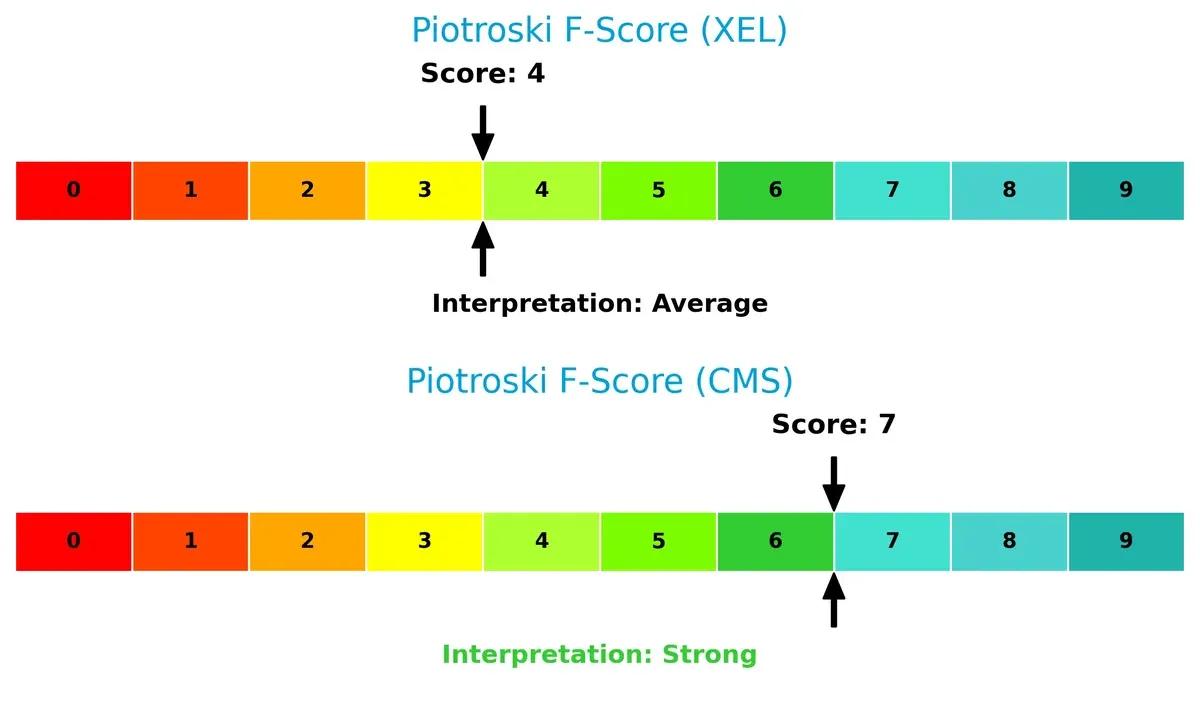
Financial Health: Quality of Operations
CMS outperforms Xcel Energy in operational quality, with a Piotroski F-Score of 7 versus 4. This suggests CMS maintains stronger profitability, leverage, and liquidity metrics. Xcel’s average score raises red flags about internal financial health compared to CMS’s robust profile:
How are the two companies positioned?
This section dissects XEL and CMS’s operational DNA by comparing their revenue streams and internal strengths and weaknesses. The goal is to confront their economic moats to reveal which model delivers the most resilient competitive advantage today.
Revenue Segmentation: The Strategic Mix
This visual comparison dissects how Xcel Energy Inc. and CMS Energy Corporation diversify their income streams and reveals their primary sector bets:
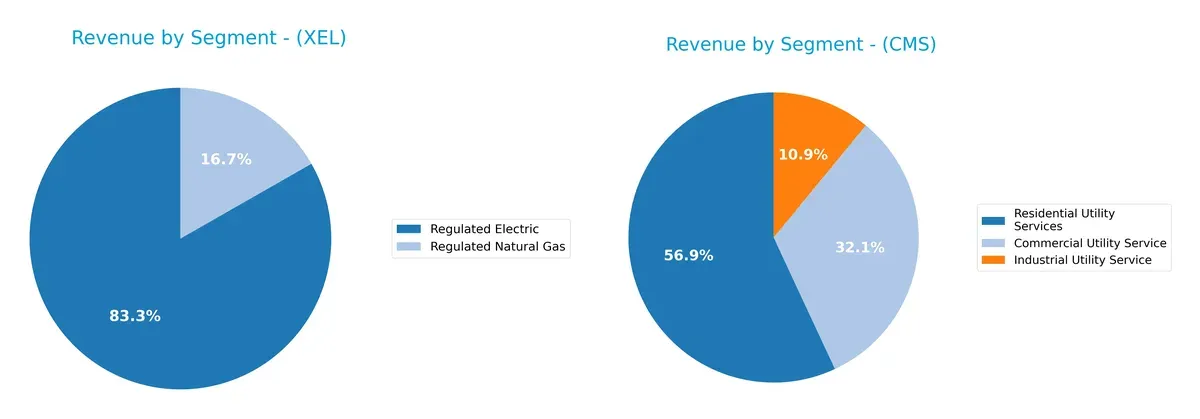
Xcel Energy anchors most revenue in Regulated Electric with $22.3B in 2024, dwarfing its $4.5B Regulated Natural Gas segment. CMS Energy shows a more balanced mix: Residential Utility Services lead with $3.7B, but Commercial and Industrial Utility Services contribute $2.8B combined. Xcel’s concentration signals infrastructure dominance but concentration risk. CMS’s diversified streams suggest resilience and broader market penetration.
Strengths and Weaknesses Comparison
This table compares the strengths and weaknesses of Xcel Energy Inc. and CMS Energy Corporation:
Xcel Energy Inc. Strengths
- Higher net margin at 13.76%
- Favorable dividend yield of 3.83%
- Low debt-to-assets ratio
- Favorable price-to-book ratio
- Strong regulated electric revenue at 22.3B in 2024
CMS Energy Corporation Strengths
- Favorable net margin at 12.54%
- Neutral ROE at 12.01%
- Favorable WACC at 5.02%
- Favorable quick ratio of 1.34
- Diversified utility revenue streams totaling over 6B in 2024
Xcel Energy Inc. Weaknesses
- Zero reported ROE and ROIC flagged as unfavorable
- Unavailable WACC data
- Unfavorable current and quick ratios
- Unfavorable asset and fixed asset turnover
- Slightly unfavorable global ratio opinion
CMS Energy Corporation Weaknesses
- Unfavorable ROIC at 3.71%
- Higher debt-to-equity ratio of 2.12
- Unfavorable asset and fixed asset turnover
- Neutral debt-to-assets ratio at 47.3%
- More neutral overall financial ratios
Xcel Energy shows strengths in profitability and conservative leverage but suffers from weak returns on invested capital and liquidity. CMS Energy balances moderate profitability and cost of capital with higher leverage and weaker asset utilization. These factors highlight differing financial risk profiles and operational efficiencies.
The Moat Duel: Analyzing Competitive Defensibility
A structural moat is the only barrier protecting long-term profits from relentless competition erosion. Let’s dissect the moats of two regulated utilities:
Xcel Energy Inc.: Diverse Fuel Mix & Regulatory Stability
Xcel’s moat stems from regulatory protections and a diversified energy portfolio, reflected in stable margins and consistent revenue growth. However, declining ROIC warns that efficiency gains must accelerate by 2026.
CMS Energy Corporation: Local Monopoly & Infrastructure Scale
CMS benefits from a localized monopoly with extensive infrastructure, delivering high gross margins. Yet, a negative ROIC spread signals value erosion, threatening its moat’s sustainability in a changing regulatory environment.
Infrastructure Depth vs. Regulatory Breadth: Who Holds the Stronger Moat?
Xcel’s broader regulatory footprint and diversified energy sources offer a deeper economic moat despite efficiency headwinds. CMS’s scale advantage is undermined by value destruction, leaving Xcel better positioned to defend market share.
Which stock offers better returns?
Over the past 12 months, Xcel Energy Inc. and CMS Energy Corporation showed strong gains with notable price peaks and shifts in trading dominance.
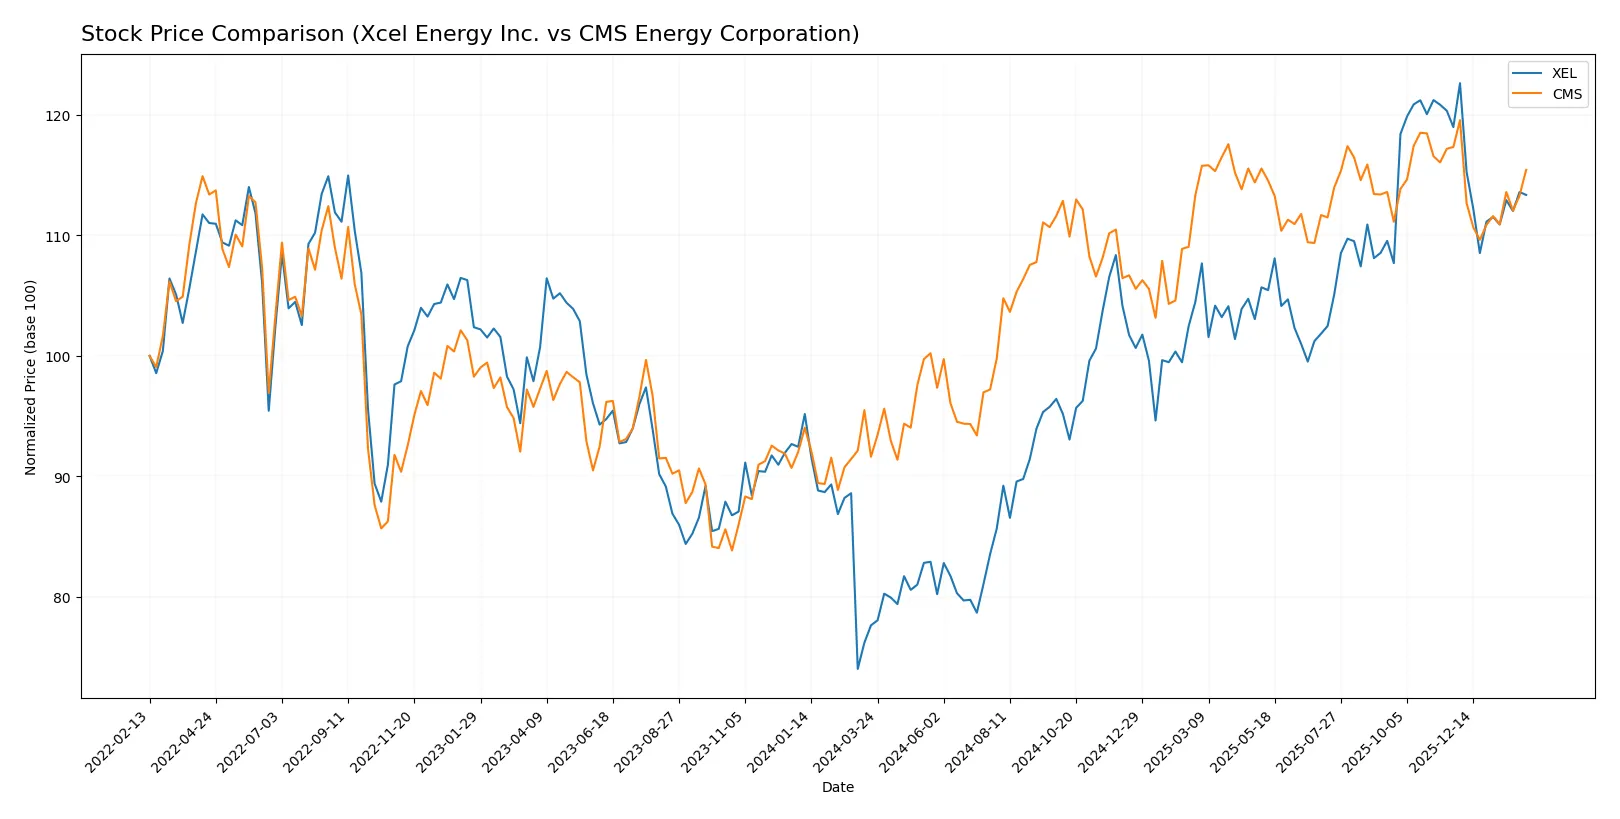
Trend Comparison
Xcel Energy Inc. posted a 46.0% price increase over the year, signaling a bullish trend with decelerating momentum. Its price ranged from 52.0 to 82.1, showing high volatility (8.24 std deviation).
CMS Energy Corporation gained 26.0% over the same period, also bullish but with slowing acceleration. The stock moved between 57.7 and 75.4, with moderate volatility (4.7 std deviation).
Xcel Energy outperformed CMS in market returns. Both stocks decelerated recently, but Xcel’s gains and volatility remain significantly higher.
Target Prices
Analysts present a moderately bullish consensus for both Xcel Energy Inc. and CMS Energy Corporation.
| Company | Target Low | Target High | Consensus |
|---|---|---|---|
| Xcel Energy Inc. | 81 | 95 | 88 |
| CMS Energy Corporation | 74 | 82 | 78.14 |
The consensus target for Xcel Energy at $88 suggests roughly a 16% upside from the current $75.9 price. CMS’s target near $78.14 implies a modest 7% gain from its $72.84 price. Both reflect cautious optimism in the regulated electric sector.

Don’t Let Luck Decide Your Entry Point
Optimize your entry points with our advanced ProRealTime indicators. You’ll get efficient buy signals with precise price targets for maximum performance. Start outperforming now!
How do institutions grade them?
Xcel Energy Inc. Grades
The following table summarizes recent institutional grades for Xcel Energy Inc.:
| Grading Company | Action | New Grade | Date |
|---|---|---|---|
| Barclays | Maintain | Overweight | 2026-01-15 |
| UBS | Maintain | Neutral | 2025-12-17 |
| Keybanc | Maintain | Overweight | 2025-12-12 |
| JP Morgan | Maintain | Overweight | 2025-12-11 |
| Barclays | Maintain | Overweight | 2025-11-05 |
| Citigroup | Maintain | Buy | 2025-11-03 |
| UBS | Maintain | Neutral | 2025-10-31 |
| Mizuho | Maintain | Outperform | 2025-10-27 |
| Jefferies | Maintain | Buy | 2025-10-16 |
| Keybanc | Maintain | Overweight | 2025-10-15 |
CMS Energy Corporation Grades
The following table summarizes recent institutional grades for CMS Energy Corporation:
| Grading Company | Action | New Grade | Date |
|---|---|---|---|
| Mizuho | Maintain | Neutral | 2026-02-06 |
| Morgan Stanley | Maintain | Equal Weight | 2026-02-02 |
| Jefferies | Maintain | Buy | 2026-01-28 |
| Wells Fargo | Maintain | Equal Weight | 2026-01-20 |
| JP Morgan | Maintain | Overweight | 2026-01-15 |
| Jefferies | Maintain | Buy | 2026-01-15 |
| Barclays | Maintain | Overweight | 2026-01-15 |
| UBS | Maintain | Neutral | 2025-12-17 |
| JP Morgan | Maintain | Overweight | 2025-12-11 |
| Morgan Stanley | Maintain | Equal Weight | 2025-10-22 |
Which company has the best grades?
Xcel Energy consistently receives higher grades, including multiple “Overweight” and “Buy” ratings. CMS shows more “Neutral” and “Equal Weight” ratings. Xcel’s stronger grades could signal greater institutional confidence, potentially influencing investor sentiment positively.
Risks specific to each company
The following categories identify the critical pressure points and systemic threats facing both firms in the 2026 market environment:
1. Market & Competition
Xcel Energy Inc.
- Operates across multiple states with a diversified energy mix, facing broad regulated competition pressures.
CMS Energy Corporation
- Primarily Michigan-focused, with a strong local presence but limited geographic diversification.
2. Capital Structure & Debt
Xcel Energy Inc.
- Favorable debt-to-equity metrics but weak interest coverage at 2.32x signals moderate leverage risk.
CMS Energy Corporation
- Higher debt-to-equity (2.12) and neutral debt metrics increase financial risk despite stable interest coverage at 2.58x.
3. Stock Volatility
Xcel Energy Inc.
- Beta of 0.476 suggests low stock volatility, appealing for risk-averse investors.
CMS Energy Corporation
- Beta of 0.481 indicates similarly low volatility, offering comparable market risk stability.
4. Regulatory & Legal
Xcel Energy Inc.
- Multi-state regulation complexity could increase compliance costs and delay investments.
CMS Energy Corporation
- Concentrated regulatory risk in Michigan may pose vulnerability to state-level policy shifts.
5. Supply Chain & Operations
Xcel Energy Inc.
- Complex mix of energy sources including renewables suggests operational complexity and supply chain exposure.
CMS Energy Corporation
- Extensive electric and gas distribution infrastructure creates operational scale but also maintenance risk.
6. ESG & Climate Transition
Xcel Energy Inc.
- Strong investment in renewables aligns with climate transition but requires capital intensity.
CMS Energy Corporation
- Also invests in renewables, though slower transition pace may risk lagging regulatory expectations.
7. Geopolitical Exposure
Xcel Energy Inc.
- Primarily domestic exposure with limited geopolitical risk but sensitive to US energy policies.
CMS Energy Corporation
- Similar domestic focus, with concentrated regional exposure potentially amplifying local policy risks.
Which company shows a better risk-adjusted profile?
Xcel Energy faces a notable challenge in operational complexity and regulatory breadth but maintains more conservative leverage and stronger dividend yield. CMS Energy’s concentrated geographic risk and higher leverage elevate its financial vulnerability despite a stronger Piotroski score. Xcel’s lower beta and better debt metrics provide a more balanced risk-adjusted profile. Recent data show CMS’s Altman Z-Score at 0.85, signaling distress risk, sharply contrasting Xcel’s neutral financial distress status. This disparity justifies caution towards CMS’s financial stability.
Final Verdict: Which stock to choose?
Xcel Energy Inc. (XEL) shines with its ability to steadily generate cash flow, reflecting a resilient operational model. Its key point of vigilance is the declining return on invested capital, suggesting efficiency challenges ahead. XEL suits investors seeking aggressive growth with a tolerance for operational shifts.
CMS Energy Corporation (CMS) boasts a strategic moat through solid recurring revenue and a strong balance sheet, offering more financial stability than XEL. Its safety profile appeals to cautious investors who prioritize consistent income streams. CMS fits well within a GARP (Growth at a Reasonable Price) portfolio.
If you prioritize high-growth potential and can weather operational uncertainties, XEL is the compelling choice due to its cash generation prowess. However, if you seek better stability and a robust defensive position, CMS offers superior balance sheet strength and steadier income. Both present nuanced trade-offs requiring clear investor alignment.
Disclaimer: Investment carries a risk of loss of initial capital. The past performance is not a reliable indicator of future results. Be sure to understand risks before making an investment decision.
Go Further
I encourage you to read the complete analyses of Xcel Energy Inc. and CMS Energy Corporation to enhance your investment decisions: