Home > Comparison > Utilities > WEC vs CMS
The strategic rivalry between WEC Energy Group, Inc. and CMS Energy Corporation shapes the Utilities sector’s future. WEC operates as a diversified regulated electric utility with broad geographic reach and multiple energy sources. CMS focuses on integrated electric and gas utilities, emphasizing the Michigan market with strong renewable investments. This analysis evaluates which company’s operational model offers superior risk-adjusted returns, guiding investors seeking resilient exposure in regulated energy markets.
Table of contents
Companies Overview
WEC Energy Group and CMS Energy dominate the regulated electric market with distinct regional strengths and service scopes.
WEC Energy Group, Inc.: Midwestern Regulated Energy Powerhouse
WEC Energy Group operates primarily in the Midwest, generating revenue through regulated natural gas and electricity distribution. Its core business spans coal, natural gas, renewables, and electric transmission across multiple states. In 2021, WEC focused on expanding its renewable portfolio while maintaining extensive infrastructure, including 35,800 miles of overhead lines and 50,900 miles of gas mains, underpinning its robust market position.
CMS Energy Corporation: Michigan-Centric Integrated Utility
CMS Energy serves 1.9M electric and 1.8M gas customers mainly in Michigan. It earns revenue through electricity generation, transmission, and natural gas distribution across coal, nuclear, and renewables. The 2021 strategy emphasized optimizing its electric and gas utility segments, leveraging 82,474 miles of electric distribution lines and 28,065 miles of gas mains to provide reliable, integrated energy services in a concentrated regional footprint.
Strategic Collision: Similarities & Divergences
Both companies operate regulated utilities with strong gas and electric segments but differ in geographic breadth and scale. WEC pursues a multi-state approach with a heavy renewable push, while CMS focuses on deepening its Michigan market share with integrated gas and electric offerings. Their competition centers on regional customer retention and infrastructure modernization. Investment profiles diverge as WEC leans on diversified assets, whereas CMS emphasizes operational efficiency in a single state.
Income Statement Comparison
This data dissects the core profitability and scalability of both corporate engines to reveal who dominates the bottom line:
| Metric | WEC Energy Group, Inc. (WEC) | CMS Energy Corporation (CMS) |
|---|---|---|
| Revenue | 9.8B | 8.5B |
| Cost of Revenue | 4.8B | 3.3B |
| Operating Expenses | 2.6B | 3.5B |
| Gross Profit | 4.9B | 5.2B |
| EBITDA | 4.1B | 3.2B |
| EBIT | 2.6B | 2.0B |
| Interest Expense | 895M | 789M |
| Net Income | 1.6B | 1.1B |
| EPS | 4.86 | 3.53 |
| Fiscal Year | 2025 | 2025 |
Income Statement Analysis: The Bottom-Line Duel
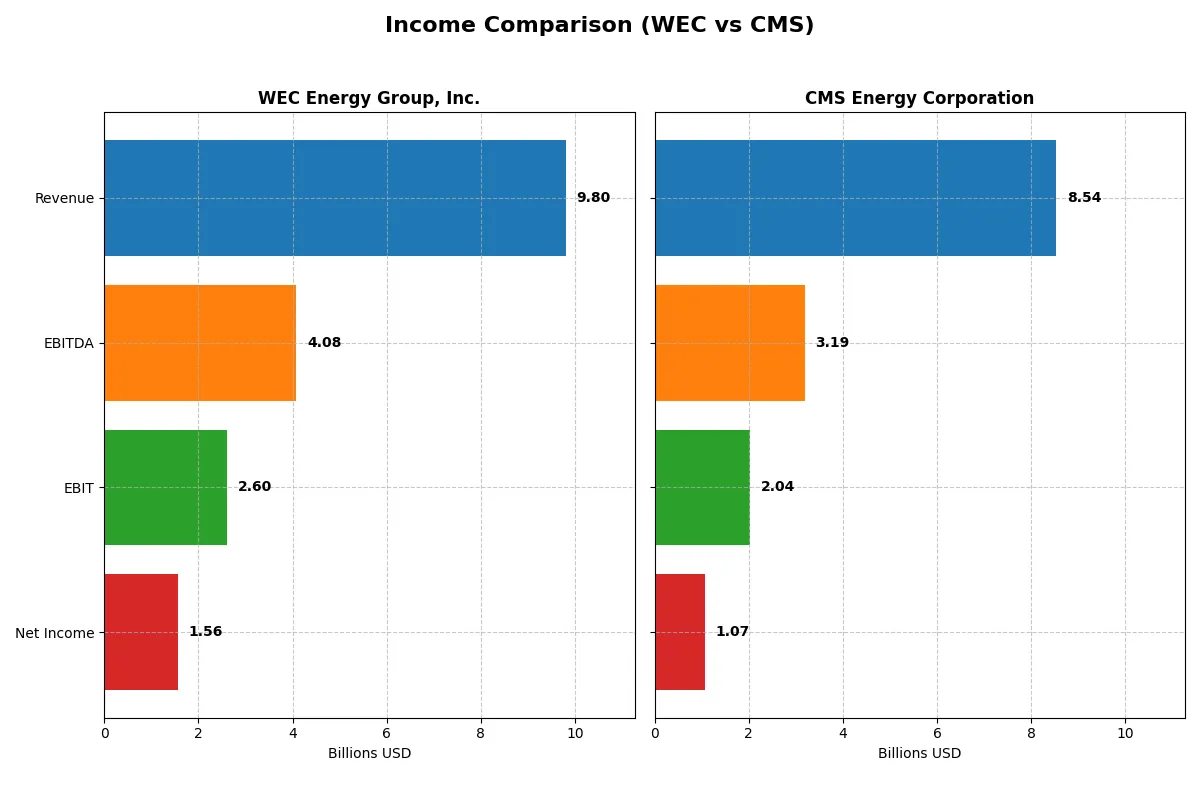
The following income statement comparison reveals the core efficiency and profitability dynamics driving each company’s financial engine in 2025.
WEC Energy Group, Inc. Analysis
WEC’s revenue grew steadily to $9.8B in 2025, with net income reaching $1.56B, reflecting solid earnings momentum. The company maintains a robust gross margin at 50.6% and a net margin near 15.9%, signaling effective cost control despite a slight net margin dip. Operating income rose modestly, underscoring steady operational efficiency.
CMS Energy Corporation Analysis
CMS posted $8.54B in revenue for 2025, up from prior years, with net income at $1.07B. It boasts a strong 60.9% gross margin but a thinner net margin of 12.5%, reflecting higher operating expenses. EBIT improved 11.3%, showing operational gains, yet net margin contraction over time suggests rising cost pressures impacting bottom-line growth.
Verdict: Gross Margin Strength vs. Net Income Resilience
WEC delivers superior net income and a healthier net margin, translating revenue into profits more efficiently than CMS. Despite CMS’s higher gross margin and revenue growth, its declining net margin and net income over the period weaken its fundamental profitability. For investors prioritizing consistent earnings quality, WEC’s profile offers more reliable bottom-line resilience.
Financial Ratios Comparison
These vital ratios act as a diagnostic tool to expose the underlying fiscal health, valuation premiums, and capital efficiency of the companies analyzed:
| Ratios | WEC Energy Group, Inc. (WEC) | CMS Energy Corporation (CMS) |
|---|---|---|
| ROE | 11.4% | 12.0% |
| ROIC | 5.2% | 3.7% |
| P/E | 22.0 | 19.5 |
| P/B | 2.52 | 2.34 |
| Current Ratio | 0.52 | 1.34 |
| Quick Ratio | 0.37 | 1.34 |
| D/E | 0.28 | 2.12 |
| Debt-to-Assets | 7.4% | 47.3% |
| Interest Coverage | 2.65 | 2.19 |
| Asset Turnover | 0.19 | 0.21 |
| Fixed Asset Turnover | 0.26 | 0.28 |
| Payout ratio | 73.7% | 60.5% |
| Dividend yield | 3.34% | 3.10% |
| Fiscal Year | 2025 | 2025 |
Efficiency & Valuation Duel: The Vital Signs
Financial ratios serve as a company’s DNA, uncovering hidden operational strengths and risk factors crucial to investors’ decisions.
WEC Energy Group, Inc.
WEC demonstrates solid profitability with a neutral ROE of 11.42% and a favorable net margin of 15.9%. Its valuation metrics, including a P/E of 22.02 and P/B of 2.52, appear fairly priced. The stock rewards shareholders with a 3.34% dividend yield, reflecting a balanced approach between income and reinvestment.
CMS Energy Corporation
CMS posts a comparable ROE of 12.01% but a lower net margin at 12.54%. Its P/E ratio of 19.49 and P/B of 2.34 signal reasonable valuation levels. CMS maintains a 3.1% dividend yield, while its higher debt-to-equity ratio signals increased leverage risk, offset by a strong current ratio and quick ratio enhancing liquidity.
Dividend Yield and Leverage: Balanced Strength vs. Liquidity Edge
WEC offers a slightly more favorable profitability and valuation profile with lower leverage but weaker liquidity. CMS provides stronger liquidity ratios but carries significantly higher debt. Investors prioritizing operational safety may prefer WEC, while those valuing liquidity might lean toward CMS.
Which one offers the Superior Shareholder Reward?
I compare WEC Energy Group, Inc. (WEC) and CMS Energy Corporation (CMS) on dividends, payout ratios, and buybacks for 2025. WEC yields 3.34% with a high payout ratio of 74%, but its free cash flow per share is negative (-$3.13), signaling strain. CMS yields slightly less at 3.10%, with a more conservative payout ratio of 60%, fully covered by positive free cash flow of $7.49 per share. WEC’s buyback data isn’t explicit, but its negative free cash flow suggests limited buyback capacity. CMS’s strong free cash flow supports consistent buybacks alongside dividends. Historically, sustainable dividends backed by free cash flow outperform in utilities. I conclude CMS offers superior total shareholder reward in 2026 due to its balanced, sustainable distribution policy and robust cash generation.
Comparative Score Analysis: The Strategic Profile
The radar chart reveals the fundamental DNA and trade-offs of WEC Energy Group and CMS Energy Corporation, highlighting their core financial strengths and vulnerabilities:
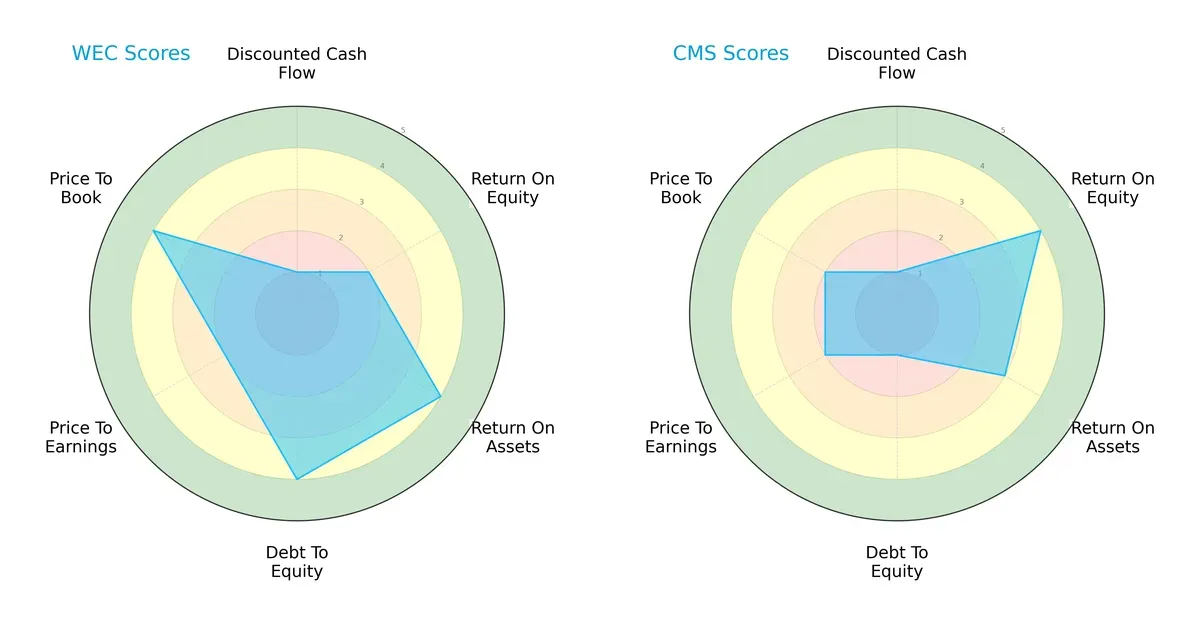
WEC shows a balanced profile with strong asset utilization (ROA 4) and low leverage risk (Debt/Equity 4), but weak cash flow valuation (DCF 1) and moderate profitability (ROE 2). CMS leans heavily on superior equity returns (ROE 4) but struggles with high leverage risk (Debt/Equity 1) and weaker valuation scores (P/B 2). WEC’s diverse strengths suggest stability, while CMS relies on operational efficiency amid financial risk.
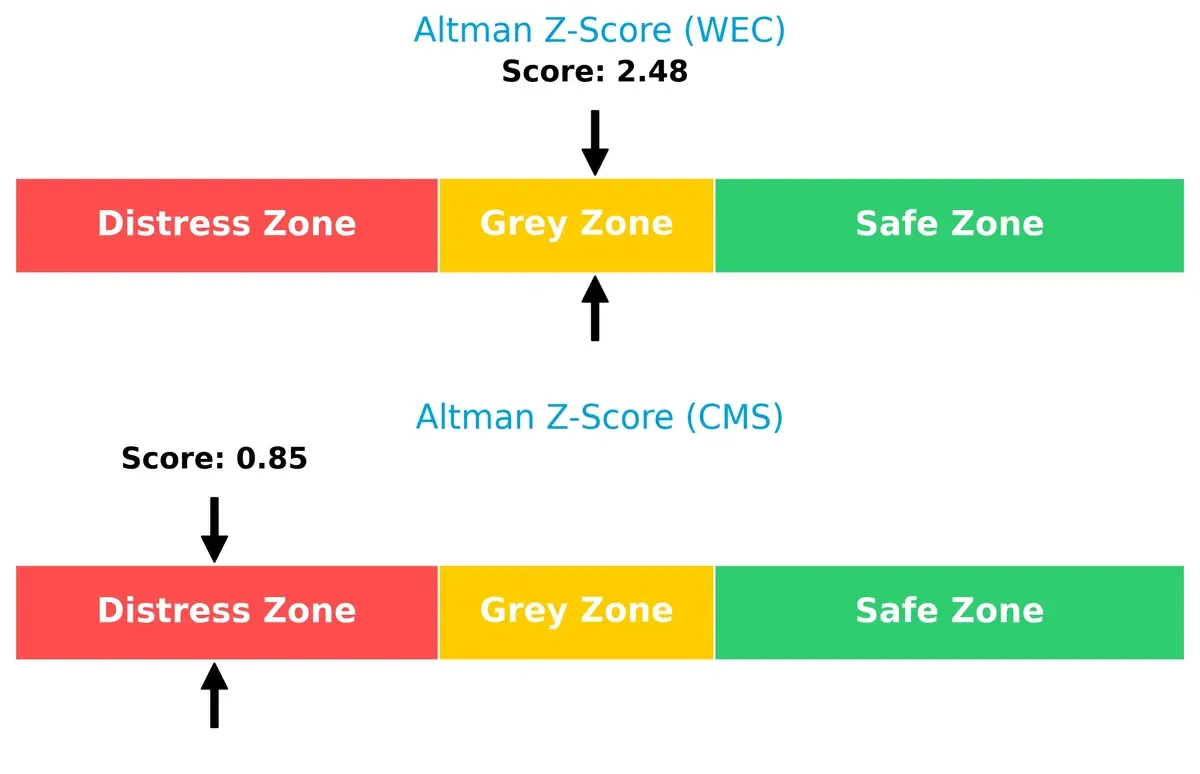
Bankruptcy Risk: Solvency Showdown
WEC’s Altman Z-Score of 2.48 places it in the grey zone, indicating moderate bankruptcy risk, while CMS’s 0.85 signals distress and high financial vulnerability in this cycle:
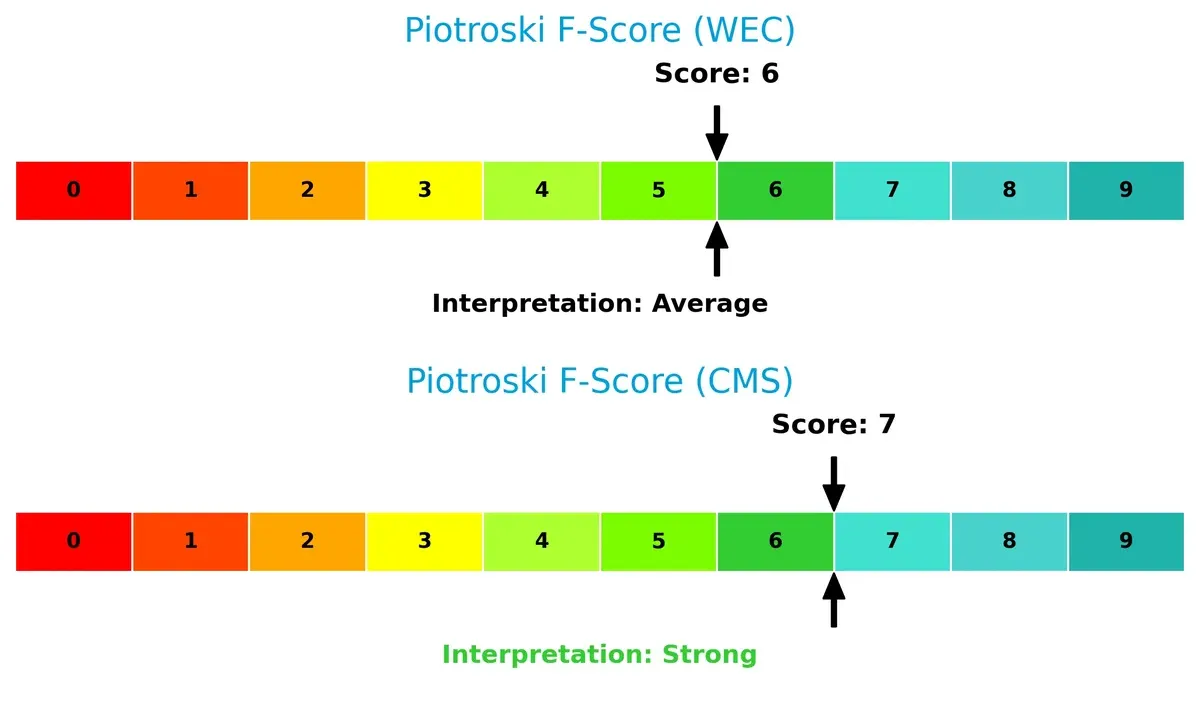
Financial Health: Quality of Operations
CMS edges out with a Piotroski F-Score of 7, marking strong financial health, whereas WEC’s 6 suggests average operational quality with minor red flags:
How are the two companies positioned?
This section dissects WEC and CMS’s operational DNA by comparing their revenue distribution and internal dynamics, including strengths and weaknesses. The goal is to confront their economic moats to reveal which model offers the most resilient, sustainable advantage today.
Revenue Segmentation: The Strategic Mix
The following visual comparison dissects how WEC Energy Group and CMS Energy diversify their income streams and where their primary sector bets lie:
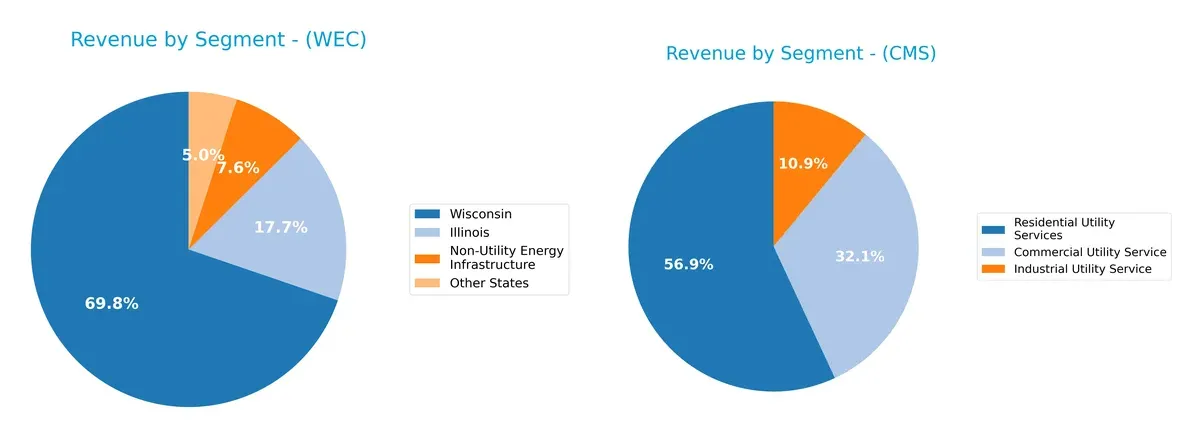
WEC anchors its revenue in Wisconsin with $6.3B, dwarfing its other segments like Illinois at $1.6B and Non-Utility Energy Infrastructure at $691M. This concentration signals infrastructure dominance but raises geographic risk. CMS shows a more balanced mix, pivoting on Residential Utility Services at $3.7B, Commercial Utility at $2.1B, and Industrial Utility at $720M. CMS’s diversification reduces reliance on any single segment, enhancing stability amid utility sector cycles.
Strengths and Weaknesses Comparison
This table compares the strengths and weaknesses of WEC Energy Group, Inc. and CMS Energy Corporation based on key financial and operational criteria:
WEC Strengths
- Higher net margin at 15.9% indicating better profitability
- Favorable WACC at 7.83% supports cost-efficient capital
- Lower debt-to-equity ratio of 0.28 suggesting conservative leverage
- Strong dividend yield at 3.34% appeals to income investors
- Geographic diversification with revenues from Illinois, Wisconsin, and other states
CMS Strengths
- Favorable net margin at 12.54% confirms profitability
- Lower WACC at 5.02% reflects cheaper capital costs
- Current and quick ratios above 1 indicate liquidity strength
- Favorable quick ratio of 1.34 signals strong short-term asset coverage
- Stable dividend yield at 3.1% supports shareholder returns
WEC Weaknesses
- Low current ratio at 0.52 flags potential liquidity risk
- Unfavorable quick ratio at 0.37 risks short-term obligations
- Asset turnover ratios below 0.3 suggest inefficient asset use
- ROIC at 5.18% below WACC indicates limited value creation
CMS Weaknesses
- ROIC at 3.71% below WACC raises concerns on capital efficiency
- High debt-to-equity at 2.12 implies higher financial risk
- Unfavorable asset turnover ratios highlight operational inefficiencies
WEC shows strengths in profitability and conservative leverage but faces liquidity and asset efficiency challenges. CMS demonstrates liquidity and capital cost advantages but struggles with capital efficiency and higher leverage. These contrasts reflect differing strategic and financial risk profiles.
The Moat Duel: Analyzing Competitive Defensibility
A structural moat is the only reliable barrier protecting long-term profits from relentless competitive erosion in regulated utilities:
WEC Energy Group, Inc.: Infrastructure Scale and Regulatory Insulation
WEC’s primary moat stems from its extensive regulated infrastructure and stable regulatory environment. This translates into consistent revenue growth and margin stability. Its expanding renewable portfolio in 2026 could deepen this moat, offsetting fossil fuel risks.
CMS Energy Corporation: Regional Market Focus and Operational Efficiency
CMS relies on a tightly focused Michigan market with cost discipline as its moat. Unlike WEC’s scale, CMS leverages operational efficiency to maintain margins. However, its declining ROIC trend in 2026 signals risks without geographic or product diversification.
Geographic Footprint vs. Operational Efficiency: Who Builds the Stronger Moat?
WEC’s broader geographic diversification and growing ROIC give it a deeper moat than CMS’s shrinking profitability and narrow market. I see WEC better positioned to defend and expand its market share amid evolving energy demands.
Which stock offers better returns?
Over the past year, WEC Energy Group, Inc. and CMS Energy Corporation showed strong price appreciation with notable highs and decelerating momentum in their bullish trends.
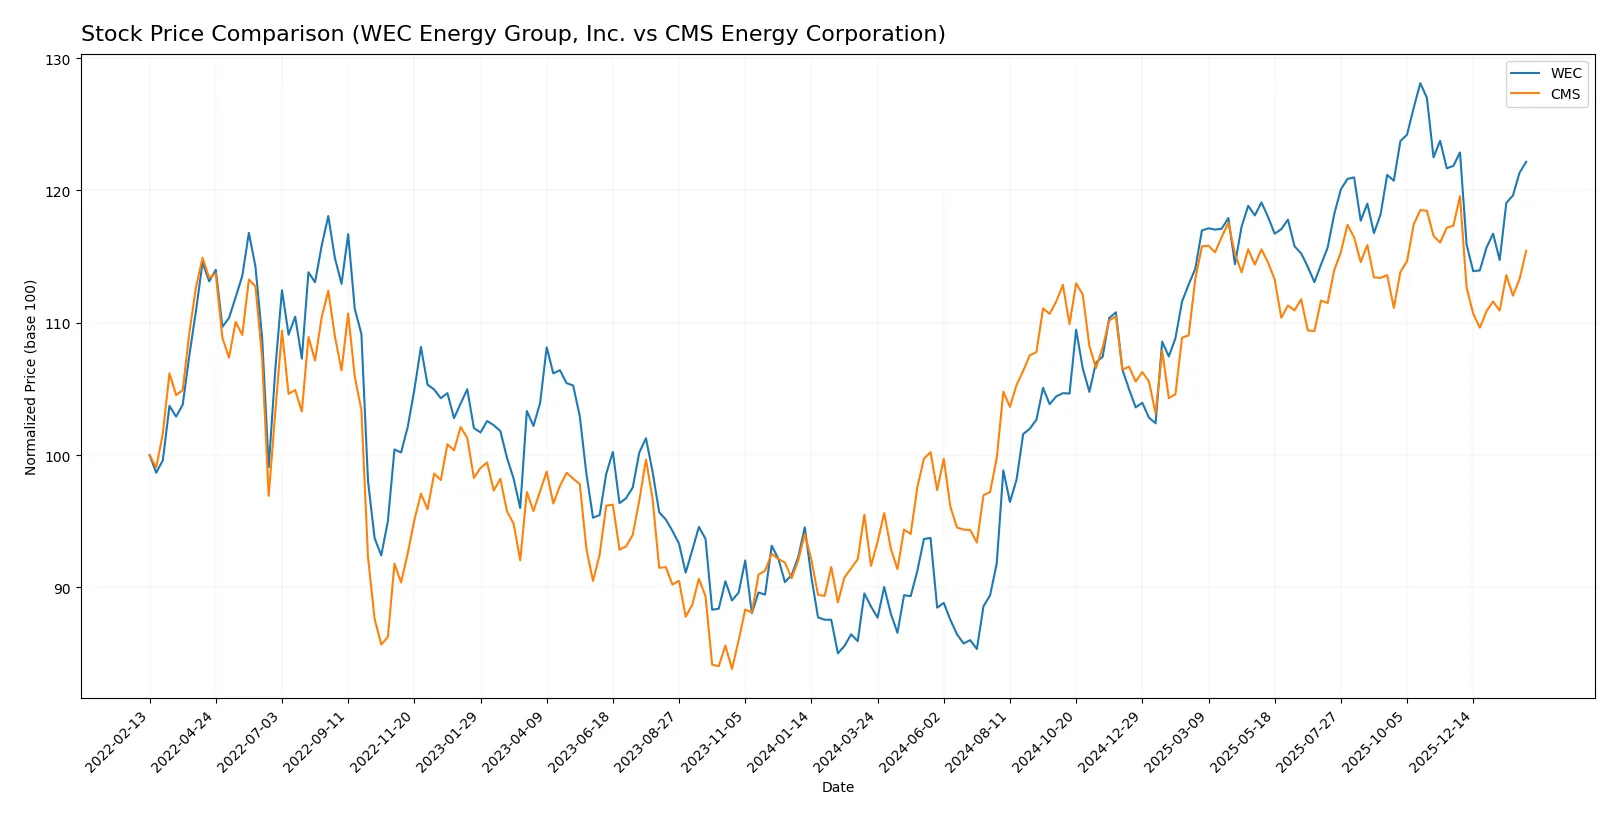
Trend Comparison
WEC Energy Group, Inc. recorded a 37.93% price increase over the past 12 months, signaling a bullish trend with decelerating acceleration and high volatility (11.0 std deviation). Its highest price reached 116.84, while the lowest was 77.85.
CMS Energy Corporation posted a 25.98% gain over the same period, also bullish but with decelerating acceleration. Volatility was lower at 4.7 std deviation, with a high of 75.44 and a low of 57.66.
WEC outperformed CMS with a stronger overall price increase, reflecting higher market returns despite greater volatility in the last 12 months.
Target Prices
Analysts show a moderately bullish consensus for both WEC Energy Group, Inc. and CMS Energy Corporation.
| Company | Target Low | Target High | Consensus |
|---|---|---|---|
| WEC Energy Group, Inc. | 105 | 135 | 121 |
| CMS Energy Corporation | 74 | 82 | 78.14 |
WEC’s consensus target of 121 implies a 9% upside from the current 111.42 price, reflecting confidence in its regulated utility moat. CMS’s 78.14 target suggests a 7% upside, consistent with steady sector fundamentals.

Don’t Let Luck Decide Your Entry Point
Optimize your entry points with our advanced ProRealTime indicators. You’ll get efficient buy signals with precise price targets for maximum performance. Start outperforming now!
How do institutions grade them?
The institutional grades for WEC Energy Group, Inc. and CMS Energy Corporation are as follows:
WEC Energy Group, Inc. Grades
This table summarizes the latest grades issued by major financial institutions for WEC Energy Group, Inc.:
| Grading Company | Action | New Grade | Date |
|---|---|---|---|
| Mizuho | Maintain | Outperform | 2026-02-06 |
| Jefferies | Maintain | Hold | 2026-01-28 |
| Barclays | Maintain | Equal Weight | 2026-01-22 |
| Wells Fargo | Maintain | Overweight | 2026-01-20 |
| JP Morgan | Maintain | Neutral | 2026-01-15 |
| B of A Securities | Maintain | Neutral | 2025-12-31 |
| UBS | Maintain | Neutral | 2025-12-17 |
| Barclays | Maintain | Equal Weight | 2025-12-16 |
| Keybanc | Maintain | Overweight | 2025-12-12 |
| JP Morgan | Maintain | Neutral | 2025-12-11 |
CMS Energy Corporation Grades
This table shows the most recent institutional grades for CMS Energy Corporation from reputable sources:
| Grading Company | Action | New Grade | Date |
|---|---|---|---|
| Mizuho | Maintain | Neutral | 2026-02-06 |
| Morgan Stanley | Maintain | Equal Weight | 2026-02-02 |
| Jefferies | Maintain | Buy | 2026-01-28 |
| Wells Fargo | Maintain | Equal Weight | 2026-01-20 |
| JP Morgan | Maintain | Overweight | 2026-01-15 |
| Jefferies | Maintain | Buy | 2026-01-15 |
| Barclays | Maintain | Overweight | 2026-01-15 |
| UBS | Maintain | Neutral | 2025-12-17 |
| JP Morgan | Maintain | Overweight | 2025-12-11 |
| Morgan Stanley | Maintain | Equal Weight | 2025-10-22 |
Which company has the best grades?
CMS Energy Corporation holds stronger grades overall, including multiple “Buy” and “Overweight” ratings. WEC Energy Group’s grades cluster around “Neutral” and “Hold,” signaling more cautious sentiment. Investors may interpret CMS’s higher grades as greater growth confidence.
Risks specific to each company
The following categories identify the critical pressure points and systemic threats facing both firms in the 2026 market environment:
1. Market & Competition
WEC Energy Group, Inc.
- Operates in multiple states with diversified energy sources, limiting regional market risk.
CMS Energy Corporation
- Primarily focused in Michigan, increasing exposure to state-level market fluctuations.
2. Capital Structure & Debt
WEC Energy Group, Inc.
- Low debt-to-equity ratio (0.28) signals conservative leverage and financial stability.
CMS Energy Corporation
- High debt-to-equity ratio (2.12) raises financial risk and limits flexibility.
3. Stock Volatility
WEC Energy Group, Inc.
- Beta of 0.58 indicates lower volatility than the market, providing defensive qualities.
CMS Energy Corporation
- Beta of 0.48 shows even lower volatility, suggesting stability in turbulent markets.
4. Regulatory & Legal
WEC Energy Group, Inc.
- Faces multi-state regulatory complexity but benefits from regulated utility status.
CMS Energy Corporation
- Regulatory risk concentrated in Michigan, subject to state policy shifts.
5. Supply Chain & Operations
WEC Energy Group, Inc.
- Extensive infrastructure across several states mitigates operational disruptions.
CMS Energy Corporation
- Heavy reliance on regional infrastructure may pose operational bottlenecks.
6. ESG & Climate Transition
WEC Energy Group, Inc.
- Mix of renewable and traditional energy sources supports gradual climate transition.
CMS Energy Corporation
- Incorporates nuclear and renewables but still dependent on fossil fuels, facing transition risk.
7. Geopolitical Exposure
WEC Energy Group, Inc.
- Primarily domestic U.S. exposure, reducing international geopolitical risk.
CMS Energy Corporation
- Limited to U.S. Midwest region, minimizing geopolitical complications but increasing regional vulnerability.
Which company shows a better risk-adjusted profile?
WEC’s most impactful risk is its unfavorable liquidity ratios, reflecting potential short-term financial strain. CMS faces significant risk from its high leverage, increasing default probability. I see WEC’s diversified operations and conservative debt profile yielding a better risk-adjusted outlook despite liquidity concerns. CMS’s distress-level Altman Z-score and elevated debt raise red flags for financial stability.
Final Verdict: Which stock to choose?
WEC Energy Group stands out for its robust dividend yield and steadily improving profitability, signaling a resilient cash-generating engine. However, its low liquidity ratios remain a point of vigilance, requiring careful monitoring. It suits investors targeting stable income with moderate growth ambitions.
CMS Energy’s strategic moat lies in its strong gross margins and healthier liquidity position, offering a safer harbor amid market volatility. Yet, its declining ROIC trend signals caution for value creation. It fits well in portfolios focused on balanced growth and capital preservation.
If you prioritize steady income and improving profitability, WEC outshines with its dependable cash flow and dividend profile. However, if you seek a more conservative profile with better liquidity and margin strength, CMS offers better stability despite challenges in capital efficiency. Each choice maps to distinct risk tolerances and investment goals.
Disclaimer: Investment carries a risk of loss of initial capital. The past performance is not a reliable indicator of future results. Be sure to understand risks before making an investment decision.
Go Further
I encourage you to read the complete analyses of WEC Energy Group, Inc. and CMS Energy Corporation to enhance your investment decisions: