Home > Comparison > Utilities > SO vs CMS
The strategic rivalry between The Southern Company and CMS Energy Corporation shapes the utilities sector’s evolution. Southern Company operates a capital-intensive, multi-state electric and gas infrastructure with a broad renewable portfolio. In contrast, CMS Energy focuses on a regional utility model emphasizing electric and gas services within Michigan. This analysis pits scale against regional specialization to identify which trajectory offers superior risk-adjusted returns for a diversified portfolio.

Table of contents
Companies Overview
The Southern Company and CMS Energy Corporation stand as influential players in the regulated electric utility sector.
The Southern Company: Diversified Energy Giant
The Southern Company dominates as a regulated electric utility with a robust market cap near 99B. It generates revenue through electricity generation, transmission, and gas distribution across multiple states. In 2026, its strategic focus emphasizes expanding renewable energy assets and digital communication services, reinforcing its competitive advantage in a diversified energy portfolio.
CMS Energy Corporation: Regional Utility Specialist
CMS Energy Corporation operates primarily in Michigan with a market cap of 22B. It earns revenue via electric and gas utility segments and independent power production, including renewables. Its 2026 strategy concentrates on optimizing utility infrastructure and advancing renewable generation, targeting sustainable growth within its regional footprint.
Strategic Collision: Similarities & Divergences
Both companies operate in regulated electric utilities but differ in scale and scope. Southern Company favors a broad, diversified approach with multi-state operations and digital services. CMS Energy focuses on regional dominance and infrastructure efficiency. Their primary battleground is renewable energy expansion. Investors face distinct profiles: Southern offers scale and diversification; CMS emphasizes regional specialization and operational precision.
Income Statement Comparison
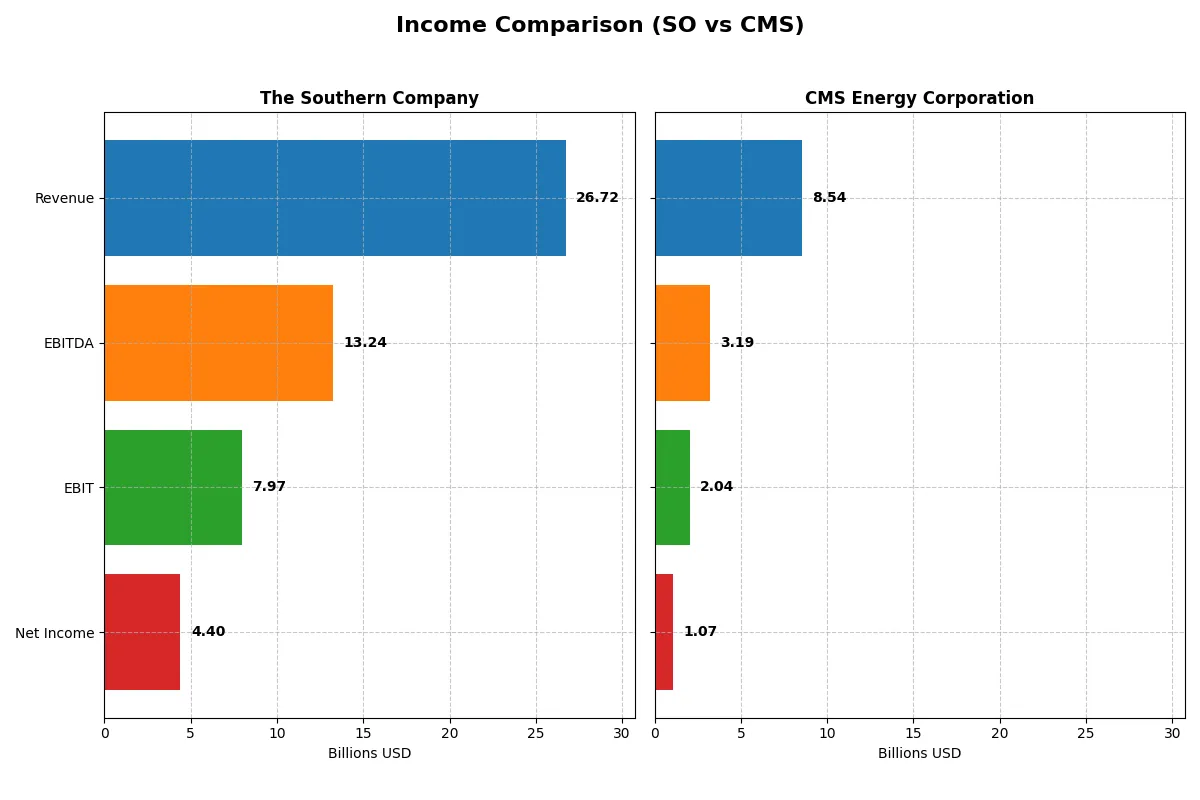
This data dissects the core profitability and scalability of both corporate engines to reveal who dominates the bottom line:
| Metric | The Southern Company (SO) | CMS Energy Corporation (CMS) |
|---|---|---|
| Revenue | 26.7B | 8.54B |
| Cost of Revenue | 13.4B | 3.34B |
| Operating Expenses | 6.27B | 3.47B |
| Gross Profit | 13.3B | 5.20B |
| EBITDA | 13.2B | 3.19B |
| EBIT | 7.97B | 2.04B |
| Interest Expense | 2.74B | 789M |
| Net Income | 4.40B | 1.06B |
| EPS | 4.02 | 3.53 |
| Fiscal Year | 2024 | 2025 |
Income Statement Analysis: The Bottom-Line Duel
This income statement comparison exposes how efficiently each company converts revenue into profit, revealing their operational strengths and weaknesses.
The Southern Company Analysis
The Southern Company’s revenue rose steadily from $20.4B in 2020 to $26.7B in 2024, marking a 31% growth over five years. Net income surged 40% to $4.4B in 2024, reflecting solid bottom-line momentum. Gross margin held strong near 50%, while net margin improved to 16.5%, signaling efficient cost control despite a high 10.3% interest expense burden.
CMS Energy Corporation Analysis
CMS Energy’s revenue climbed 16.5% from 2021 to 2025, reaching $8.5B in 2025. Net income declined 21% over the same period to about $1.1B, pressured by shrinking net margins down to 12.5%. Gross margin is robust at 60.9%, but rising operating expenses and a modest interest expense ratio of 9.2% weighed on net profitability and margin expansion.
Margin Strength vs. Growth Stability
The Southern Company outshines CMS with stronger net income growth and higher net margins, powered by steady revenue gains and disciplined cost management. CMS boasts superior gross margins but struggles with declining net income and compressed margins. Investors seeking consistent profit expansion may prefer Southern’s profile, while CMS’s margin strength may appeal to those focused on operational efficiency.
Financial Ratios Comparison
These vital ratios act as a diagnostic tool to expose the underlying fiscal health, valuation premiums, and capital efficiency of the companies compared here:
| Ratios | The Southern Company (SO) | CMS Energy Corporation (CMS) |
|---|---|---|
| ROE | 13.3% | 12.0% |
| ROIC | 4.3% | 3.7% |
| P/E | 20.5 | 19.5 |
| P/B | 2.72 | 2.34 |
| Current Ratio | 0.67 | 1.34 |
| Quick Ratio | 0.46 | 1.34 |
| D/E (Debt-to-Equity) | 2.00 | 2.12 |
| Debt-to-Assets | 45.7% | 47.3% |
| Interest Coverage | 2.58 | 2.19 |
| Asset Turnover | 0.18 | 0.21 |
| Fixed Asset Turnover | 0.25 | 0.28 |
| Payout Ratio | 67.1% | 60.5% |
| Dividend Yield | 3.27% | 3.10% |
| Fiscal Year | 2024 | 2025 |
Efficiency & Valuation Duel: The Vital Signs
Financial ratios act as a company’s DNA, exposing hidden risks and operational strengths vital for investment insight.
The Southern Company
The Southern Company shows moderate core profitability with a 13.25% ROE and a solid 16.47% net margin. Its valuation appears fairly priced at a 20.5 P/E and 2.72 P/B, neither expensive nor cheap. The 3.27% dividend yield rewards shareholders, reflecting a steady income focus rather than aggressive reinvestment or growth.
CMS Energy Corporation
CMS Energy posts a slightly lower 12.01% ROE and a 12.54% net margin, indicating decent but less robust profitability. Its valuation is neutral with a 19.49 P/E and 2.34 P/B. The 3.1% dividend yield supports shareholder returns, balancing income with moderate reinvestment given the neutral liquidity ratios.
Balanced Yield vs. Operational Caution
Southern Company delivers a more stable income stream with better profitability but shows weaker liquidity and efficiency ratios. CMS offers a neutral valuation with stronger liquidity and a slightly leaner risk profile. Income-focused investors may prefer Southern’s steady dividends; those wary of operational risks might lean toward CMS’s balanced metrics.
Which one offers the Superior Shareholder Reward?
I compare The Southern Company (SO) and CMS Energy Corporation (CMS) focusing on dividends and buybacks. SO yields around 3.3%-4.1% with payout ratios near 67%-85%. CMS yields roughly 2.7%-3.4% with payout ratios about 37%-65%. SO’s free cash flow coverage is weak, signaling risk to dividend sustainability. CMS displays stronger free cash flow coverage and a conservative payout, supporting sustainable dividends. Buybacks are minimal or unclear for both, making dividends the primary reward. I find CMS’s balanced payout and robust cash flow offer a more sustainable shareholder return in 2026.
Comparative Score Analysis: The Strategic Profile
The radar chart reveals the fundamental DNA and trade-offs of The Southern Company and CMS Energy Corporation:
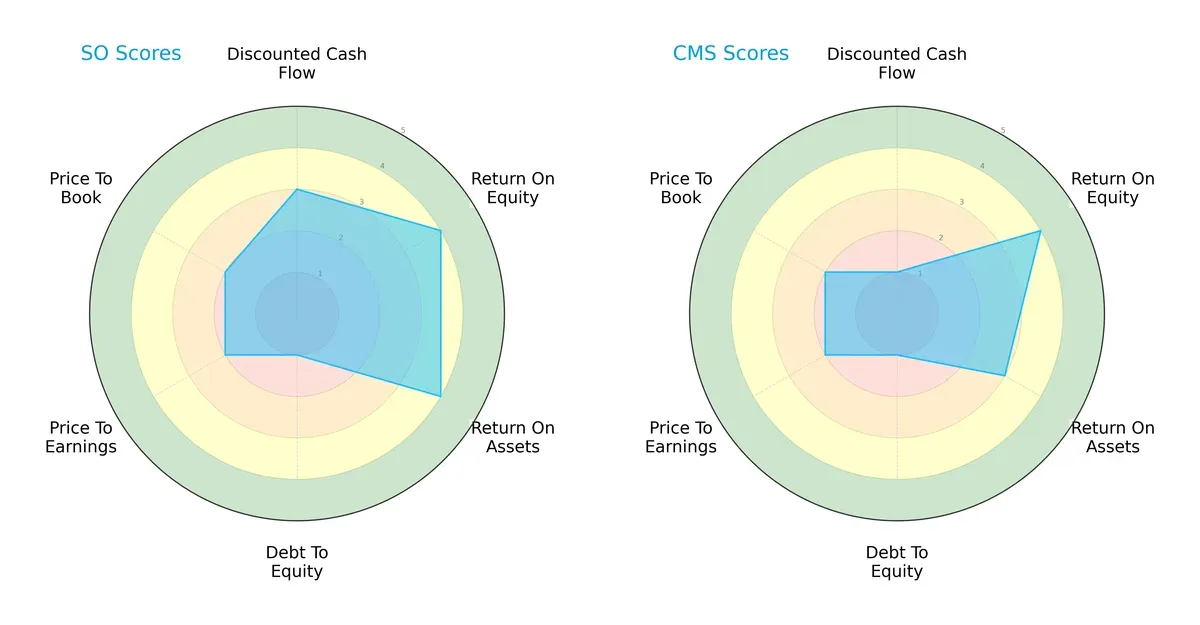
The Southern Company shows a more balanced profile with moderate DCF and strong ROE/ROA, but suffers from very unfavorable debt-to-equity and valuation scores. CMS relies heavily on favorable ROE but lags in DCF and asset efficiency. Both face valuation challenges, but Southern edges in operational efficiency.
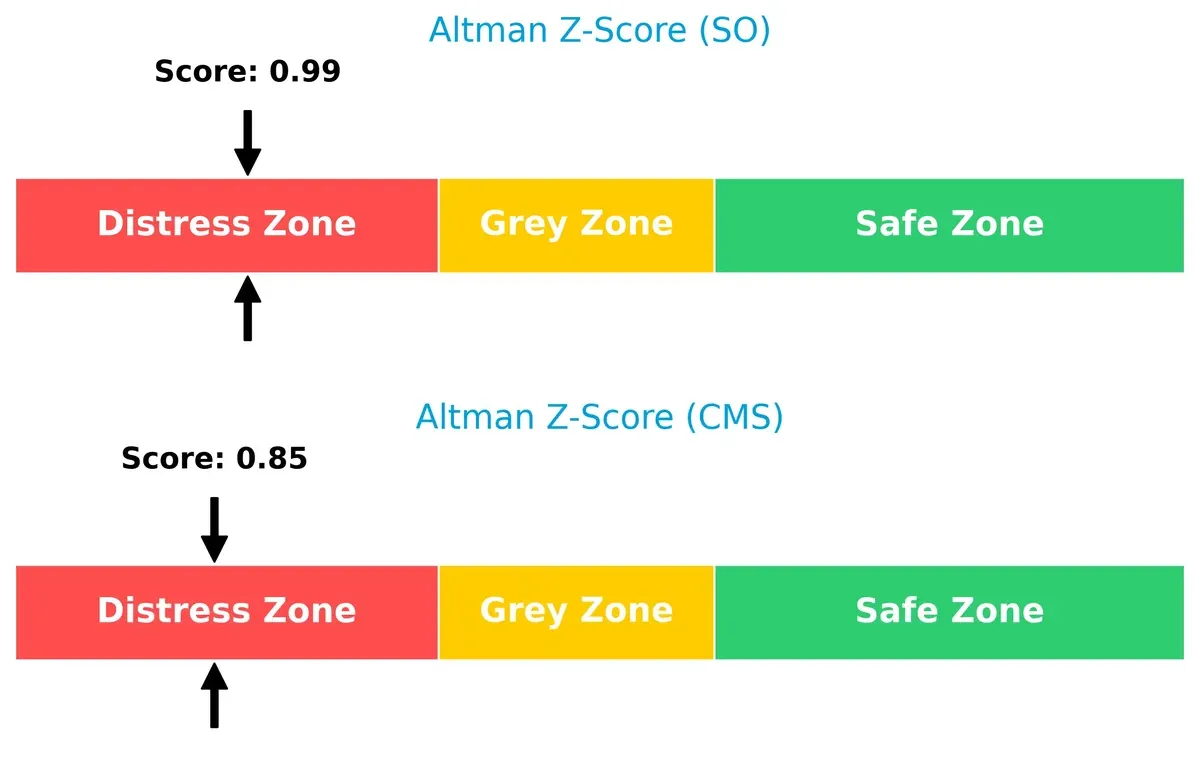
Bankruptcy Risk: Solvency Showdown
The Altman Z-Scores place both firms in the distress zone, signaling high bankruptcy risk and financial vulnerability in this market cycle:
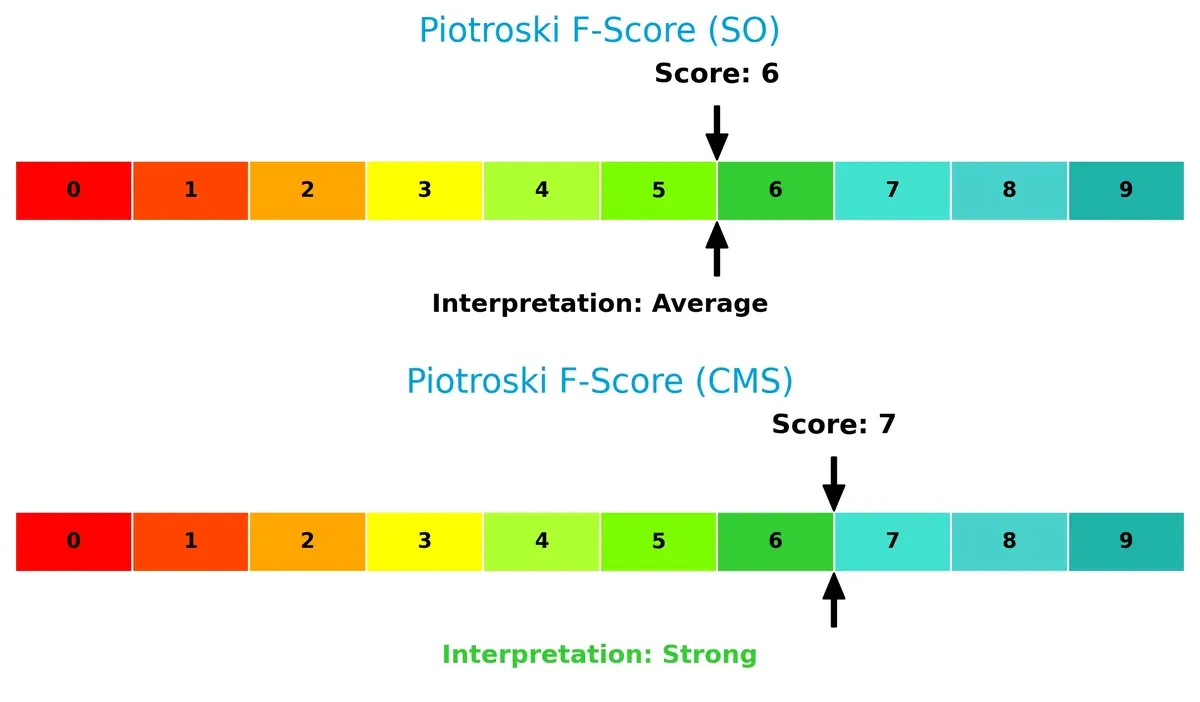
Financial Health: Quality of Operations
CMS scores a 7, indicating strong financial health, slightly outperforming Southern’s 6, which is average. Southern’s internal metrics hint at caution compared to CMS’s stronger operational quality:
How are the two companies positioned?
This section dissects the operational DNA of SO and CMS by comparing their revenue distribution and internal dynamics—strengths and weaknesses. The goal is to confront their economic moats to identify which model offers the most resilient, sustainable competitive advantage today.
Revenue Segmentation: The Strategic Mix
This visual comparison dissects how The Southern Company and CMS Energy diversify their income streams and where their primary sector bets lie:
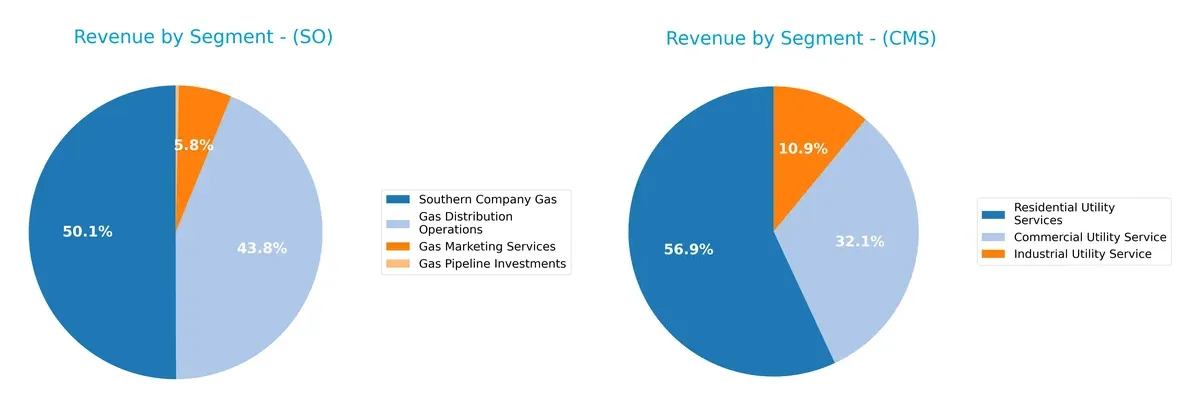
The Southern Company anchors revenue heavily in Electric Utilities with $22.9B in 2022, while Southern Company Gas adds $5.96B, showing moderate diversification. CMS Energy pivots on Residential Utility Services at $4.4B in 2022, with Commercial and Industrial Utility Services trailing at $2.3B and $867M respectively. Southern’s concentration in electric utilities signals infrastructure dominance; CMS’s balanced mix lowers concentration risk but lacks Southern’s scale.
Strengths and Weaknesses Comparison
This table compares the strengths and weaknesses of The Southern Company and CMS Energy Corporation:
SO Strengths
- Higher net margin at 16.47% indicates stronger profitability
- Favorable WACC at 4.99% supports cost-efficient capital
- Dividend yield of 3.27% rewards shareholders
- Diverse gas and electric utility segments boost revenue stability
CMS Strengths
- Favorable net margin at 12.54% shows solid profitability
- Strong quick ratio at 1.34 signals good short-term liquidity
- Dividend yield of 3.1% provides steady income
- Balanced commercial, industrial, and residential utility revenues
SO Weaknesses
- Low current ratio at 0.67 risks short-term liquidity issues
- High debt to equity at 2.0 signals elevated leverage
- Unfavorable ROIC at 4.25% below WACC suggests weak capital returns
- Low asset turnover indicates inefficient asset use
CMS Weaknesses
- High debt to equity at 2.12 increases financial risk
- Unfavorable ROIC at 3.71% below WACC reflects poor capital efficiency
- Asset turnover remains low, pointing to possible operational inefficiency
The Southern Company excels in profitability and dividend yield but faces liquidity and capital efficiency challenges. CMS maintains balanced liquidity and profitability yet struggles with leverage and returns on invested capital. Both companies must address operational efficiency to enhance long-term value.
The Moat Duel: Analyzing Competitive Defensibility
A structural moat is the only thing protecting long-term profits from the erosion of competition. Let’s dissect how Southern Company and CMS Energy defend their turf:
The Southern Company: Scale and Infrastructure Lock-in
Southern Company’s moat stems from extensive natural gas pipelines and a diversified power generation mix. Its stable margins and rising ROIC trend show efficient capital use despite value erosion. New renewable projects in 2026 could deepen its infrastructure advantage.
CMS Energy Corporation: Regional Utility Footprint
CMS relies on a concentrated Michigan market and regulated utility status, contrasting Southern’s broader scale. However, declining ROIC signals weakening capital efficiency. Expansion into renewables might offset shrinking margins but remains a challenge.
Infrastructure Depth vs. Regional Concentration: Moat Strength in Utilities
Southern Company’s wider operational scale and improving ROIC trend grant it a deeper moat than CMS’s shrinking profitability and regional focus. Southern is better positioned to defend market share amid rising competitive pressures in 2026.
Which stock offers better returns?
Over the past year, both The Southern Company and CMS Energy Corporation showed strong price gains with decelerating bullish momentum. The Southern Company achieved higher overall appreciation despite recent neutral trading dynamics.
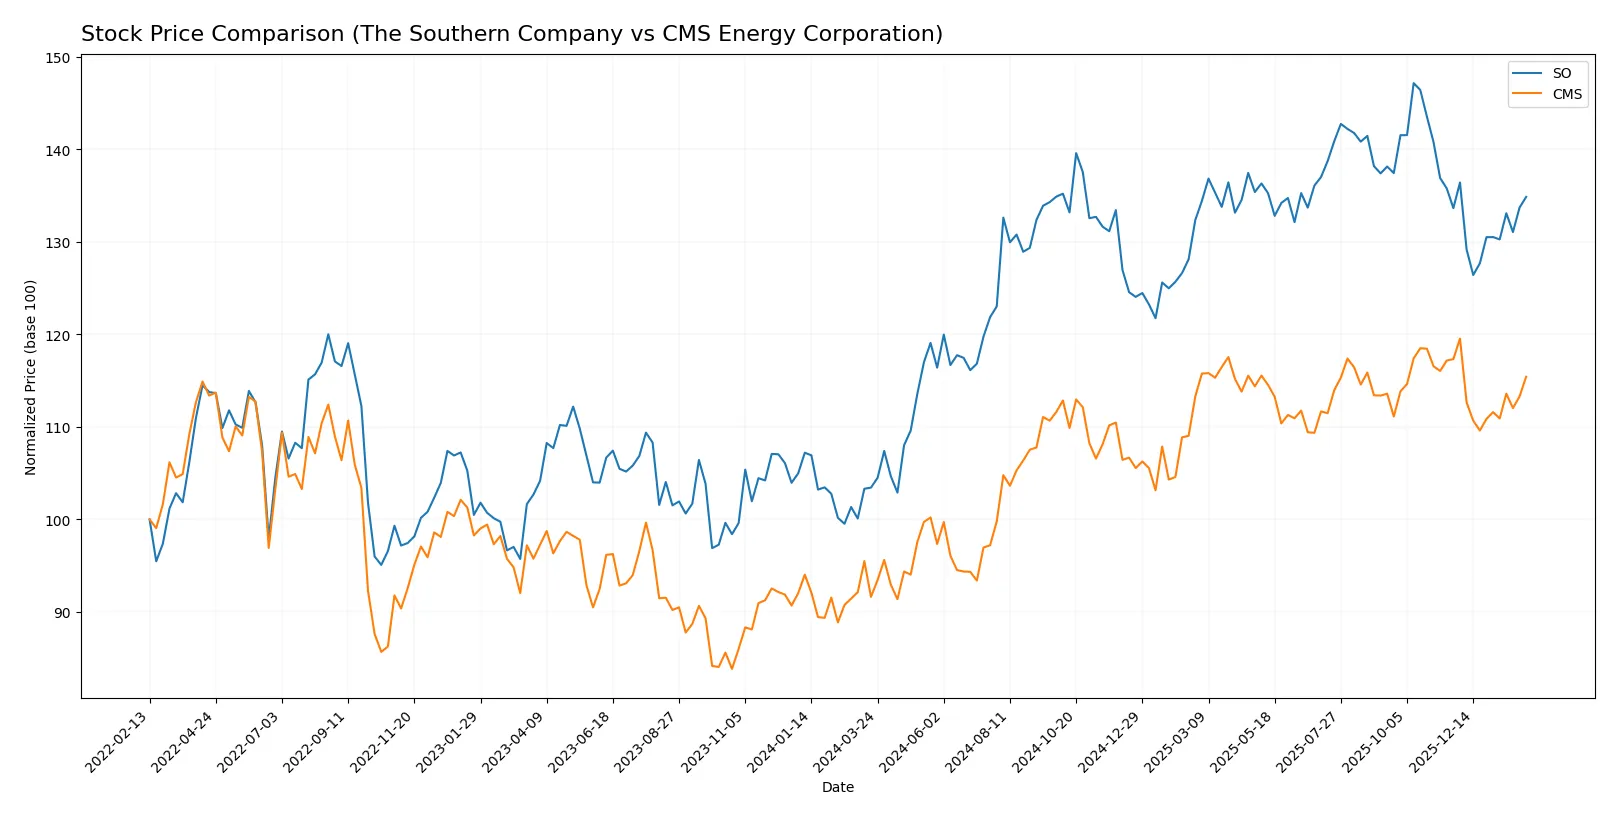
Trend Comparison
The Southern Company’s stock rose 30.38% over the last 12 months, marking a bullish trend with decelerating momentum. Its price ranged from 68.73 to 98.29, showing solid gains despite recent neutral price movement (+0.91%).
CMS Energy Corporation’s stock increased 25.98% over the same period, also bullish but with deceleration. The price fluctuated between 57.66 and 75.44. Recent trading showed a slight decline of -1.62%, indicating short-term weakness.
Comparing both, The Southern Company outperformed CMS Energy with a 30.38% gain versus 25.98%. Its higher total return and recent stable price slope indicate stronger market performance over the past year.
Target Prices
Analysts present a moderate upside potential for both The Southern Company and CMS Energy Corporation.
| Company | Target Low | Target High | Consensus |
|---|---|---|---|
| The Southern Company | 76 | 105 | 92.5 |
| CMS Energy Corporation | 74 | 82 | 78.14 |
The Southern Company’s consensus target of 92.5 slightly exceeds its current price of 90.08, suggesting modest appreciation potential. CMS Energy’s target consensus at 78.14 also indicates upside from its current 72.84 price, reflecting cautious optimism.

Don’t Let Luck Decide Your Entry Point
Optimize your entry points with our advanced ProRealTime indicators. You’ll get efficient buy signals with precise price targets for maximum performance. Start outperforming now!
How do institutions grade them?
The Southern Company Grades
The following table summarizes recent institutional grades for The Southern Company:
| Grading Company | Action | New Grade | Date |
|---|---|---|---|
| Wells Fargo | Downgrade | Underweight | 2026-01-20 |
| Barclays | Maintain | Equal Weight | 2026-01-15 |
| UBS | Maintain | Neutral | 2025-12-17 |
| JP Morgan | Maintain | Neutral | 2025-12-15 |
| Jefferies | Maintain | Neutral | 2025-12-15 |
| Keybanc | Maintain | Underweight | 2025-12-12 |
| RBC Capital | Maintain | Sector Perform | 2025-12-12 |
| Mizuho | Maintain | Neutral | 2025-12-11 |
| Barclays | Maintain | Equal Weight | 2025-11-20 |
| Jefferies | Downgrade | Neutral | 2025-11-05 |
CMS Energy Corporation Grades
The following table summarizes recent institutional grades for CMS Energy Corporation:
| Grading Company | Action | New Grade | Date |
|---|---|---|---|
| Mizuho | Maintain | Neutral | 2026-02-06 |
| Morgan Stanley | Maintain | Equal Weight | 2026-02-02 |
| Jefferies | Maintain | Buy | 2026-01-28 |
| Wells Fargo | Maintain | Equal Weight | 2026-01-20 |
| JP Morgan | Maintain | Overweight | 2026-01-15 |
| Jefferies | Maintain | Buy | 2026-01-15 |
| Barclays | Maintain | Overweight | 2026-01-15 |
| UBS | Maintain | Neutral | 2025-12-17 |
| JP Morgan | Maintain | Overweight | 2025-12-11 |
| Morgan Stanley | Maintain | Equal Weight | 2025-10-22 |
Which company has the best grades?
CMS Energy Corporation holds consistently higher grades, including multiple Buy and Overweight ratings. The Southern Company mostly receives Neutral or Underweight ratings. This difference may influence investor sentiment and portfolio allocation.
Risks specific to each company
The following categories identify the critical pressure points and systemic threats facing both firms in the 2026 market environment:
1. Market & Competition
The Southern Company
- Operates in multiple states with a diverse generation mix, facing intense regulated utility competition.
CMS Energy Corporation
- Primarily Michigan-focused, with a smaller footprint but diversified energy sources, facing regional competition.
2. Capital Structure & Debt
The Southern Company
- High debt-to-equity ratio of 2.0 signals leverage risk; interest coverage is moderate at 2.91x.
CMS Energy Corporation
- Slightly higher debt-to-equity at 2.12, with weaker interest coverage at 2.58x, indicating similar leverage concerns.
3. Stock Volatility
The Southern Company
- Low beta of 0.447 suggests stable stock with low volatility relative to the market.
CMS Energy Corporation
- Beta slightly higher at 0.481, implying marginally more price sensitivity but still stable.
4. Regulatory & Legal
The Southern Company
- Broad regulatory exposure across multiple states increases complexity and compliance risk.
CMS Energy Corporation
- Concentrated regulation in Michigan simplifies compliance but heightens state-specific regulatory risk.
5. Supply Chain & Operations
The Southern Company
- Extensive infrastructure with 76K miles of natural gas pipelines may strain operational efficiency.
CMS Energy Corporation
- Smaller infrastructure footprint aids operational focus but limits scale benefits.
6. ESG & Climate Transition
The Southern Company
- Invested in renewables and battery storage but fossil fuel reliance remains significant.
CMS Energy Corporation
- Similar renewable investments with a moderately lower fossil fuel dependency, supporting transition efforts.
7. Geopolitical Exposure
The Southern Company
- Exposure mainly domestic US markets; limited international risk but vulnerable to national policy shifts.
CMS Energy Corporation
- Also US-focused with regional concentration, facing similar domestic policy risks but less geographic diversity.
Which company shows a better risk-adjusted profile?
The Southern Company’s main risk is its high leverage combined with suboptimal liquidity ratios, pushing it into financial distress territory. CMS Energy’s critical risk lies in its weaker debt service capability amid similar high leverage. CMS’s stronger Piotroski score and better liquidity ratios create a more balanced risk profile. Notably, Southern’s Altman Z-Score of 0.99 versus CMS’s 0.85 reflects both companies’ distress zone status but favors CMS marginally. Hence, CMS Energy demonstrates a slightly better risk-adjusted position in 2026.
Final Verdict: Which stock to choose?
The Southern Company’s superpower lies in its resilient income generation and steady profitability growth. Despite a somewhat stretched balance sheet and weak liquidity ratios, it shows improving operational efficiency. This stock aligns well with an aggressive growth portfolio that can tolerate near-term financial vulnerabilities for potential long-term gains.
CMS Energy Corporation stands out with a strategic moat rooted in stable cash flow and solid current liquidity. While its declining return on invested capital flags caution, it offers a comparatively safer financial profile than Southern Company. CMS fits portfolios focused on GARP—seeking growth tempered by reasonable valuation and balance sheet strength.
If you prioritize robust income growth and can accept higher leverage, Southern Company is the compelling choice due to its improving profitability and bullish price momentum. However, if you seek better liquidity and financial stability alongside moderate growth, CMS offers superior risk management despite a less favorable profitability trend. Both present distinct analytical scenarios tailored to different investor tolerances and strategy preferences.
Disclaimer: Investment carries a risk of loss of initial capital. The past performance is not a reliable indicator of future results. Be sure to understand risks before making an investment decision.
Go Further
I encourage you to read the complete analyses of The Southern Company and CMS Energy Corporation to enhance your investment decisions: