Home > Comparison > Utilities > PEG vs CMS
The strategic rivalry between Public Service Enterprise Group Incorporated and CMS Energy Corporation shapes the competitive landscape of the regulated electric utilities sector. Public Service Enterprise Group operates a capital-intensive transmission and distribution network in the Northeast, while CMS Energy emphasizes a diversified generation portfolio across Michigan. This analysis will compare their operational models and capital allocation to identify which company presents a superior risk-adjusted opportunity for a balanced utility investment.
Table of contents
Companies Overview
Public Service Enterprise Group and CMS Energy dominate the regulated electric utility markets in the US Northeast and Michigan.
Public Service Enterprise Group: Northeast Energy Infrastructure Leader
Public Service Enterprise Group operates as a regulated electric utility in the Northeastern and Mid-Atlantic US. Its core revenue derives from electricity transmission and distribution, gas delivery, and solar project investments. In 2021, it prioritized expanding its electric and gas infrastructure, managing 25,000 circuit miles and 18,000 gas mains to support reliability and growth.
CMS Energy: Michigan’s Diverse Utility Operator
CMS Energy serves primarily Michigan with a regulated electric and gas utility business. It generates revenue through electric and gas distribution, including coal, nuclear, and renewable energy sources. In 2021, CMS focused on diversified energy production and expanding its infrastructure covering 82,474 miles of electric lines and 28,065 miles of gas mains to meet growing customer demand.
Strategic Collision: Similarities & Divergences
Both companies emphasize regulated utilities with strong infrastructure, but Public Service Enterprise Group leans more on electric transmission and solar, while CMS balances electric and gas with diverse generation sources. Their battleground is infrastructure modernization and renewable integration. PEG offers scale and network breadth; CMS provides energy diversity and regional focus, defining distinct risk and growth profiles for investors.
Income Statement Comparison
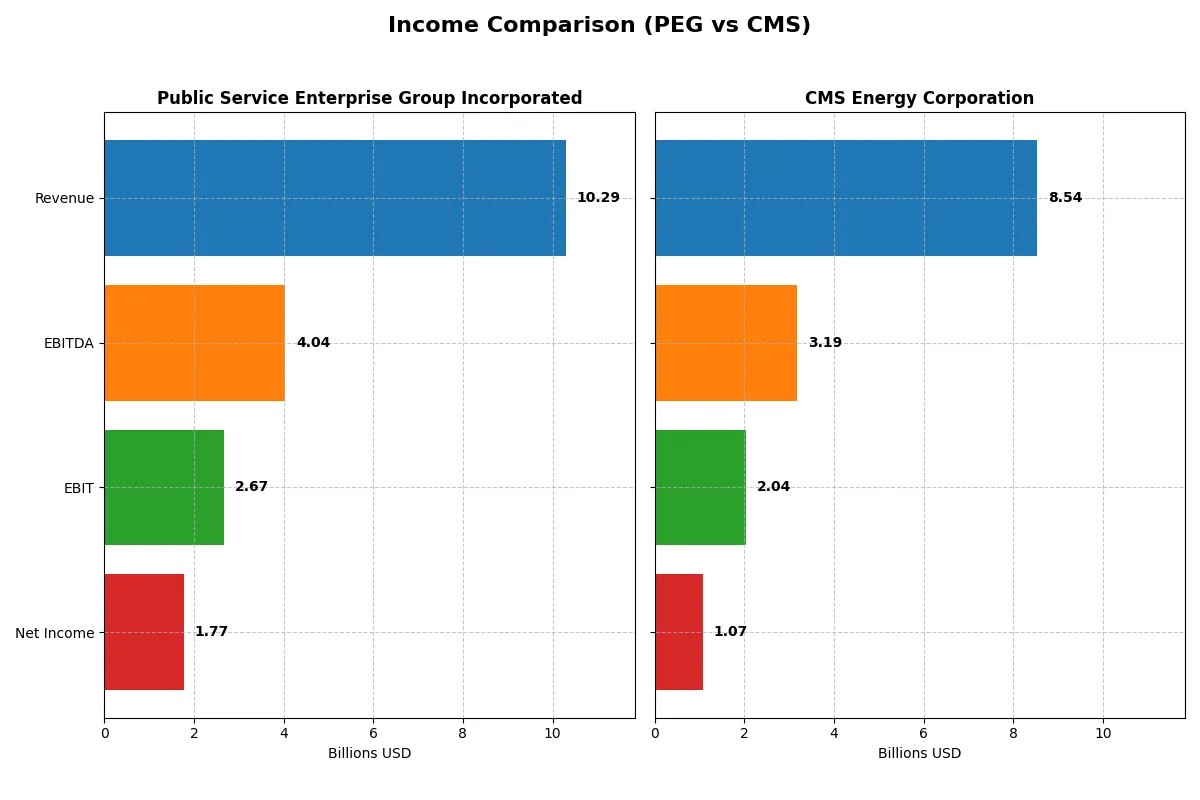
This data dissects the core profitability and scalability of both corporate engines to reveal who dominates the bottom line:
| Metric | Public Service Enterprise Group Incorporated (PEG) | CMS Energy Corporation (CMS) |
|---|---|---|
| Revenue | 10.29B | 7.52B |
| Cost of Revenue | 6.75B | 4.31B |
| Operating Expenses | 1.19B | 1.72B |
| Gross Profit | 3.54B | 3.21B |
| EBITDA | 4.04B | 3.07B |
| EBIT | 2.67B | 1.83B |
| Interest Expense | 841M | 708M |
| Net Income | 1.77B | 1.00B |
| EPS | 3.56 | 3.34 |
| Fiscal Year | 2024 | 2024 |
Income Statement Analysis: The Bottom-Line Duel
This income statement comparison reveals which company runs a more efficient and profitable corporate engine under current market conditions.
Public Service Enterprise Group Incorporated Analysis
PEG’s revenue grew modestly over five years but declined 8.4% in 2024 to $10.3B. Net income dropped sharply to $1.77B, reflecting a 24.5% net margin contraction. Despite a solid 34.4% gross margin, profitability momentum stalled, with EBIT falling 29.3%. PEG’s efficiency waned, signaling margin pressure and weakening earnings quality in the latest year.
CMS Energy Corporation Analysis
CMS posted steady revenue growth, rising 13.6% to $8.54B in 2025, with net income at $1.07B, up modestly in EPS by 6%. The company boasts a robust 60.9% gross margin and a healthy 23.9% EBIT margin. However, CMS’s net margin fell 6% year-over-year, indicating increased operating expenses. Still, CMS maintains strong profitability momentum and operational leverage in the latest fiscal period.
Margin Power vs. Revenue Scale
PEG leads in net margin at 17.2%, while CMS impresses with a superior gross margin near 61%. PEG’s declining revenues and profits contrast with CMS’s growth and improving EPS. CMS’s operational efficiency and revenue momentum outpace PEG’s margin erosion, positioning CMS as the fundamentally stronger operator. Investors seeking growth with margin resilience may prefer CMS’s profile over PEG’s faltering trends.
Financial Ratios Comparison
These vital ratios act as a diagnostic tool to expose the underlying fiscal health, valuation premiums, and capital efficiency of the companies compared below:
| Ratios | Public Service Enterprise Group (PEG) | CMS Energy Corporation (CMS) |
|---|---|---|
| ROE | 11.0% (2024) | 12.0% (2025) |
| ROIC | 4.4% (2024) | 3.7% (2025) |
| P/E | 23.7 (2024) | 19.5 (2025) |
| P/B | 2.61 (2024) | 2.34 (2025) |
| Current Ratio | 0.65 (2024) | 1.34 (2025) |
| Quick Ratio | 0.48 (2024) | 1.34 (2025) |
| D/E (Debt-to-Equity) | 1.42 (2024) | 2.12 (2025) |
| Debt-to-Assets | 41.9% (2024) | 47.3% (2025) |
| Interest Coverage | 2.80 (2024) | 2.19 (2025) |
| Asset Turnover | 0.19 (2024) | 0.21 (2025) |
| Fixed Asset Turnover | 0.26 (2024) | 0.28 (2025) |
| Payout Ratio | 67.5% (2024) | 60.5% (2025) |
| Dividend Yield | 2.84% (2024) | 3.10% (2025) |
| Fiscal Year | 2024 | 2025 |
Efficiency & Valuation Duel: The Vital Signs
Financial ratios act as the company’s DNA, uncovering hidden risks and operational strengths that shape investment potential.
Public Service Enterprise Group Incorporated
PEG shows moderate profitability with an 11.0% ROE and a favorable 17.22% net margin, indicating solid core earnings. Its valuation appears neutral, trading at a P/E of 23.74 and P/B of 2.61, suggesting the stock is fairly priced. PEG rewards shareholders with a 2.84% dividend yield, reflecting steady income rather than aggressive growth reinvestment.
CMS Energy Corporation
CMS delivers a slightly higher ROE of 12.01% but a lower net margin of 12.54%, signaling efficient capital use but thinner profitability. Its valuation is neutral with a P/E of 19.49 and P/B of 2.34, indicating a more attractive price relative to earnings. CMS offers a 3.1% dividend yield and maintains a healthier current ratio, balancing income and liquidity.
Balanced Yield vs. Operational Resilience
PEG’s higher margins and consistent dividends contrast with CMS’s better liquidity and slightly more attractive valuation. CMS offers a more balanced risk profile, while PEG suits investors prioritizing dividend income. Each profile fits distinct investor goals amid sector challenges.
Which one offers the Superior Shareholder Reward?
I find that Public Service Enterprise Group (PEG) offers a more balanced and sustainable shareholder reward compared to CMS Energy Corporation (CMS). PEG yields around 2.8–3.7% with payout ratios near 45–67%, showing solid free cash flow coverage in recent years despite some volatility. PEG’s buyback activity is modest but consistent, supporting total return without overleveraging. CMS yields roughly 3.1–3.4% with payout ratios around 60%, but exhibits weaker free cash flow coverage and more negative free cash flow per share, indicating riskier dividend sustainability. CMS’s buybacks appear less emphasized, focusing on dividend stability. Historically in utilities, a dividend well-covered by free cash flow is a hallmark of durable returns. I thus prefer PEG’s more prudent capital allocation and sustainable distribution, offering superior total return potential for 2026 investors.
Comparative Score Analysis: The Strategic Profile
The radar chart reveals the fundamental DNA and strategic trade-offs shaping both firms’ financial profiles:
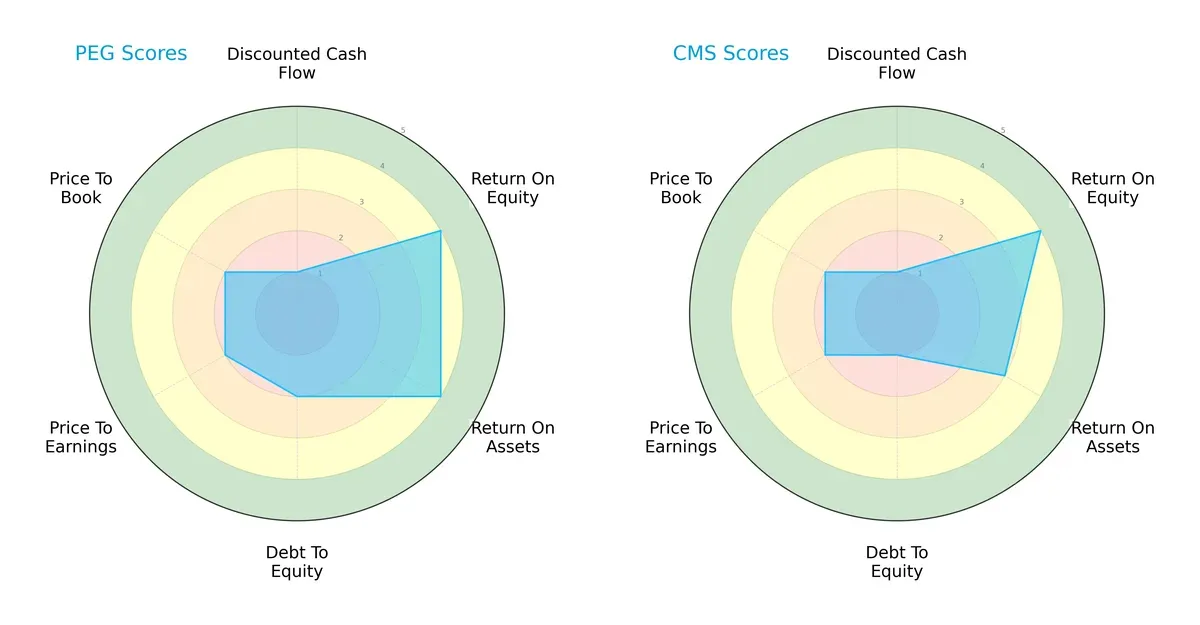
Public Service Enterprise Group (PEG) shows a balanced strength in ROE and ROA with moderate leverage risks. CMS Energy (CMS) matches PEG’s ROE but lags in asset efficiency and bears heavier debt burden. PEG’s valuation metrics are weak but less so than CMS, suggesting PEG relies on operational efficiency while CMS faces structural financial risks.
Bankruptcy Risk: Solvency Showdown
Both companies fall into the distress zone on the Altman Z-Score scale, signaling elevated bankruptcy risk in this economic cycle:
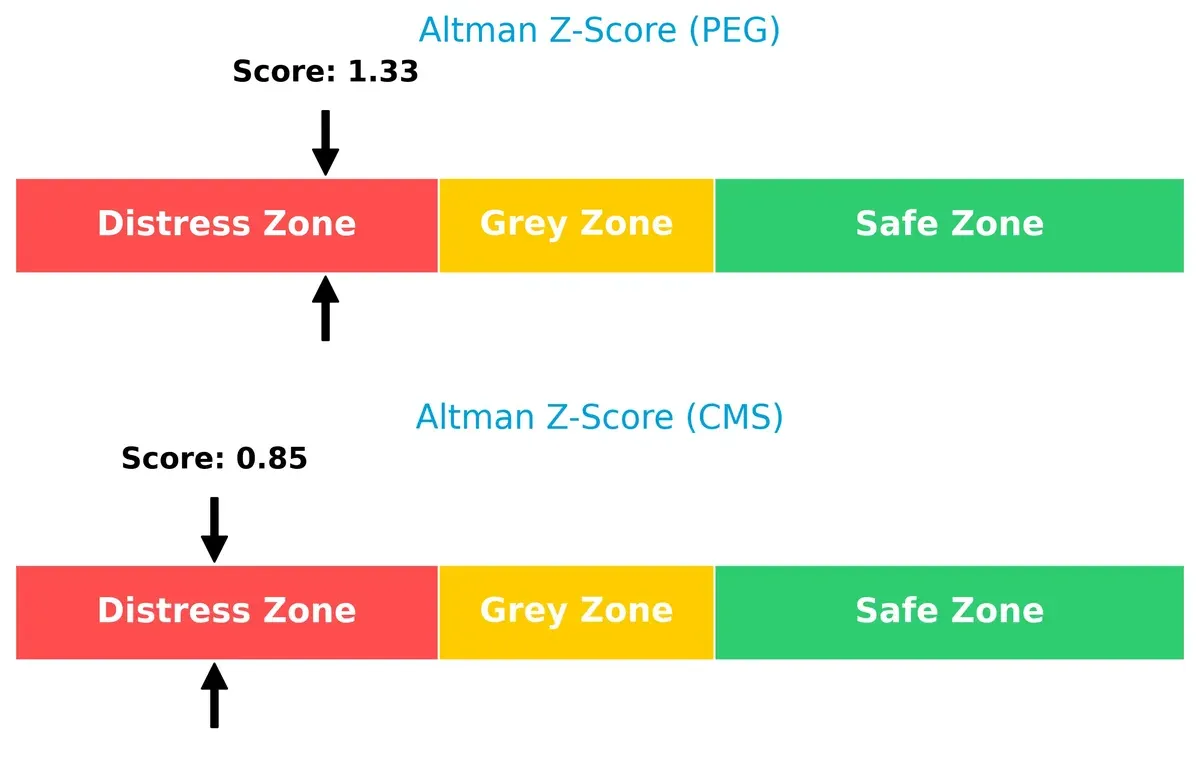
PEG’s 1.33 score edges out CMS’s 0.85, indicating PEG has marginally better solvency prospects. Still, both face significant financial strain requiring cautious risk management.
Financial Health: Quality of Operations
PEG and CMS share a strong Piotroski F-Score of 7, reflecting robust operational quality and internal financial health:
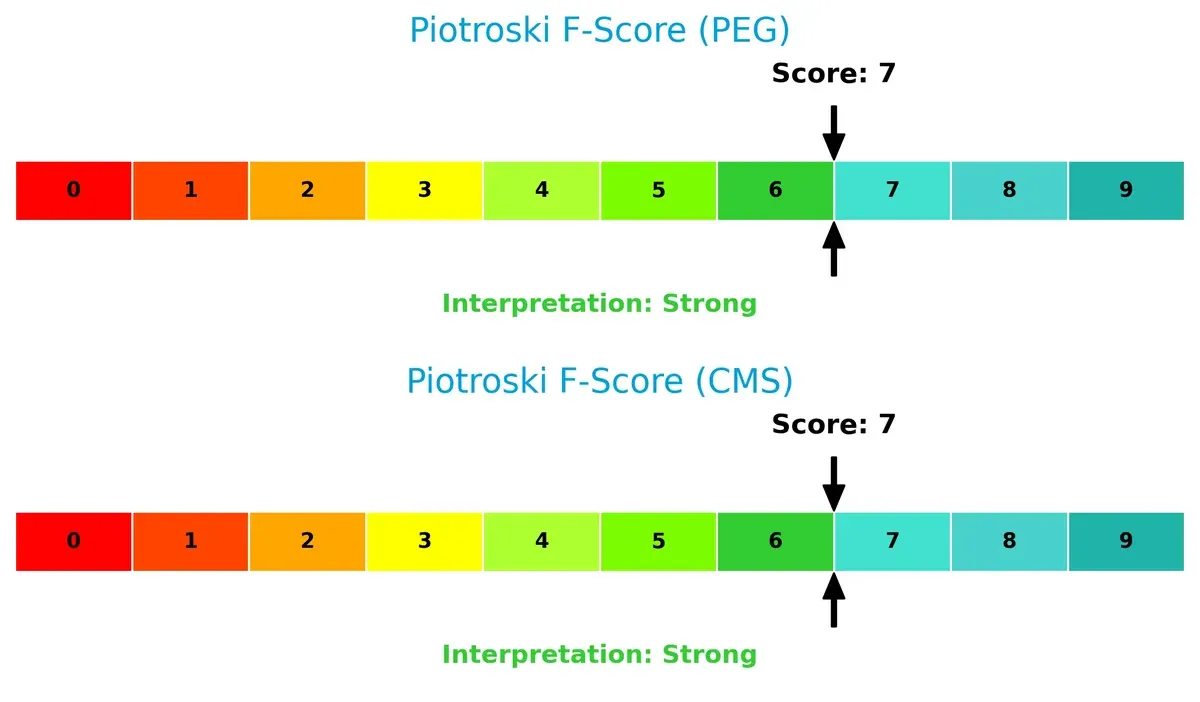
This score suggests both firms maintain solid fundamentals with no glaring red flags, despite their solvency challenges. Investors should weigh operational strength against balance sheet vulnerabilities carefully.
How are the two companies positioned?
This section dissects the operational DNA of PEG and CMS by comparing their revenue distribution and internal dynamics. The goal is to confront their economic moats and identify the more resilient competitive advantage today.
Revenue Segmentation: The Strategic Mix
This revenue comparison dissects how Public Service Enterprise Group and CMS Energy diversify income streams and reveals their primary sector bets:
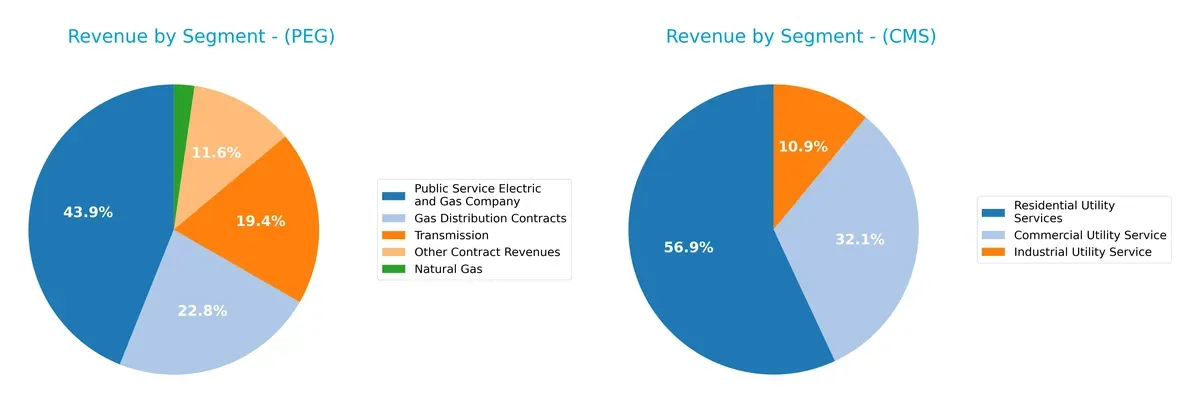
Public Service Enterprise Group anchors revenue in its Public Service Electric and Gas segment at $3.98B, supported by Gas Distribution Contracts and Transmission, showing moderate diversification. CMS Energy pivots on Residential Utility Services at $3.75B, with Commercial and Industrial Utility Services adding depth. PEG’s mix leans on infrastructure dominance, while CMS’s spread reduces concentration risk, balancing stability and growth potential.
Strengths and Weaknesses Comparison
This table compares the strengths and weaknesses of Public Service Enterprise Group Incorporated (PEG) and CMS Energy Corporation (CMS):
PEG Strengths
- Higher net margin at 17.22% indicating stronger profitability
- Favorable WACC at 5.4% supports lower capital costs
- Stable dividend yield at 2.84% appeals to income investors
- Large, diversified revenue streams including gas and electric utilities
- Neutral ROE reflects consistent equity returns
CMS Strengths
- Favorable net margin at 12.54% shows solid profitability
- Better liquidity with current and quick ratios above 1.3
- Favorable WACC at 5.02% indicates efficient capital use
- Slightly higher dividend yield at 3.1% attracts dividend investors
- Revenue diversification across commercial, industrial, and residential segments
PEG Weaknesses
- Unfavorable ROIC at 4.4% below WACC signals weak capital returns
- Low current and quick ratios raise short-term liquidity concerns
- High debt-to-equity at 1.42 signals leverage risk
- Unfavorable asset turnover ratios imply lower operational efficiency
CMS Weaknesses
- Unfavorable ROIC at 3.71% below WACC indicates poor capital efficiency
- High debt-to-equity of 2.12 increases financial risk
- Unfavorable asset turnover ratios show operational inefficiency
- Interest coverage ratio at 2.58 may limit debt servicing flexibility
PEG excels in profitability and capital cost management but struggles with liquidity and capital efficiency. CMS shows stronger liquidity and dividend appeal but faces higher leverage and weaker capital returns. Both companies need to address operational efficiency to improve long-term competitive positioning.
The Moat Duel: Analyzing Competitive Defensibility
A structural moat is the sole safeguard for long-term profits against relentless competition erosion. Here’s the moat showdown:
Public Service Enterprise Group Incorporated (PEG): Infrastructure & Regulatory Moat
PEG’s competitive edge lies in its regulated electric utility infrastructure and stable regulatory framework. This moat delivers consistent margin stability despite recent revenue declines. Expanding solar projects in 2026 could strengthen its defensibility amid energy transition pressures.
CMS Energy Corporation (CMS): Diversified Energy Mix & Operational Scale
CMS contrasts PEG with a broader fuel mix and aggressive investment in renewables. Its higher gross margin and revenue growth showcase operational leverage. However, shrinking ROIC signals profitability pressures, though new battery facilities offer growth avenues in 2026.
Infrastructure Resilience vs. Diversification Flexibility
PEG’s regulated infrastructure moat is deeper, ensuring steady returns despite short-term setbacks. CMS’s diversification offers growth but struggles with declining capital efficiency. PEG is better positioned to defend market share in a volatile energy landscape.
Which stock offers better returns?
Over the past 12 months, both stocks gained over 25%, showing strong bullish momentum with decelerating price acceleration. Recent weeks reveal slight downward trends in trading dynamics.
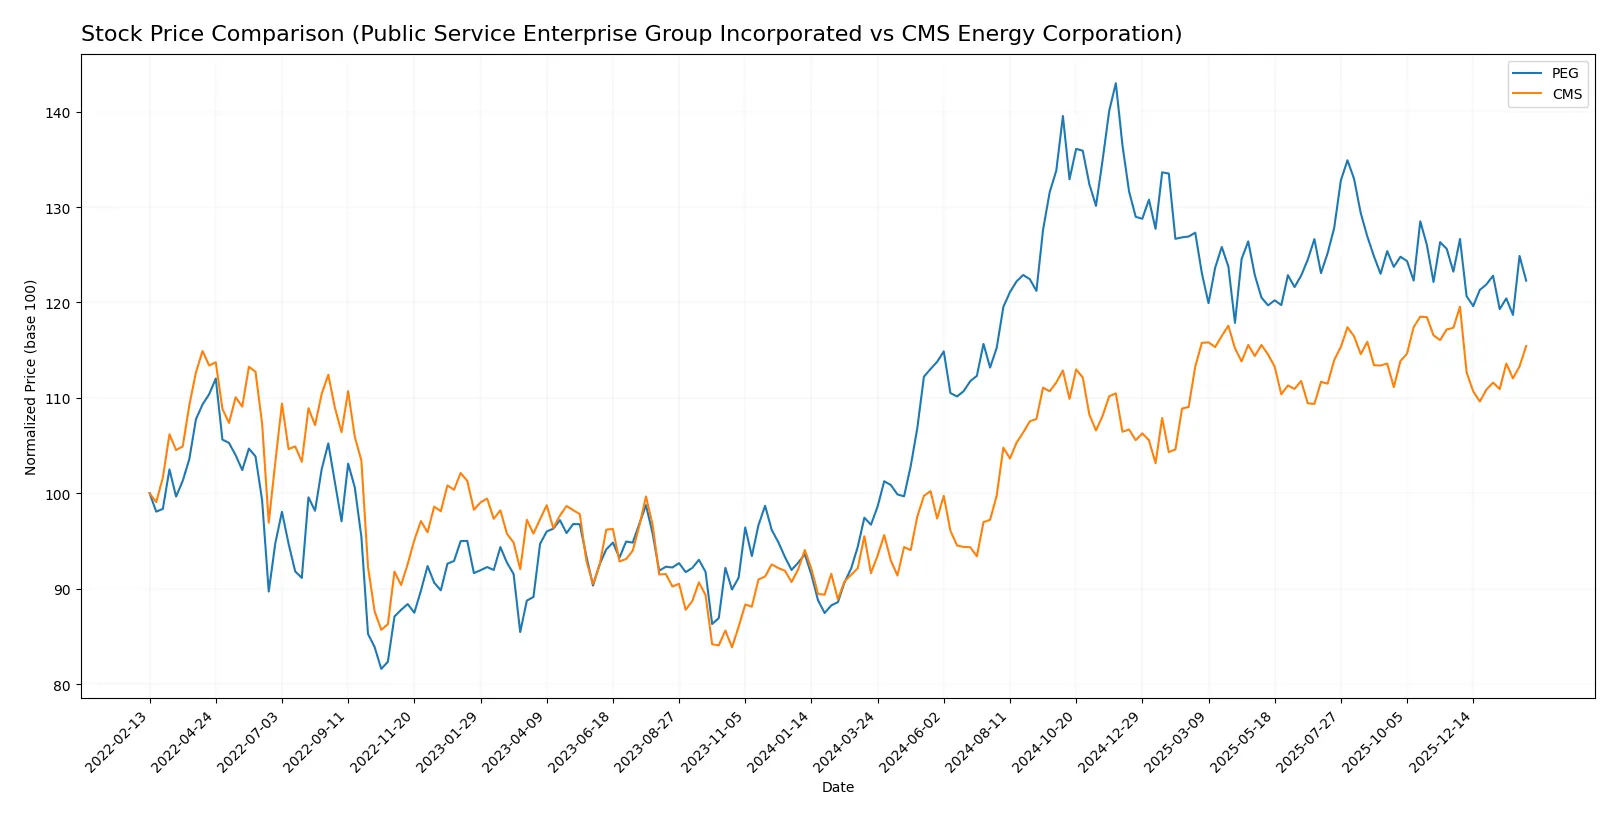
Trend Comparison
Public Service Enterprise Group’s stock gained 26.45% over 12 months, indicating a bullish trend with decelerating momentum. The price ranged from 63.78 to 94.3, showing solid appreciation.
CMS Energy’s stock rose 25.98% over the same period, also bullish with deceleration. Price fluctuated between 57.66 and 75.44, reflecting steady growth within a narrower range.
PEG slightly outperformed CMS in market returns despite both showing decelerated bullish trends, with PEG’s higher volatility and wider price range emphasizing greater price movement.
Target Prices
Analysts present a moderate upside for both Public Service Enterprise Group and CMS Energy.
| Company | Target Low | Target High | Consensus |
|---|---|---|---|
| Public Service Enterprise Group | 81 | 98 | 88.67 |
| CMS Energy Corporation | 74 | 82 | 78.14 |
The target consensus for PEG trades roughly 10% above its current price of 80.65, signaling modest growth expectations. CMS shows a similar pattern, with targets about 7% above today’s 72.84 price, reflecting cautious optimism in utilities.

Don’t Let Luck Decide Your Entry Point
Optimize your entry points with our advanced ProRealTime indicators. You’ll get efficient buy signals with precise price targets for maximum performance. Start outperforming now!
How do institutions grade them?
The following tables summarize recent institutional grades for Public Service Enterprise Group Incorporated and CMS Energy Corporation:
Public Service Enterprise Group Incorporated Grades
This table shows the latest grades from major financial institutions for PEG.
| Grading Company | Action | New Grade | Date |
|---|---|---|---|
| Barclays | Maintain | Equal Weight | 2026-01-22 |
| JP Morgan | Downgrade | Neutral | 2026-01-22 |
| Wells Fargo | Upgrade | Overweight | 2026-01-20 |
| Ladenburg Thalmann | Upgrade | Buy | 2026-01-07 |
| UBS | Maintain | Buy | 2025-12-17 |
| JP Morgan | Maintain | Overweight | 2025-12-12 |
| Jefferies | Upgrade | Buy | 2025-11-06 |
| TD Cowen | Maintain | Buy | 2025-11-05 |
| BMO Capital | Maintain | Market Perform | 2025-11-04 |
| Barclays | Maintain | Equal Weight | 2025-10-21 |
CMS Energy Corporation Grades
This table presents the latest institutional grades for CMS.
| Grading Company | Action | New Grade | Date |
|---|---|---|---|
| Mizuho | Maintain | Neutral | 2026-02-06 |
| Morgan Stanley | Maintain | Equal Weight | 2026-02-02 |
| Jefferies | Maintain | Buy | 2026-01-28 |
| Wells Fargo | Maintain | Equal Weight | 2026-01-20 |
| JP Morgan | Maintain | Overweight | 2026-01-15 |
| Jefferies | Maintain | Buy | 2026-01-15 |
| Barclays | Maintain | Overweight | 2026-01-15 |
| UBS | Maintain | Neutral | 2025-12-17 |
| JP Morgan | Maintain | Overweight | 2025-12-11 |
| Morgan Stanley | Maintain | Equal Weight | 2025-10-22 |
Which company has the best grades?
CMS Energy Corporation consistently holds higher grades such as Overweight and Buy from multiple institutions. Public Service Enterprise Group’s ratings vary more, with some downgrades to Neutral and Equal Weight. Investors may perceive CMS as having stronger institutional confidence.
Risks specific to each company
The following categories identify critical pressure points and systemic threats facing Public Service Enterprise Group Incorporated (PEG) and CMS Energy Corporation (CMS) in the 2026 market environment:
1. Market & Competition
Public Service Enterprise Group Incorporated (PEG)
- Operates mainly in Northeastern and Mid-Atlantic US with regulated electric utility focus, facing regional market saturation risks.
CMS Energy Corporation (CMS)
- Concentrated in Michigan with diversified electric and gas utility segments, exposing to state-level regulatory competition.
2. Capital Structure & Debt
Public Service Enterprise Group Incorporated (PEG)
- Debt-to-equity ratio at 1.42 signals moderate leverage but interest coverage of 3.17 provides cushion; current ratio low at 0.65 is a liquidity red flag.
CMS Energy Corporation (CMS)
- Higher debt-to-equity at 2.12 increases financial risk; interest coverage weaker at 2.58; better liquidity with current ratio at 1.34.
3. Stock Volatility
Public Service Enterprise Group Incorporated (PEG)
- Beta of 0.616 indicates moderate volatility, less sensitive to market swings, stable dividend yield at 2.84%.
CMS Energy Corporation (CMS)
- Lower beta at 0.481 signals even lower volatility, stable dividend yield slightly higher at 3.1%, appealing for risk-averse investors.
4. Regulatory & Legal
Public Service Enterprise Group Incorporated (PEG)
- Subject to complex multi-state regulatory frameworks in Northeast and Mid-Atlantic, with evolving energy policies posing compliance risk.
CMS Energy Corporation (CMS)
- Primarily regulated in Michigan, facing state-specific energy policy shifts and environmental regulations impacting operations.
5. Supply Chain & Operations
Public Service Enterprise Group Incorporated (PEG)
- Extensive electric and gas distribution infrastructure; investment in solar projects adds operational complexity but supports energy transition.
CMS Energy Corporation (CMS)
- Diverse generation mix including coal, nuclear, gas, and renewables; complex distribution network risks operational disruptions.
6. ESG & Climate Transition
Public Service Enterprise Group Incorporated (PEG)
- Investing in solar and energy efficiency programs, aligning with climate goals but requiring significant capital and regulatory support.
CMS Energy Corporation (CMS)
- Renewable energy expansion underway but reliance on coal and gas segments poses transition risks amid tightening ESG standards.
7. Geopolitical Exposure
Public Service Enterprise Group Incorporated (PEG)
- Operations concentrated in stable US regions, minimal direct geopolitical risk but sensitive to federal energy policies and tariffs.
CMS Energy Corporation (CMS)
- Similar US-focused footprint with low geopolitical risk; regional policies and economic conditions in Michigan carry localized impact.
Which company shows a better risk-adjusted profile?
PEG’s biggest risk is its weak liquidity and moderate leverage, raising short-term financial vulnerability. CMS faces higher financial risk from elevated debt but compensates with stronger liquidity and lower stock volatility. Both exhibit distress-level Altman Z-scores, signaling financial fragility. I see CMS’s better liquidity and lower beta as advantages, but PEG’s diversified regulatory exposure and ongoing solar investments offer strategic resilience. Recent ratio trends confirm CMS’s debt load as a pressing concern, while PEG’s low current ratio demands caution. Overall, CMS edges out PEG in risk-adjusted stability, yet both require careful monitoring amid sector headwinds.
Final Verdict: Which stock to choose?
Public Service Enterprise Group (PEG) wields a superpower in operational scale and dividend reliability, making it a dependable cash generator. However, its stretched liquidity and below-cost-of-capital returns warrant vigilance. PEG suits investors who tolerate moderate risk for stable income and steady growth.
CMS Energy Corporation (CMS) builds its moat on robust gross margins and a healthier liquidity position, offering a more balanced safety profile than PEG. Its operational improvement and strong cash flow generation appeal to those seeking Growth at a Reasonable Price (GARP) with moderate stability.
If you prioritize consistent income and a proven dividend track record, PEG is the compelling choice despite its financial leverage and value destruction signals. However, if you seek improved profitability and stronger liquidity with growth potential, CMS offers better stability and operational efficiency. Both present analytical scenarios with distinct risk profiles for portfolio construction.
Disclaimer: Investment carries a risk of loss of initial capital. The past performance is not a reliable indicator of future results. Be sure to understand risks before making an investment decision.
Go Further
I encourage you to read the complete analyses of Public Service Enterprise Group Incorporated and CMS Energy Corporation to enhance your investment decisions: