Home > Comparison > Utilities > PPL vs CMS
The strategic rivalry between PPL Corporation and CMS Energy Corporation shapes the dynamics of the regulated electric sector. PPL operates as a utility holding company focusing on electricity and natural gas delivery across multiple states, while CMS Energy manages an integrated utility system emphasizing diverse energy sources and customer segments. This battle highlights contrasting operational scales and growth strategies. This analysis aims to identify which company presents a superior risk-adjusted profile for a balanced investment portfolio.
Table of contents
Companies Overview
PPL Corporation and CMS Energy Corporation both play pivotal roles in the regulated electric utility market in the United States.
PPL Corporation: Regional Electric Power Provider
PPL Corporation stands as a regulated electric utility serving about 2.7M customers across Kentucky, Pennsylvania, and Virginia. Its core revenue derives from electricity and natural gas distribution, supplemented by power generation from coal, gas, hydro, and solar. In 2026, PPL emphasizes operational efficiency and renewable integration within its Kentucky and Pennsylvania regulated segments.
CMS Energy Corporation: Diversified Energy Utility Leader
CMS Energy Corporation operates primarily in Michigan, serving nearly 3.7M electricity and gas customers. It generates revenue through electric and gas utility segments plus independent power production, leveraging diverse fuel sources including nuclear and renewables. CMS focuses on expanding its renewable portfolio and upgrading infrastructure in 2026 to improve reliability and sustainability.
Strategic Collision: Similarities & Divergences
Both companies anchor their business models in regulated utility operations but diverge in geographic scope and fuel mix diversity. PPL leans on a regional approach with strong natural gas and solar assets, while CMS pursues a broader multi-segment strategy integrating nuclear and renewables. Their primary battleground is customer retention amid a transition to cleaner energy. PPL offers a more concentrated investment profile; CMS presents diversified growth opportunities.
Income Statement Comparison
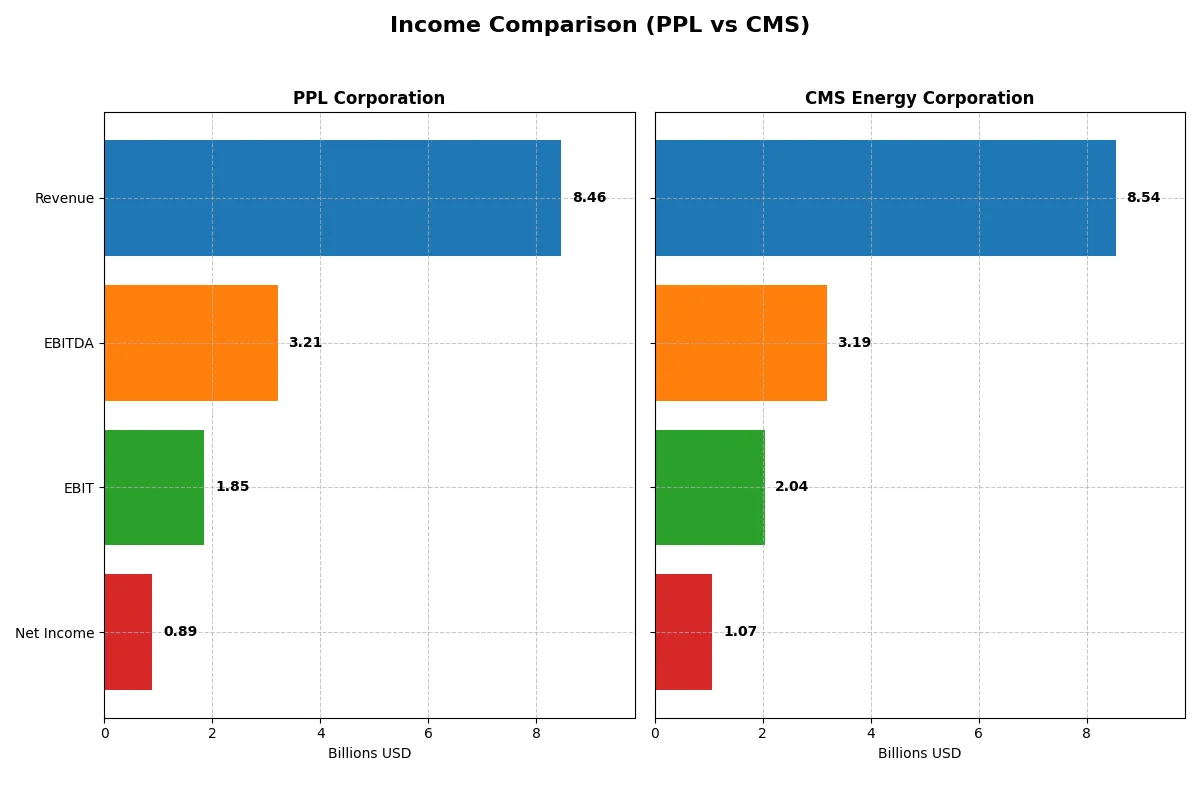
This data dissects the core profitability and scalability of both corporate engines to reveal who dominates the bottom line:
| Metric | PPL Corporation (PPL) | CMS Energy Corporation (CMS) |
|---|---|---|
| Revenue | 8.46B | 7.52B |
| Cost of Revenue | 5.07B | 4.31B |
| Operating Expenses | 1.65B | 1.72B |
| Gross Profit | 3.39B | 3.21B |
| EBITDA | 3.21B | 3.07B |
| EBIT | 1.85B | 1.83B |
| Interest Expense | 738M | 708M |
| Net Income | 888M | 1.00B |
| EPS | 1.20 | 3.34 |
| Fiscal Year | 2024 | 2024 |
Income Statement Analysis: The Bottom-Line Duel
This income statement comparison reveals which company runs its corporate engine more efficiently through revenue and profit dynamics.
PPL Corporation Analysis
PPL’s revenue climbed steadily from 5.5B in 2020 to 8.5B in 2024, reflecting solid top-line growth. Net income fluctuated, peaking at 1.47B in 2020 but declining to 886M in 2024, showing volatility. Margins improved; gross margin held firm around 40%, while net margin rose to 10.5%, signaling healthier profitability and better cost control by 2024.
CMS Energy Corporation Analysis
CMS posted robust revenue growth, jumping from 7.3B in 2021 to 8.5B in 2025, with a 13.6% increase in the latest year. Gross margin dominated at 61%, well above PPL, while net margin settled at 12.5%. Despite strong revenue and EBIT gains, net margin slightly contracted recently, hinting at rising operational costs impacting bottom-line momentum.
Margin Strength vs. Revenue Growth Momentum
CMS outperforms PPL in gross and net margins, showcasing superior profitability and operational leverage. PPL demonstrates steadier revenue expansion but with more volatile net income and lower margins. For investors prioritizing margin power and consistent profit conversion, CMS’s profile appears more attractive despite its recent margin pressure.
Financial Ratios Comparison
These vital ratios act as a diagnostic tool to expose the underlying fiscal health, valuation premiums, and capital efficiency of the companies compared below:
| Ratios | PPL Corporation (PPL) | CMS Energy Corporation (CMS) |
|---|---|---|
| ROE | 6.3% | 12.0% |
| ROIC | 3.6% | 3.7% |
| P/E | 27.0 | 19.5 |
| P/B | 1.70 | 2.34 |
| Current Ratio | 0.86 | 1.34 |
| Quick Ratio | 0.71 | 1.34 |
| D/E | 1.19 | 2.12 |
| Debt-to-Assets | 41% | 47% |
| Interest Coverage | 2.36 | 2.19 |
| Asset Turnover | 0.21 | 0.21 |
| Fixed Asset Turnover | 0.26 | 0.28 |
| Payout ratio | 84.1% | 60.5% |
| Dividend yield | 3.12% | 3.10% |
| Fiscal Year | 2024 | 2025 |
Efficiency & Valuation Duel: The Vital Signs
Financial ratios serve as a company’s DNA, uncovering hidden risks and revealing operational strengths essential for investors.
PPL Corporation
PPL’s profitability shows a modest 6.3% ROE and a solid net margin of 10.5%, but its 27 P/E signals an expensive valuation. The firm delivers a 3.1% dividend yield, rewarding shareholders despite weak returns on invested capital and low liquidity ratios, suggesting cautious capital allocation amid operational challenges.
CMS Energy Corporation
CMS outperforms with a 12% ROE and a stronger 12.5% net margin, paired with a more reasonable 19.5 P/E ratio. The company maintains a 3.1% dividend yield and healthier liquidity, balancing moderate leverage and operational effectiveness, though higher debt levels temper its financial safety profile.
Balanced Yield and Operational Efficiency
CMS offers a superior combination of profitability and valuation compared to PPL, with fewer unfavorable ratios and stronger liquidity. Investors prioritizing steady returns and operational resilience may find CMS’s profile more aligned with their risk-reward expectations.
Which one offers the Superior Shareholder Reward?
I compare PPL Corporation and CMS Energy Corporation on dividends, buybacks, and sustainability. PPL yields 3.12% with a payout ratio near 84%, but free cash flow is negative, signaling risk. CMS yields slightly less at 3.10% with a 60% payout ratio and strong free cash flow of 7.5B, funding sustainable dividends and buybacks. CMS’s capital allocation appears more balanced, supporting long-term value. I see CMS offering a more attractive total return profile for 2026 investors due to healthier cash flow and prudent payout.
Comparative Score Analysis: The Strategic Profile
The radar chart reveals the fundamental DNA and trade-offs of both firms, highlighting their strengths and vulnerabilities across key financial metrics:
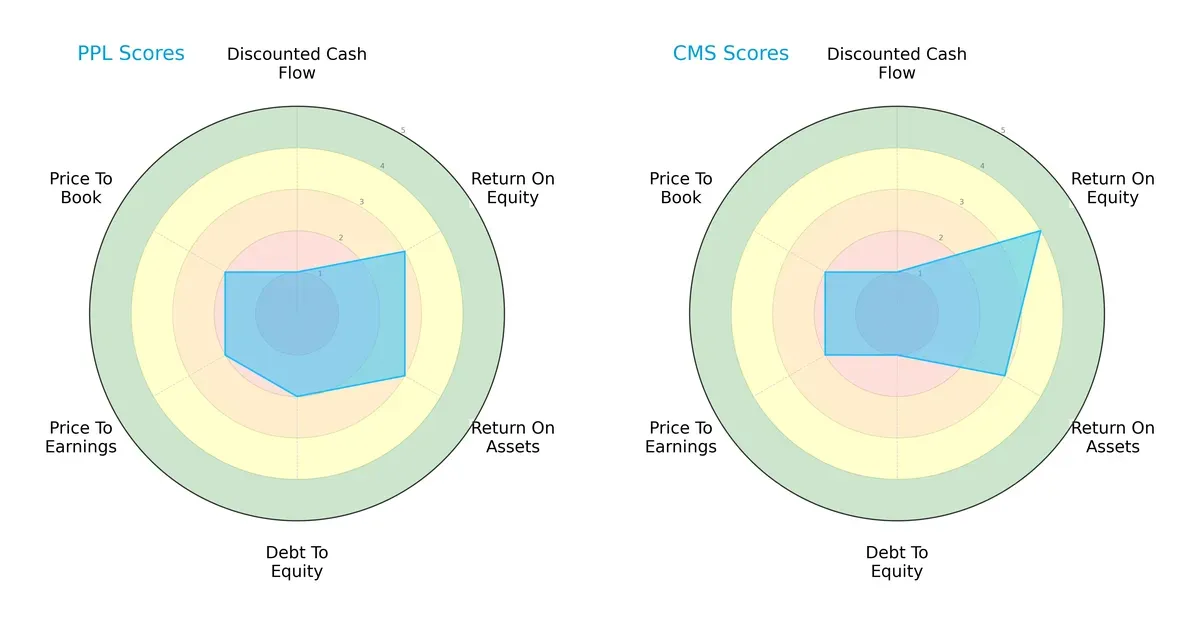
I observe that CMS leads with a stronger ROE score (4 vs. 3 for PPL), signaling better shareholder profitability. Both show moderate ROA scores (3 each), but PPL holds a slight edge in debt management (debt-to-equity score of 2 vs. 1, where 1 is worse). Valuation metrics (P/E and P/B) are equally unfavorable for both, reflecting potential market skepticism. Overall, CMS relies on operational efficiency, while PPL maintains a more balanced but weaker financial profile.
Bankruptcy Risk: Solvency Showdown
The Altman Z-Scores place both companies in the distress zone, indicating significant bankruptcy risk in this cycle:

PPL’s score of 0.97 slightly surpasses CMS’s 0.85, but both remain well below the 1.8 threshold. This signals heightened vulnerability to financial distress, warranting cautious exposure in portfolios sensitive to credit risk.
Financial Health: Quality of Operations
CMS outperforms PPL in the Piotroski F-Score, evidencing stronger internal financial health and operational quality:
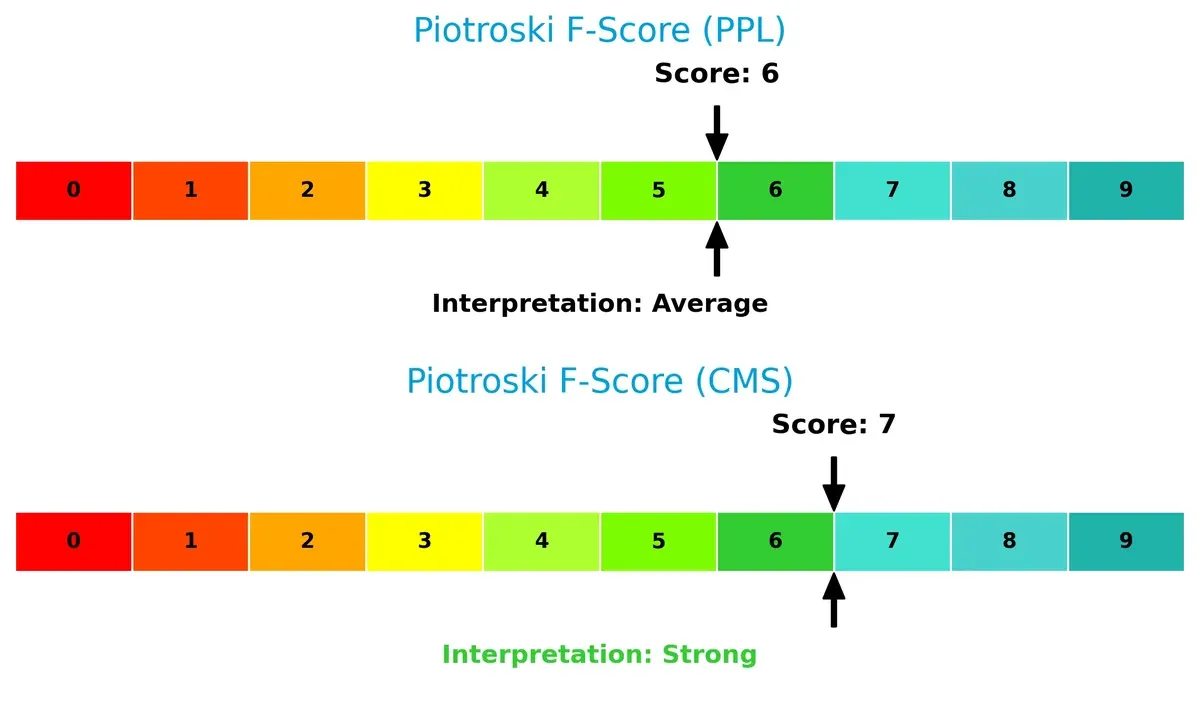
CMS scores a 7, categorized as strong, while PPL’s 6 is average. This gap suggests CMS manages profitability, leverage, and liquidity more effectively, while PPL shows some red flags that investors must monitor closely.
How are the two companies positioned?
This section dissects PPL and CMS’s operational DNA by comparing revenue distribution and internal dynamics—strengths and weaknesses. The goal is to confront their economic moats and identify the most resilient, sustainable competitive advantage today.
Revenue Segmentation: The Strategic Mix
This visual comparison dissects how PPL Corporation and CMS Energy Corporation diversify their income streams and reveals where their primary sector bets lie:
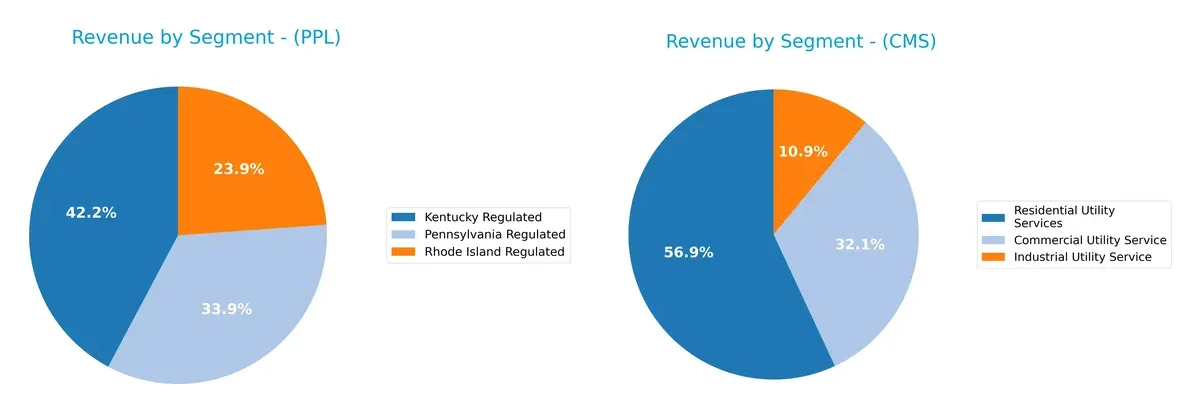
PPL leans heavily on its Kentucky Regulated segment, generating $3.58B in 2024, dwarfing Rhode Island ($2.02B) and Pennsylvania ($2.88B). This concentration signals dependency on regulated utilities, anchoring stable cash flows but raising geographic risk. CMS shows a more balanced mix: Residential Utility Services lead with $3.75B, complemented by Commercial ($2.11B) and Industrial ($720M) segments. CMS’s diversified customer base reduces concentration risk and strengthens ecosystem lock-in across utility sectors.
Strengths and Weaknesses Comparison
This table compares the strengths and weaknesses of PPL Corporation and CMS Energy Corporation:
PPL Strengths
- Diverse regional revenue from Rhode Island, Kentucky, Pennsylvania
- Favorable net margin at 10.49%
- WACC lower than ROIC, signaling capital efficiency
- Dividend yield of 3.12% supports shareholder returns
CMS Strengths
- Higher net margin at 12.54% indicates strong profitability
- Better current and quick ratios show stronger liquidity
- WACC at 5.02% supports efficient capital costs
- Neutral P/E at 19.49 suggests reasonable valuation
- Dividend yield at 3.1% aligns with income investors
PPL Weaknesses
- ROE at 6.31% and ROIC at 3.59% below WACC, signaling poor capital returns
- Weak liquidity ratios (current 0.86, quick 0.71) pose short-term risk
- Debt-to-equity ratio at 1.19 indicates higher leverage concerns
- Asset turnover low at 0.21, reflecting less efficient asset use
- P/E high at 26.97 may imply overvaluation
CMS Weaknesses
- Debt-to-equity high at 2.12 raises leverage risk
- ROIC at 3.71% below WACC, limiting value creation
- Asset turnover also low at 0.21, asset efficiency is weak
- Neutral ROE at 12.01% does not strongly signal value generation
Both companies show strengths in net margins and dividend yields, but PPL struggles with capital returns and liquidity. CMS boasts better profitability and liquidity metrics but faces leverage and asset efficiency challenges. These factors will shape their strategic focus on improving capital allocation and operational efficiency.
The Moat Duel: Analyzing Competitive Defensibility
A structural moat is the only reliable barrier protecting long-term profits from relentless competitive erosion:
PPL Corporation: Regulated Utility with Geographic Diversification
PPL’s moat stems from regulated market access in Kentucky and Pennsylvania, yielding stable margins and improving ROIC despite shedding value. Expansion in renewable generation could deepen its moat in 2026.
CMS Energy Corporation: Integrated Utility with Operational Scale
CMS leverages a broad customer base and diverse energy sources, driving superior margins but declining ROIC. Its scale and investment in renewables offer growth potential, though profitability faces pressure compared to PPL.
Regulated Market Access vs. Operational Scale: Which Moat Holds Stronger?
Both firms struggle to exceed WACC, signaling value erosion. However, PPL’s growing ROIC trend contrasts CMS’s decline, indicating a slightly wider moat. PPL is better positioned to defend market share amid regulatory and energy transitions.
Which stock offers better returns?
Both PPL Corporation and CMS Energy Corporation show significant price gains over the past year, with PPL exhibiting a stronger overall rise but recent signs of trend deceleration in both stocks.
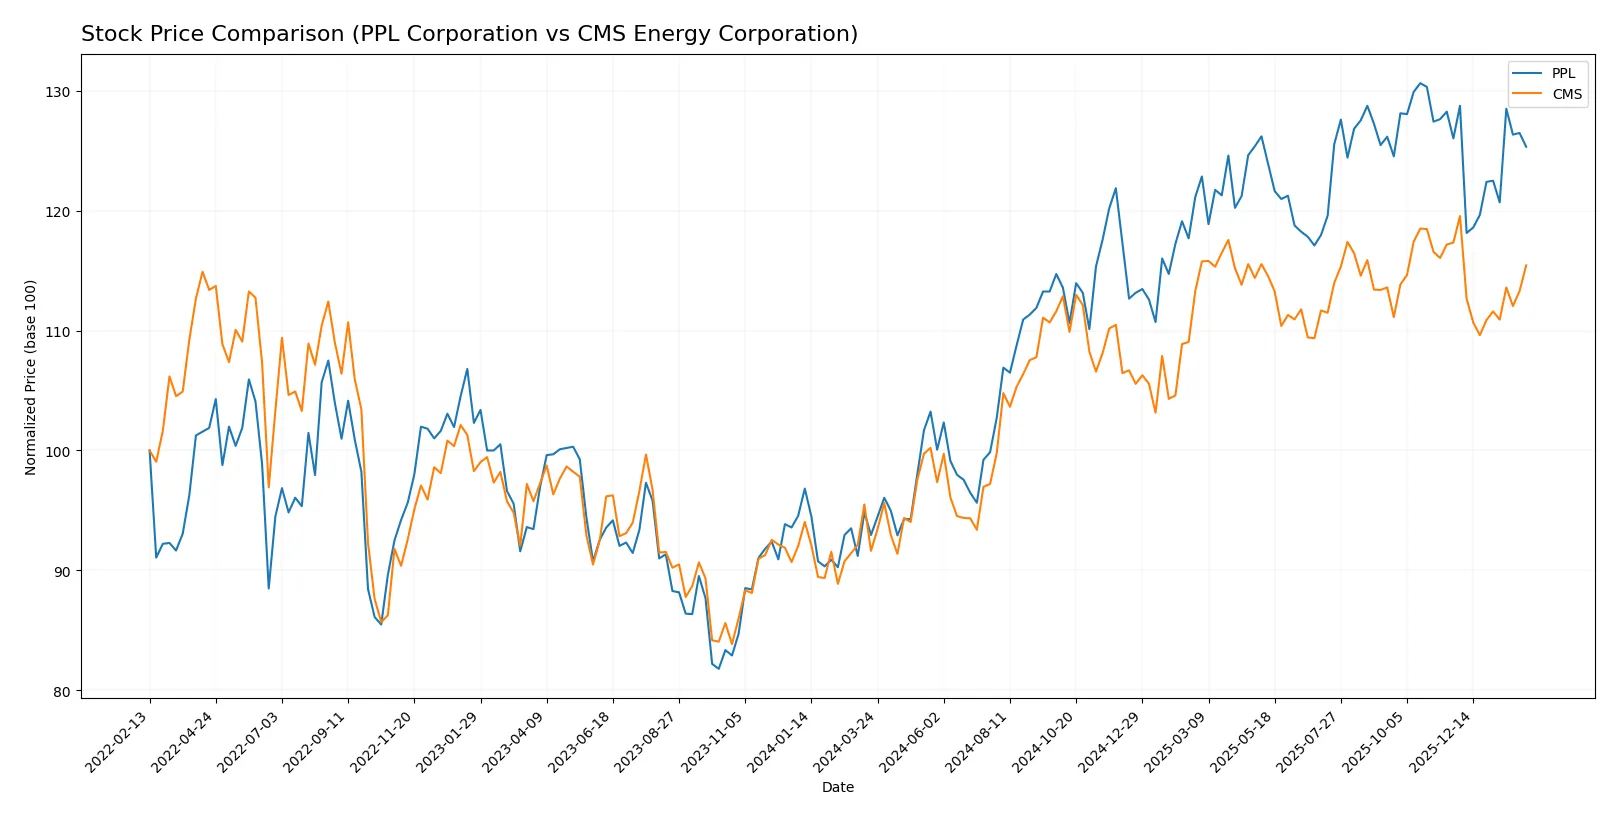
Trend Comparison
PPL Corporation’s stock rose 34.83% over the past 12 months, signaling a bullish trend with decelerating momentum. The stock fluctuated between 26.63 and 37.44, reflecting moderate volatility (3.06 std dev).
CMS Energy Corporation’s stock gained 25.98% in the same period, also bullish but with decelerating acceleration. It traded within 57.66 to 75.44, showing higher volatility (4.7 std dev).
Comparing the two, PPL outperformed CMS with a higher total price increase, despite both showing slowing upward momentum in recent months.
Target Prices
Analysts show a clear consensus on target prices for PPL Corporation and CMS Energy Corporation.
| Company | Target Low | Target High | Consensus |
|---|---|---|---|
| PPL Corporation | 36 | 44 | 40.29 |
| CMS Energy Corporation | 74 | 82 | 78.14 |
The target consensus for PPL stands about 12% above the current price of $35.92, indicating moderate upside potential. CMS’s consensus target exceeds its current price of $72.84 by roughly 7%, signaling cautious optimism among analysts.

Don’t Let Luck Decide Your Entry Point
Optimize your entry points with our advanced ProRealTime indicators. You’ll get efficient buy signals with precise price targets for maximum performance. Start outperforming now!
How do institutions grade them?
The following shows the latest grades given by major financial institutions to PPL Corporation and CMS Energy Corporation:
PPL Corporation Grades
This table summarizes recent grades issued by reputable financial firms for PPL Corporation.
| Grading Company | Action | New Grade | Date |
|---|---|---|---|
| Barclays | Maintain | Equal Weight | 2026-01-22 |
| Wells Fargo | Maintain | Overweight | 2026-01-20 |
| UBS | Maintain | Neutral | 2025-12-17 |
| Wells Fargo | Maintain | Overweight | 2025-12-12 |
| JP Morgan | Maintain | Overweight | 2025-12-11 |
| BMO Capital | Maintain | Outperform | 2025-10-21 |
| B of A Securities | Maintain | Buy | 2025-10-16 |
| Barclays | Maintain | Equal Weight | 2025-10-14 |
| UBS | Maintain | Neutral | 2025-10-10 |
| Morgan Stanley | Maintain | Overweight | 2025-09-25 |
CMS Energy Corporation Grades
Below are recent grades from established financial institutions on CMS Energy Corporation.
| Grading Company | Action | New Grade | Date |
|---|---|---|---|
| Mizuho | Maintain | Neutral | 2026-02-06 |
| Morgan Stanley | Maintain | Equal Weight | 2026-02-02 |
| Jefferies | Maintain | Buy | 2026-01-28 |
| Wells Fargo | Maintain | Equal Weight | 2026-01-20 |
| JP Morgan | Maintain | Overweight | 2026-01-15 |
| Jefferies | Maintain | Buy | 2026-01-15 |
| Barclays | Maintain | Overweight | 2026-01-15 |
| UBS | Maintain | Neutral | 2025-12-17 |
| JP Morgan | Maintain | Overweight | 2025-12-11 |
| Morgan Stanley | Maintain | Equal Weight | 2025-10-22 |
Which company has the best grades?
CMS Energy Corporation generally receives higher grades, including multiple “Buy” and “Overweight” ratings. PPL Corporation shows more “Neutral” and “Equal Weight” grades. This difference may influence investor confidence and portfolio weighting decisions.
Risks specific to each company
The following categories identify critical pressure points and systemic threats facing PPL Corporation and CMS Energy Corporation in the 2026 market environment:
1. Market & Competition
PPL Corporation
- Faces pressure from regulated markets in Kentucky and Pennsylvania with limited growth potential.
CMS Energy Corporation
- Operates in Michigan with diversified energy sources, facing moderate regional competition.
2. Capital Structure & Debt
PPL Corporation
- Debt-to-equity ratio of 1.19 signals moderate leverage; interest coverage at 2.51x is neutral but watch liquidity risks.
CMS Energy Corporation
- Higher leverage with debt-to-equity of 2.12 and similar interest coverage (2.58x), indicating elevated financial risk.
3. Stock Volatility
PPL Corporation
- Beta of 0.72 shows moderate stock volatility, less sensitive to market swings.
CMS Energy Corporation
- Lower beta of 0.48 indicates more defensive stock behavior amid market fluctuations.
4. Regulatory & Legal
PPL Corporation
- Subject to US and UK regulations; risks from evolving energy policies and cross-border compliance.
CMS Energy Corporation
- Primarily US-regulated, focused on Michigan; faces regulatory risks tied to state energy mandates and renewables.
5. Supply Chain & Operations
PPL Corporation
- Relies on coal, gas, hydro, and solar; operational risks from fuel diversity and aging infrastructure.
CMS Energy Corporation
- Diverse generation including nuclear and renewables; larger scale infrastructure offers operational resilience but complexity.
6. ESG & Climate Transition
PPL Corporation
- Coal dependency poses transition risk; solar and hydro investments partially mitigate ESG concerns.
CMS Energy Corporation
- Stronger push toward renewables and nuclear; better positioned for climate transition regulatory expectations.
7. Geopolitical Exposure
PPL Corporation
- Exposure to UK energy market adds geopolitical uncertainty and currency risks.
CMS Energy Corporation
- Operations concentrated in Michigan, limiting geopolitical risk but increasing regional policy dependence.
Which company shows a better risk-adjusted profile?
CMS Energy faces its largest risk in elevated financial leverage, threatening solvency during downturns. PPL’s critical risk is its weak liquidity and low Altman Z-Score, signaling distress. Despite CMS’s higher debt, its stronger Piotroski score and diversified energy mix give it a marginally better risk-adjusted profile. Notably, PPL’s liquidity ratios under 1.0 raise serious short-term financial concerns that investors must monitor closely.
Final Verdict: Which stock to choose?
PPL Corporation’s superpower lies in its improving profitability amidst challenging capital efficiency. Its modest ROIC improvement hints at operational resilience. However, its weak liquidity ratios signal a point of vigilance, demanding close monitoring. PPL fits an aggressive growth portfolio willing to ride transitional phases.
CMS Energy Corporation boasts a strategic moat rooted in its robust gross margins and higher return on equity. It offers more stable liquidity and a stronger free cash flow yield than PPL. CMS suits a GARP (Growth at a Reasonable Price) portfolio seeking steady income with moderate growth potential.
If you prioritize operational turnaround and growth potential, PPL emerges as a compelling choice due to its improving profitability momentum despite capital challenges. However, if you seek better stability and recurring revenue strength, CMS outshines with a stronger moat and healthier cash flows, albeit at a premium valuation. Both carry risks tied to capital structure and market cycles.
Disclaimer: Investment carries a risk of loss of initial capital. The past performance is not a reliable indicator of future results. Be sure to understand risks before making an investment decision.
Go Further
I encourage you to read the complete analyses of PPL Corporation and CMS Energy Corporation to enhance your investment decisions: