Home > Comparison > Utilities > CMS vs PNW
The strategic rivalry between CMS Energy Corporation and Pinnacle West Capital Corporation shapes the Utilities sector’s evolution in the U.S. CMS operates a diversified electric and gas utility model across Michigan, blending traditional and renewable power assets. Pinnacle West focuses on regulated electric services in Arizona, emphasizing a streamlined generation and distribution network. This analysis contrasts their operational footprints to identify which offers a superior risk-adjusted return for a balanced portfolio in a capital-intensive industry.
Table of contents
Companies Overview
CMS Energy Corporation and Pinnacle West Capital Corporation stand as key players in the regulated electric utility market.
CMS Energy Corporation: Multi-Source Energy Provider in Michigan
CMS Energy commands a strong market position in Michigan’s regulated electric and gas sectors. Its core revenue derives from electric generation, transmission, and distribution supported by diverse fuel sources including coal, wind, gas, oil, nuclear, and renewables. In 2026, CMS emphasizes expanding renewable energy projects and enhancing infrastructure across its 1.9M electric and 1.8M gas customer base.
Pinnacle West Capital Corporation: Arizona’s Integrated Power Supplier
Pinnacle West Capital drives its business through retail and wholesale electric services, primarily in Arizona. It generates revenue from coal, nuclear, gas, oil, and solar power distributed via an extensive transmission and distribution network. The company’s 2026 strategic focus centers on maintaining regulated generation capacity of 6,323 MW and optimizing its blend of traditional and solar energy to serve 1.3M customers reliably.
Strategic Collision: Similarities & Divergences
Both companies operate in regulated electric utilities with diversified generation portfolios spanning fossil fuels and renewables. CMS leans more on gas and renewables while Pinnacle West integrates a significant solar component. Their battleground is infrastructure modernization and clean energy transition in distinct regional markets. CMS offers broader utility services including gas; Pinnacle West’s investment profile is more concentrated on electric generation capacity and solar expansion.
Income Statement Comparison
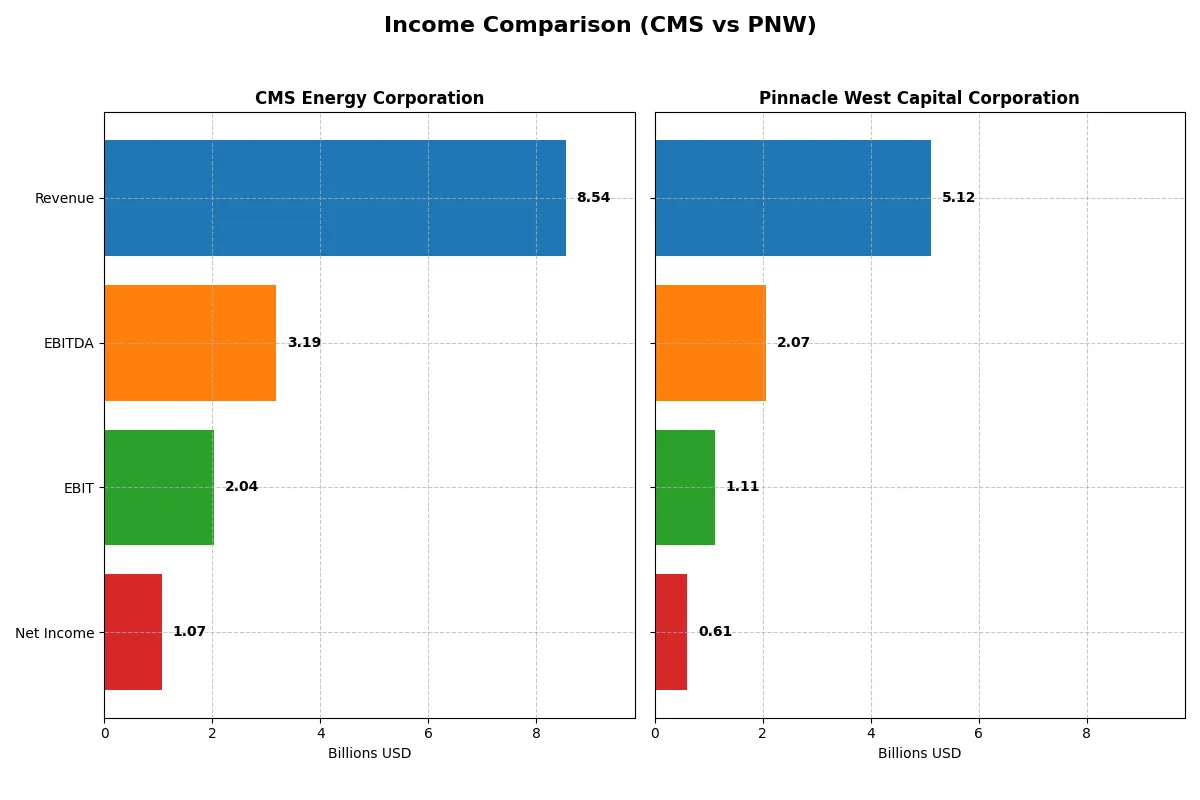
The following data dissects the core profitability and scalability of both corporate engines to reveal who dominates the bottom line:
| Metric | CMS Energy Corporation (CMS) | Pinnacle West Capital Corporation (PNW) |
|---|---|---|
| Revenue | 8.54B | 5.12B |
| Cost of Revenue | 3.34B | 2.99B |
| Operating Expenses | 3.47B | 1.13B |
| Gross Profit | 5.20B | 2.14B |
| EBITDA | 3.19B | 2.07B |
| EBIT | 2.04B | 1.11B |
| Interest Expense | 789M | 377M |
| Net Income | 1.07B | 609M |
| EPS | 3.53 | 5.35 |
| Fiscal Year | 2025 | 2024 |
Income Statement Analysis: The Bottom-Line Duel
This income statement comparison reveals which company operates with greater efficiency and momentum in generating profits from revenues.
CMS Energy Corporation Analysis
CMS shows a strong revenue rebound to $8.54B in 2025, up 13.6% from 2024, with net income reaching $1.07B. Gross margin climbs to a robust 60.9%, signaling improving core profitability. Despite operating expenses growing in line with revenue, CMS’s EBIT margin remains favorable at 23.9%, reflecting efficient cost control and solid earnings momentum in the latest year.
Pinnacle West Capital Corporation Analysis
PNW posts a steady revenue increase to $5.12B in 2024, up 9.1% year-over-year, with net income rising to $609M. Gross margin stands at 41.7%, lower than CMS but still healthy. EBIT margin at 21.7% improves with 20.2% EBIT growth, driven by disciplined expense management. Net margin growth of 11.2% and EPS growth near 19% highlight accelerating profitability and operational efficiency.
Margin Strength vs. Growth Momentum
CMS dominates in gross and net margins, showcasing superior profitability efficiency with a 60.9% gross margin and 12.5% net margin in 2025. PNW, however, delivers stronger top-line and bottom-line growth rates, with net income up 10.6% over five years and EPS growth of 7.6%. Investors favor CMS for margin stability, while PNW appeals to those prioritizing growth momentum.
Financial Ratios Comparison
These vital ratios act as a diagnostic tool to expose the underlying fiscal health, valuation premiums, and capital efficiency of the companies analyzed:
| Ratios | CMS Energy Corporation (CMS) | Pinnacle West Capital Corporation (PNW) |
|---|---|---|
| ROE | 12.0% | 9.0% |
| ROIC | 3.7% | 3.5% |
| P/E | 19.5 | 15.9 |
| P/B | 2.34 | 1.43 |
| Current Ratio | 1.34 | 0.59 |
| Quick Ratio | 1.34 | 0.42 |
| D/E | 2.12 | 1.64 |
| Debt-to-Assets | 47.3% | 42.3% |
| Interest Coverage | 2.19 | 2.68 |
| Asset Turnover | 0.21 | 0.20 |
| Fixed Asset Turnover | 0.28 | 0.25 |
| Payout ratio | 60.5% | 64.8% |
| Dividend yield | 3.10% | 4.09% |
| Fiscal Year | 2025 | 2024 |
Efficiency & Valuation Duel: The Vital Signs
Ratios act as a company’s DNA, revealing hidden risks and operational excellence that shape investment decisions.
CMS Energy Corporation
CMS posts a solid net margin of 12.54% and a neutral ROE at 12.01%, showing stable profitability. Its P/E ratio of 19.49 suggests the stock trades at fair value, neither cheap nor stretched. The 3.1% dividend yield offers steady shareholder returns, reflecting a balanced capital allocation approach.
Pinnacle West Capital Corporation
PNW delivers a favorable net margin of 11.88%, but a weaker ROE at 9.01% signals less efficiency in generating equity returns. Its P/E of 15.85 appears reasonable, possibly undervalued relative to CMS. PNW’s higher 4.09% dividend yield compensates investors, despite some liquidity concerns and elevated leverage ratios.
Balanced Profitability Versus Yield Appeal
CMS shows a healthier return on equity and a neutral valuation, balancing operational efficiency with shareholder rewards. PNW offers a higher dividend yield but suffers from weaker profitability and liquidity ratios. CMS fits investors prioritizing operational stability, while PNW appeals to those seeking yield with greater risk tolerance.
Which one offers the Superior Shareholder Reward?
I compare CMS Energy Corporation (CMS) and Pinnacle West Capital Corporation (PNW) on dividends and buybacks. CMS yields ~3.1% with a payout ratio around 60%. Its free cash flow comfortably covers dividends, signaling sustainability. CMS lacks recent buyback intensity, focusing on dividend reliability. PNW offers a higher yield near 4.1%, but with a payout ratio exceeding 65%, pressuring cash flow given negative free cash flow per share. PNW’s buybacks are modest but add some total return. CMS’s distribution model balances yield and cash flow better. I conclude CMS delivers a more sustainable and attractive total shareholder reward in 2026.
Comparative Score Analysis: The Strategic Profile
The radar chart reveals the fundamental DNA and trade-offs of CMS Energy Corporation and Pinnacle West Capital Corporation, highlighting their strategic financial profiles:
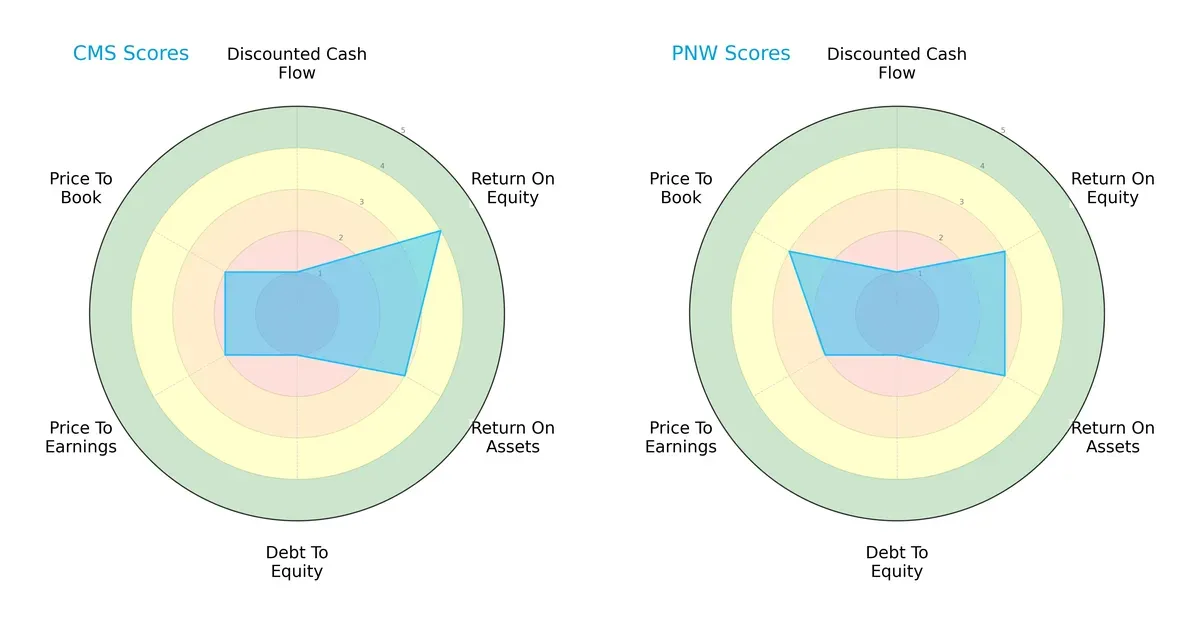
CMS shows strength in Return on Equity (4 vs. 3) and moderate Return on Assets (3 each), indicating efficient profit generation and asset use. Pinnacle West edges out CMS slightly in Price-to-Book valuation (3 vs. 2), suggesting a marginally better market valuation relative to book value. Both firms share very unfavorable Debt-to-Equity and Discounted Cash Flow scores (1 each), signaling financial risk and valuation concerns. Overall, CMS has a more balanced performance in profitability metrics, while Pinnacle West leans on valuation strength.
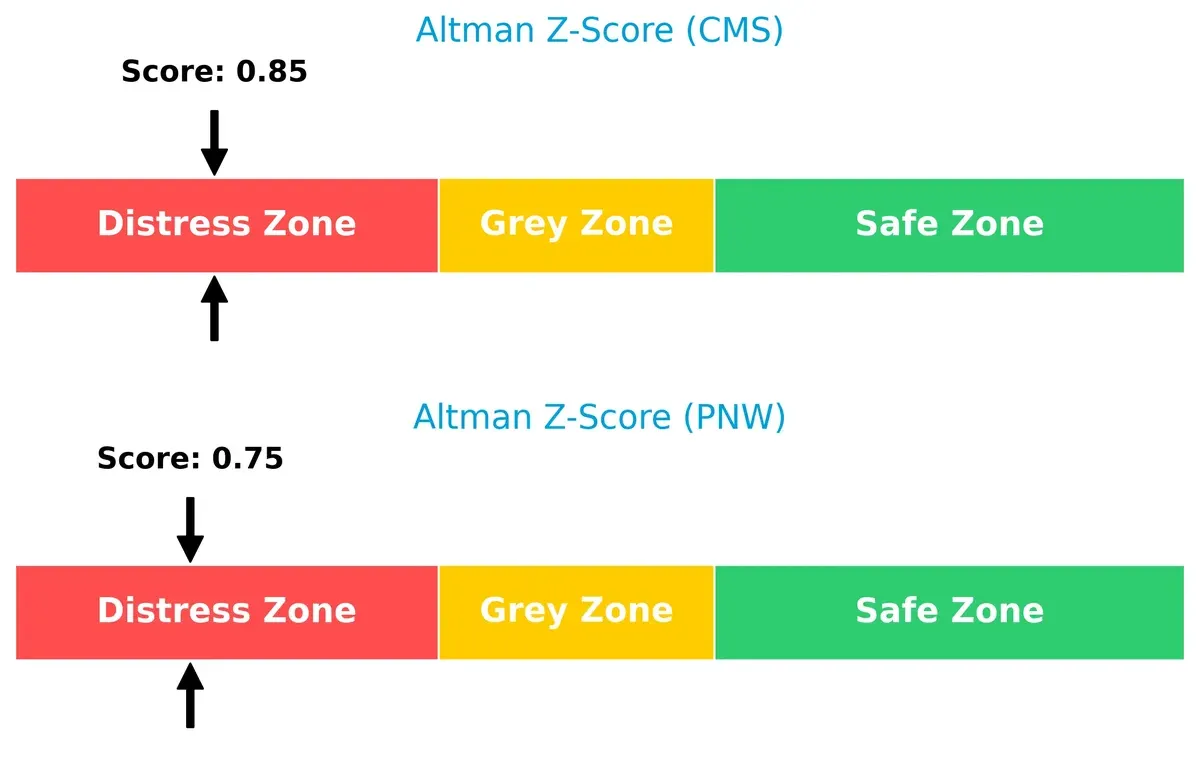
Bankruptcy Risk: Solvency Showdown
The Altman Z-Scores place both firms deep in the distress zone, with CMS at 0.85 and Pinnacle West at 0.75, signaling heightened bankruptcy risk in this cycle:
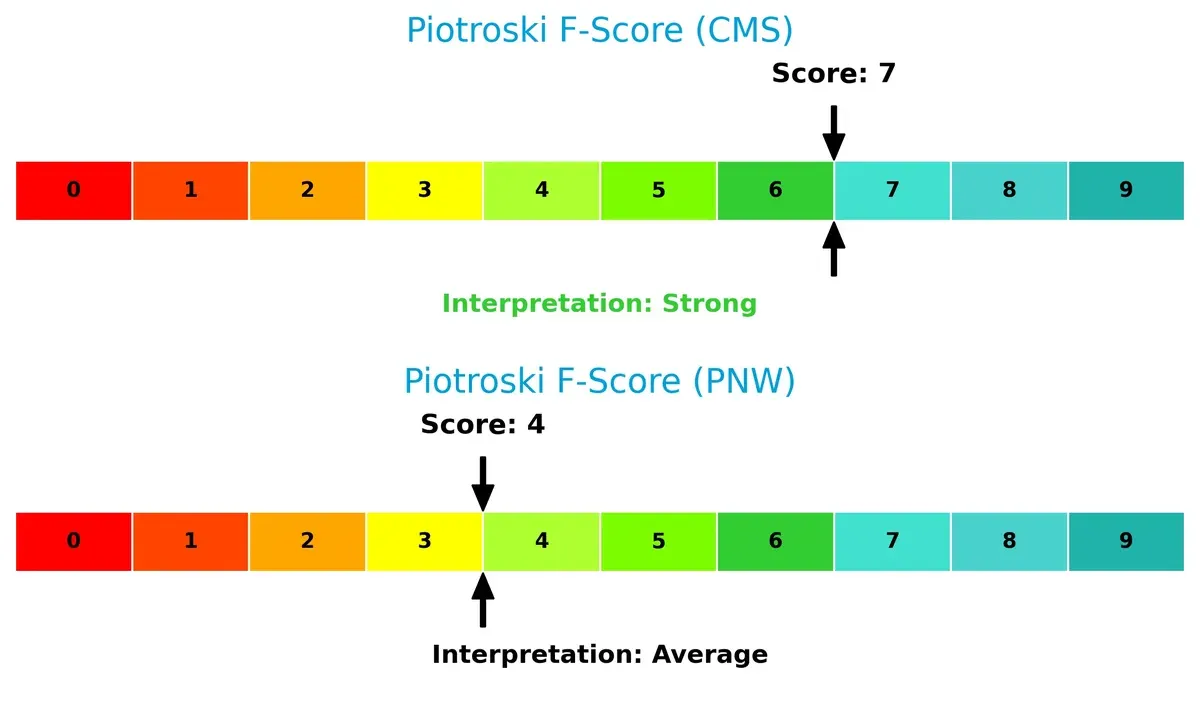
Financial Health: Quality of Operations
CMS leads with a Piotroski F-Score of 7, reflecting strong internal financial health. Pinnacle West’s score of 4 reveals average operational quality and potential red flags in financial metrics:
How are the two companies positioned?
This section dissects CMS and PNW’s operational DNA by comparing revenue distribution and internal dynamics, including strengths and weaknesses. The goal is to confront their economic moats and identify which model offers the most resilient, sustainable competitive advantage today.
Revenue Segmentation: The Strategic Mix
This visual comparison dissects how CMS Energy Corporation and Pinnacle West Capital Corporation diversify their income streams and where their primary sector bets lie:
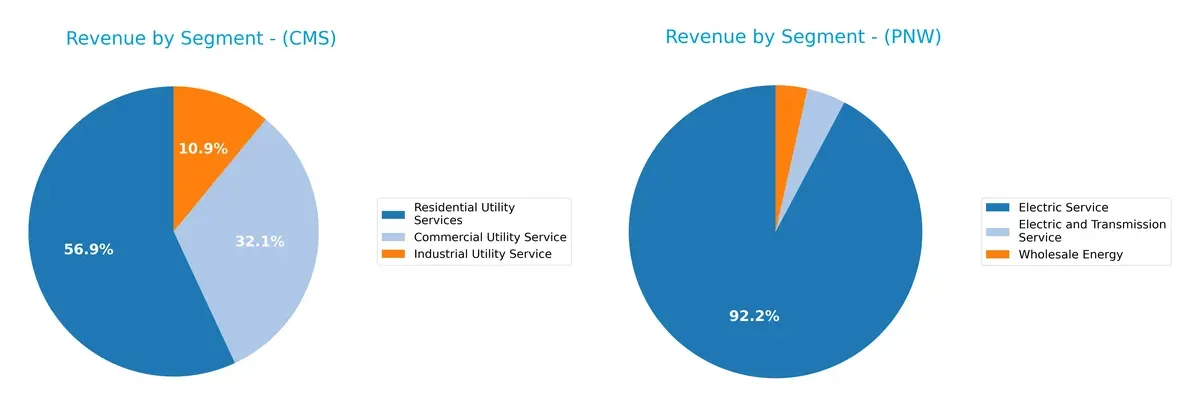
CMS leans heavily on Residential Utility Services, generating $3.75B in 2024, dwarfing its Commercial ($2.11B) and Industrial ($720M) segments. Pinnacle West pivots around Electric Service, anchoring $2.56B, with minor contributions from Electric and Transmission ($119M) and Wholesale Energy ($97M). CMS’s broader utility service spread reduces concentration risk, while Pinnacle West’s reliance on core electric service signals infrastructure dominance but exposes it to sector-specific cycles.
Strengths and Weaknesses Comparison
This table compares the Strengths and Weaknesses of CMS Energy Corporation and Pinnacle West Capital Corporation:
CMS Strengths
- Favorable net margin at 12.54%
- Neutral ROE at 12.01%
- Quick ratio favorable at 1.34
- Dividend yield favorable at 3.1%
- Neutral debt to assets at 47.31%
PNW Strengths
- Favorable net margin at 11.88%
- Favorable WACC at 4.73%
- Favorable PB ratio at 1.43
- Favorable dividend yield at 4.09%
- Neutral interest coverage at 2.95
CMS Weaknesses
- Unfavorable ROIC at 3.71% below WACC
- Unfavorable debt to equity at 2.12
- Unfavorable asset turnover at 0.21
- Unfavorable fixed asset turnover at 0.28
PNW Weaknesses
- Unfavorable ROE at 9.01%
- Unfavorable ROIC at 3.48% below WACC
- Unfavorable current ratio at 0.59
- Unfavorable quick ratio at 0.42
- Unfavorable debt to equity at 1.64
- Unfavorable asset turnover at 0.20
- Unfavorable fixed asset turnover at 0.25
CMS shows balanced profitability ratios but struggles with capital efficiency and leverage. PNW faces more liquidity and profitability challenges, reflected in weaker current and quick ratios. These factors influence each company’s operational and financial strategy.
The Moat Duel: Analyzing Competitive Defensibility
A structural moat is the only reliable shield protecting long-term profits from relentless competition erosion. Let’s dissect the moats of CMS Energy and Pinnacle West Capital:
CMS Energy Corporation: Asset-Heavy Utility with a Waning ROIC Moat
CMS relies on regulated asset scale and utility infrastructure as its primary moat. However, its ROIC trails below WACC, signaling value destruction. The 2026 outlook hinges on renewable expansions but risks margin pressure amid rising costs.
Pinnacle West Capital Corporation: Regional Utility Facing Profitability Headwinds
Pinnacle West leverages regional regulatory protection and generation capacity as its moat. Like CMS, its ROIC underperforms WACC, with a sharper decline trend. Growth in solar and grid modernization offers upside but may strain margins further.
Asset Scale vs. Regional Regulation: Which Utility Moat Holds Stronger?
Both firms suffer declining ROIC below WACC, eroding their economic moats. CMS’s broader customer base provides scale, yet Pinnacle West’s regional regulatory environment might offer slightly better long-term defensibility. Still, neither currently sustains value creation to robustly defend market share.
Which stock offers better returns?
The past year shows distinct price dynamics for CMS Energy Corporation and Pinnacle West Capital Corporation, highlighting differing momentum and trading behaviors.
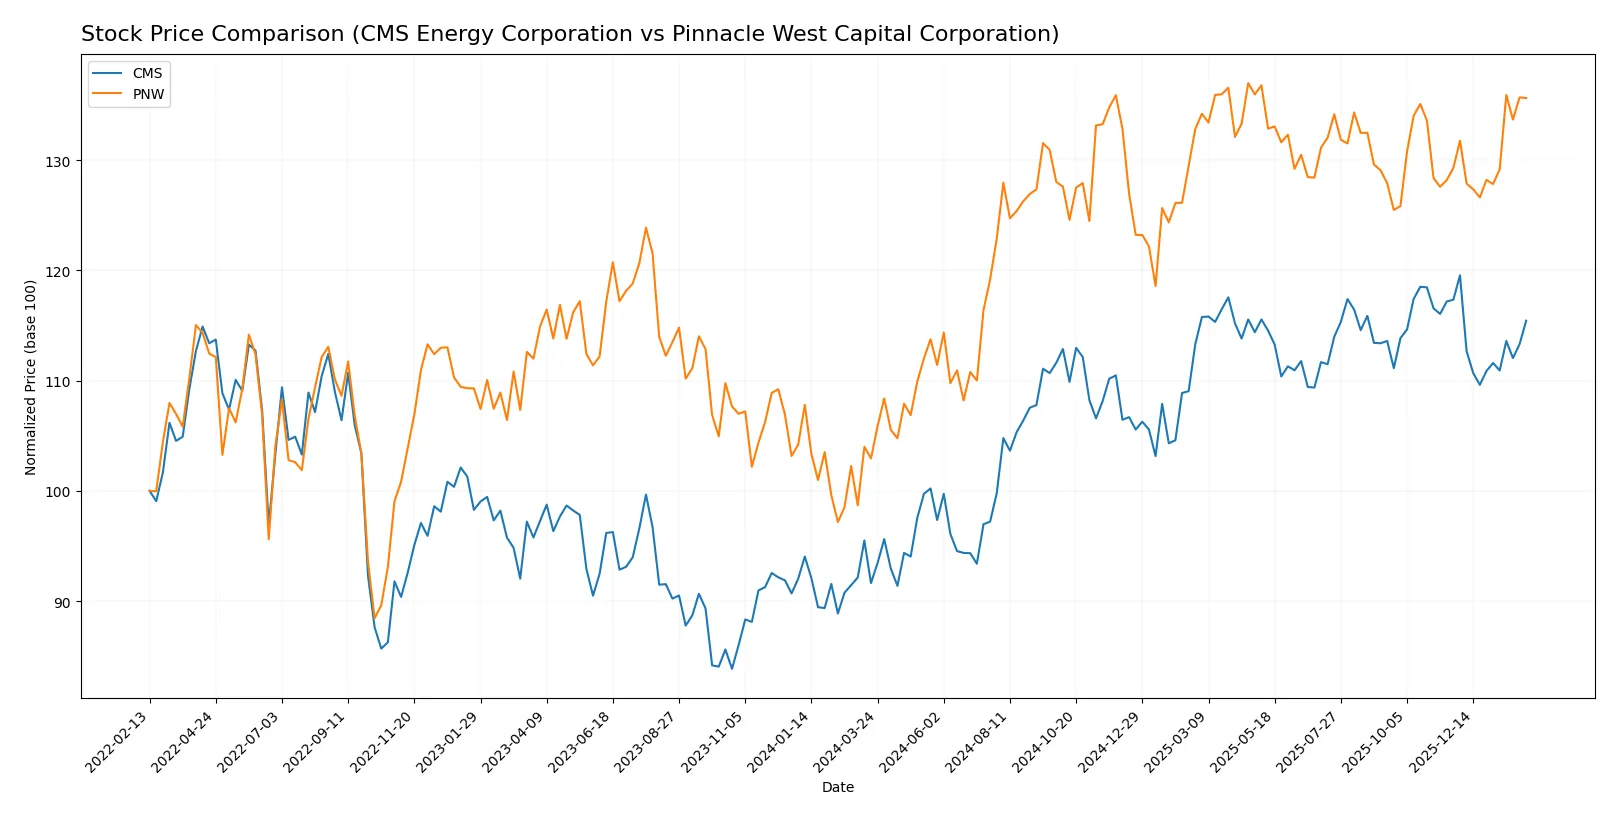
Trend Comparison
CMS Energy’s stock rose 25.98% over 12 months, marking a bullish trend with decelerating momentum. The price ranged from 57.66 to 75.44, showing strong gains but recent slight weakness (-1.62%).
Pinnacle West’s stock gained 31.76% in the last year, a bullish trend with accelerating momentum. It traded between 70.98 and 94.45, with recent gains of 4.9% indicating renewed strength and buyer interest.
PNW outperformed CMS over the 12-month period, delivering higher total returns and accelerating gains, whereas CMS showed deceleration and a mild recent pullback.
Target Prices
Analysts present a clear upside potential for both CMS Energy Corporation and Pinnacle West Capital Corporation.
| Company | Target Low | Target High | Consensus |
|---|---|---|---|
| CMS Energy Corporation | 74 | 82 | 78.14 |
| Pinnacle West Capital Corporation | 85 | 115 | 96.11 |
The target consensus for CMS exceeds its current price of 72.84, indicating modest upside. Pinnacle West’s consensus target also surpasses its current 93.52 price, suggesting room for growth amid stable sector conditions.

Don’t Let Luck Decide Your Entry Point
Optimize your entry points with our advanced ProRealTime indicators. You’ll get efficient buy signals with precise price targets for maximum performance. Start outperforming now!
How do institutions grade them?
The following tables summarize recent grades assigned to both companies by leading financial institutions:
CMS Energy Corporation Grades
This table lists the latest grades from major financial institutions for CMS:
| Grading Company | Action | New Grade | Date |
|---|---|---|---|
| Mizuho | maintain | Neutral | 2026-02-06 |
| Morgan Stanley | maintain | Equal Weight | 2026-02-02 |
| Jefferies | maintain | Buy | 2026-01-28 |
| Wells Fargo | maintain | Equal Weight | 2026-01-20 |
| JP Morgan | maintain | Overweight | 2026-01-15 |
| Jefferies | maintain | Buy | 2026-01-15 |
| Barclays | maintain | Overweight | 2026-01-15 |
| UBS | maintain | Neutral | 2025-12-17 |
| JP Morgan | maintain | Overweight | 2025-12-11 |
| Morgan Stanley | maintain | Equal Weight | 2025-10-22 |
Pinnacle West Capital Corporation Grades
This table presents the most recent grading data for Pinnacle West Capital:
| Grading Company | Action | New Grade | Date |
|---|---|---|---|
| Wells Fargo | maintain | Equal Weight | 2026-01-20 |
| Barclays | maintain | Equal Weight | 2026-01-15 |
| UBS | maintain | Neutral | 2025-12-17 |
| Keybanc | downgrade | Sector Weight | 2025-12-12 |
| Keybanc | maintain | Overweight | 2025-10-15 |
| UBS | maintain | Neutral | 2025-10-10 |
| Barclays | maintain | Equal Weight | 2025-10-07 |
| Argus Research | maintain | Buy | 2025-09-30 |
| Morgan Stanley | maintain | Equal Weight | 2025-09-25 |
| UBS | maintain | Neutral | 2025-09-12 |
Which company has the best grades?
CMS Energy holds a stronger consensus with multiple Buy and Overweight ratings from top firms. Pinnacle West mostly receives Equal Weight and Neutral grades, with a recent downgrade. This divergence could influence investor confidence and portfolio positioning.
Risks specific to each company
The following categories identify critical pressure points and systemic threats facing CMS Energy Corporation and Pinnacle West Capital Corporation in the 2026 market environment:
1. Market & Competition
CMS Energy Corporation
- Operates primarily in Michigan with diversified energy sources, facing moderate regional competition.
Pinnacle West Capital Corporation
- Focused in Arizona, with exposure to solar growth but limited geographic diversification increases market risk.
2. Capital Structure & Debt
CMS Energy Corporation
- Higher debt-to-equity ratio at 2.12 signals elevated financial leverage and risk.
Pinnacle West Capital Corporation
- Also carries high leverage with D/E at 1.64, but lower than CMS, indicating slightly less risk.
3. Stock Volatility
CMS Energy Corporation
- Beta of 0.48 suggests lower volatility and defensive stock behavior.
Pinnacle West Capital Corporation
- Beta of 0.54 indicates moderate volatility but still less than broader market averages.
4. Regulatory & Legal
CMS Energy Corporation
- Subject to Michigan’s regulatory environment, which can impact rate-setting and profit margins.
Pinnacle West Capital Corporation
- Arizona regulatory landscape may impose constraints, especially with rising renewable mandates.
5. Supply Chain & Operations
CMS Energy Corporation
- Extensive infrastructure with diverse fuel sources mitigates supply disruptions risk.
Pinnacle West Capital Corporation
- Heavy reliance on regulated generation and transmission exposes it to operational interruptions.
6. ESG & Climate Transition
CMS Energy Corporation
- Investing in renewables but coal and nuclear exposure may delay full climate transition.
Pinnacle West Capital Corporation
- Strong solar integration presents opportunity but also transition risks amid policy changes.
7. Geopolitical Exposure
CMS Energy Corporation
- Primarily domestic operations limit geopolitical risks.
Pinnacle West Capital Corporation
- Similarly, operates domestically with limited geopolitical exposure.
Which company shows a better risk-adjusted profile?
The most impactful risk for CMS is its elevated financial leverage, increasing vulnerability despite stable operational assets. Pinnacle West faces significant liquidity risks evidenced by low current and quick ratios. CMS’s lower stock volatility and stronger liquidity ratios suggest a better risk-adjusted profile. Notably, CMS’s Altman Z-score remains in distress, signaling caution, but its stronger Piotroski score indicates better financial resilience than Pinnacle West.
Final Verdict: Which stock to choose?
CMS Energy Corporation’s superpower lies in its ability to generate steady cash flow supported by a favorable income structure and a reliable dividend yield. Its point of vigilance is the declining return on invested capital, signaling efficiency challenges ahead. CMS might suit investors targeting a stable income stream within an Aggressive Growth portfolio.
Pinnacle West Capital Corporation’s strategic moat is its solid recurring revenue base and disciplined capital allocation, which supports consistent earnings growth. Compared to CMS, it presents a slightly weaker liquidity profile but offers better recent stock price momentum. PNW could fit well in a GARP (Growth at a Reasonable Price) portfolio seeking balanced growth and safety.
If you prioritize steady cash generation and dividend income, CMS is the compelling choice due to its favorable income metrics and stable payout. However, if you seek growth backed by improving market momentum and a robust recurring revenue moat, PNW offers better stability and upside potential despite some liquidity risks. Both entail risks of value erosion, so cautious allocation aligned with your risk tolerance is essential.
Disclaimer: Investment carries a risk of loss of initial capital. The past performance is not a reliable indicator of future results. Be sure to understand risks before making an investment decision.
Go Further
I encourage you to read the complete analyses of CMS Energy Corporation and Pinnacle West Capital Corporation to enhance your investment decisions: