Home > Comparison > Utilities > PCG vs CMS
The strategic rivalry between Pacific Gas & Electric Co. and CMS Energy Corporation shapes the utilities sector’s future in the U.S. Pacific Gas & Electric operates as a capital-intensive, multi-source energy provider in California, while CMS Energy runs a diversified electric and gas utility with a strong renewable focus in Michigan. This head-to-head contrasts legacy scale with integrated innovation. This analysis aims to identify which company presents the superior risk-adjusted opportunity for a balanced portfolio.
Table of contents
Companies Overview
Pacific Gas & Electric Co. and CMS Energy Corporation serve as pillars in the U.S. regulated electric sector, shaping energy delivery on the West Coast and Midwest.
Pacific Gas & Electric Co.: California’s Energy Powerhouse
Pacific Gas & Electric Co. dominates northern and central California’s energy market by generating and distributing electricity and natural gas. Its core revenue engine hinges on a diversified energy mix including nuclear, hydroelectric, fossil fuels, and photovoltaics. In 2026, PG&E focuses on integrating innovative personal microgrid backup power devices with its SmartMeter system, reinforcing its competitive edge in customer-centric energy management.
CMS Energy Corporation: Michigan’s Integrated Utility Leader
CMS Energy operates primarily in Michigan with a three-segment approach: Electric Utility, Gas Utility, and Enterprises. It generates revenue through a broad energy portfolio covering coal, wind, gas, renewables, oil, and nuclear. The company’s strategic focus in 2026 centers on expanding renewable generation and maintaining a robust, integrated infrastructure that serves nearly 3.7M customers across electricity and gas.
Strategic Collision: Similarities & Divergences
Both companies operate in the regulated electric space but differ in scale and scope. PG&E pursues a technology-driven customer integration model, while CMS emphasizes a balanced, multi-commodity utility infrastructure. Their primary battleground lies in energy generation diversification and infrastructure resilience. Investors will find PG&E’s innovation-heavy profile distinct from CMS’s steady, asset-heavy utility model.
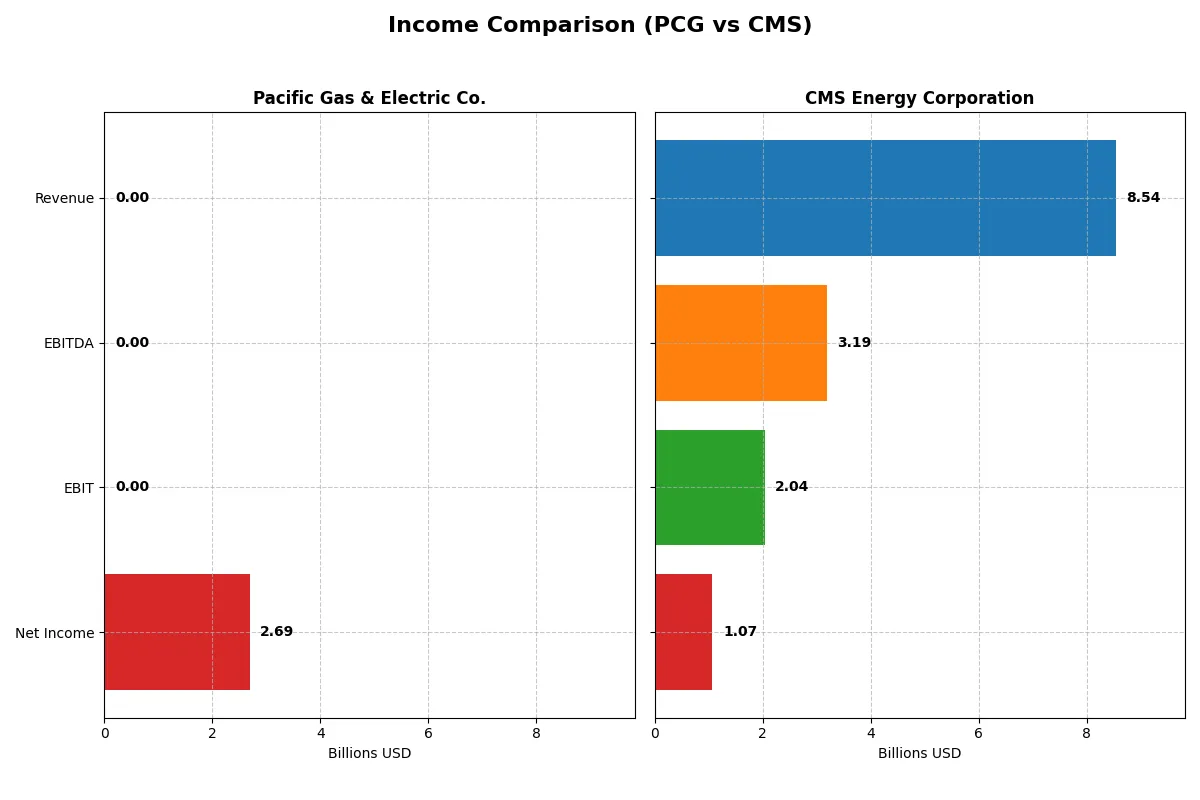
Income Statement Comparison
This data dissects the core profitability and scalability of both corporate engines to reveal who dominates the bottom line:
| Metric | Pacific Gas & Electric Co. (PCG) | CMS Energy Corporation (CMS) |
|---|---|---|
| Revenue | 0 | 8.5B |
| Cost of Revenue | 0 | 3.3B |
| Operating Expenses | -207M | 3.5B |
| Gross Profit | 0 | 5.2B |
| EBITDA | 0 | 3.2B |
| EBIT | 0 | 2.0B |
| Interest Expense | -315M | 789M |
| Net Income | 2.7B | 1.1B |
| EPS | 1.18 | 3.53 |
| Fiscal Year | 2025 | 2025 |
Income Statement Analysis: The Bottom-Line Duel
This income statement comparison uncovers which company leverages its revenues and costs most efficiently to generate shareholder value.
Pacific Gas & Electric Co. Analysis
Pacific Gas & Electric Co. saw a sharp revenue collapse to zero in 2025, after steady $20B+ figures through 2021-2024. Net income surged to $2.69B in 2025, driven by non-operating gains despite zero gross profit that year. Margins deteriorated sharply in 2025, but EPS improved marginally, reflecting financial engineering rather than operational strength.
CMS Energy Corporation Analysis
CMS Energy steadily grew revenues from $7.3B in 2021 to $8.5B in 2025, with a strong gross margin near 61%. Net income fluctuated, peaking at $1.35B in 2021 and dropping to $1.07B in 2025. EBIT margins averaged 24%, showing consistent operational profitability. EPS rose 6% last year, despite a slight dip in net margin, signaling controlled cost management and stable growth momentum.
Revenue Collapse vs. Sustainable Profitability
Pacific Gas & Electric’s volatile revenue drop contrasts with CMS Energy’s steady top-line growth. PCG’s net income spike in 2025 masks operational weakness, while CMS sustains solid margins and moderate EPS growth. For investors prioritizing operational stability and margin health, CMS offers a clearer, more reliable earnings profile amid market cycles.
Financial Ratios Comparison
These vital ratios act as a diagnostic tool to expose the underlying fiscal health, valuation premiums, and capital efficiency of the companies analyzed:
| Ratios | Pacific Gas & Electric Co. (PCG) | CMS Energy Corporation (CMS) |
|---|---|---|
| ROE | 8.26% (2025) | 11.71% (2025) |
| ROIC | N/A | 3.67% (2025) |
| P/E | 13.13 (2025) | 19.63 (2025) |
| P/B | 1.08 (2025) | 2.30 (2025) |
| Current Ratio | 0.03 (2025) | 0.98 (2025) |
| Quick Ratio | 0.03 (2025) | 0.76 (2025) |
| D/E | 0.27 (2025) | 2.07 (2025) |
| Debt-to-Assets | 18.84% (2025) | 46.89% (2025) |
| Interest Coverage | 0 (2025) | 2.19 (2025) |
| Asset Turnover | 0 (2025) | 0.21 (2025) |
| Fixed Asset Turnover | 0 (2025) | 0.28 (2025) |
| Payout Ratio | 8.17% (2025) | 60.90% (2025) |
| Dividend Yield | 0.62% (2025) | 3.10% (2025) |
| Fiscal Year | 2025 | 2025 |
Efficiency & Valuation Duel: The Vital Signs
Financial ratios act as a company’s DNA, revealing hidden risks and operational excellence that shape investor decisions.
Pacific Gas & Electric Co.
Pacific Gas & Electric Co. posts a modest ROE of 8.26%, signaling limited profitability. Its P/E of 13.13 and P/B of 1.08 suggest a reasonably valued but operationally challenged stock. Dividend yield is low at 0.62%, reflecting modest shareholder returns amid weak liquidity and unfavorable cash flow metrics.
CMS Energy Corporation
CMS Energy shows a stronger net margin of 12.54% and a decent ROE of 11.71%, indicating better profitability. The stock trades at a P/E of 19.63 and P/B of 2.3, marking it as more expensive but supported by a healthy 3.1% dividend yield. Debt levels are higher, but its interest coverage remains neutral.
Valuation Discipline vs. Profitability Strength
Pacific Gas & Electric offers a more conservative valuation with weaker returns and liquidity concerns. CMS commands a premium yet delivers superior margins and dividend income. Investors preferring operational resilience and income may favor CMS, while those cautious on valuation might lean toward Pacific Gas & Electric.
Which one offers the Superior Shareholder Reward?
I compare Pacific Gas & Electric Co. (PCG) and CMS Energy Corporation (CMS) on dividends, payout ratios, and buybacks. PCG yields 0.62% with a low payout ratio of 8.2%, but suffers negative free cash flow (-$1.4/share), limiting buyback capacity. CMS yields 3.10%, with a 61% payout ratio, fully covered by positive free cash flow ($7.4/share). CMS’s aggressive dividend and consistent free cash flow support sustainable shareholder rewards, while PCG’s weak cash flow and minimal buybacks raise caution. I conclude CMS offers the superior total return profile in 2026.
Comparative Score Analysis: The Strategic Profile
The radar chart reveals the core financial DNA and trade-offs of Pacific Gas & Electric Co. and CMS Energy Corporation:
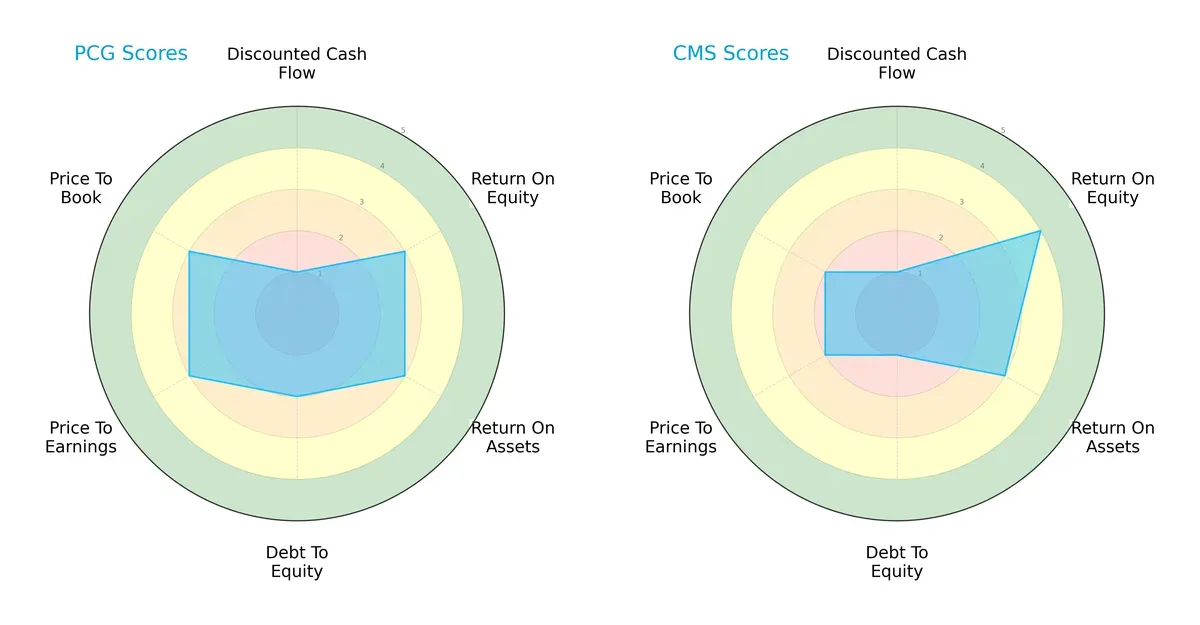
Pacific Gas & Electric shows a more balanced profile with moderate scores in ROE, ROA, and valuation metrics, though its debt-to-equity is unfavorable. CMS Energy relies on a stronger ROE advantage but suffers from very unfavorable debt and valuation scores, reflecting higher financial risk and potential overvaluation. Overall, Pacific Gas & Electric offers steadier fundamentals, while CMS leans on operational efficiency amid capital structure concerns.
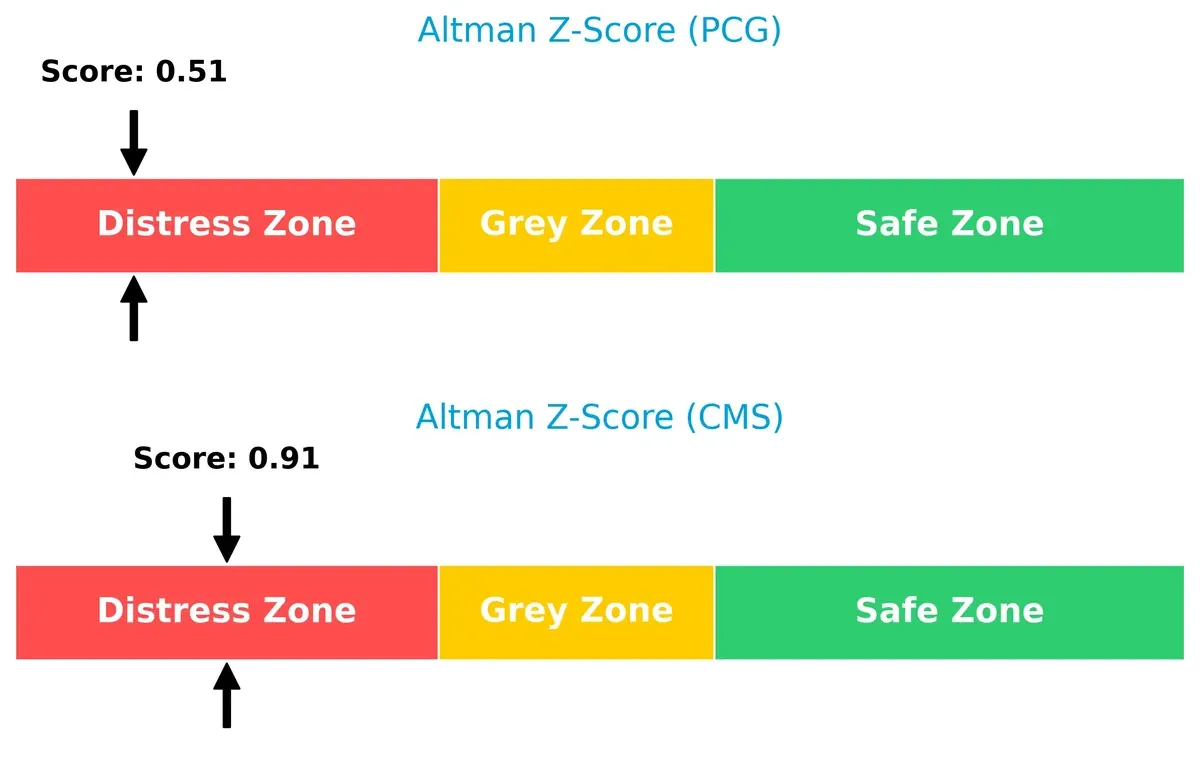
Bankruptcy Risk: Solvency Showdown
Both firms reside in the distress zone with Altman Z-Scores below 1, signaling elevated bankruptcy risk and financial vulnerability in the current economic cycle:
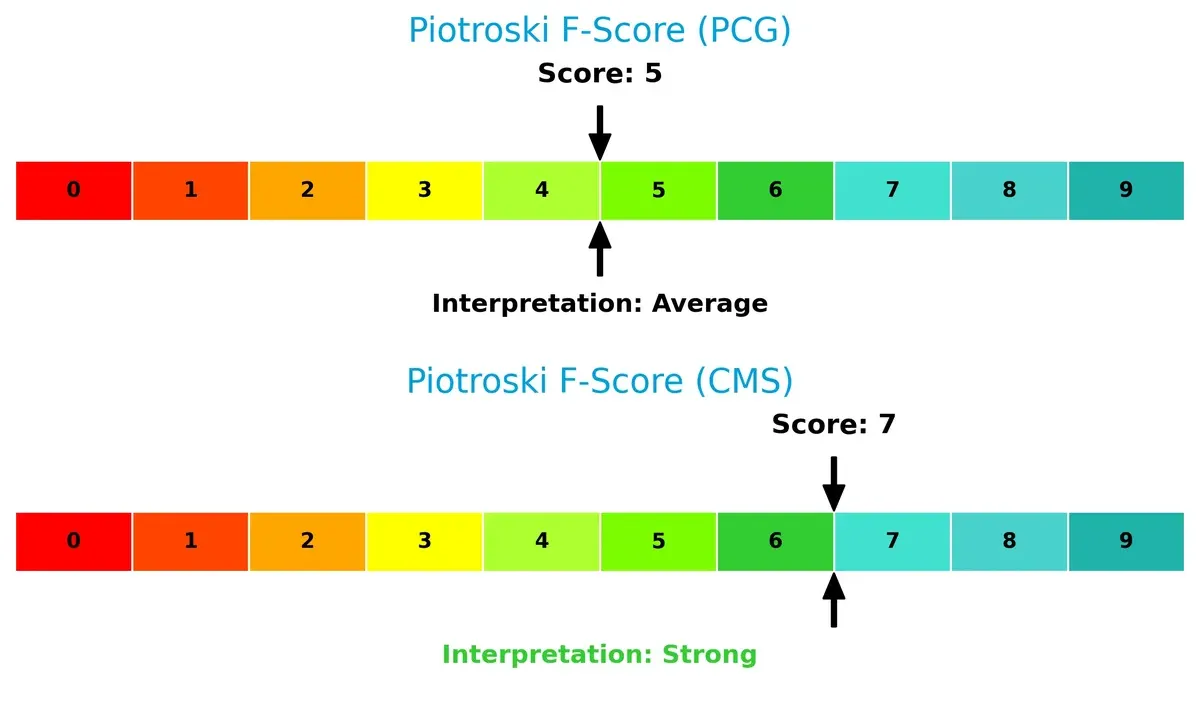
Financial Health: Quality of Operations
CMS Energy’s Piotroski F-Score of 7 indicates stronger internal financial health compared to Pacific Gas & Electric’s average score of 5, highlighting CMS’s superior operational quality and fewer red flags:
How are the two companies positioned?
This section dissects the operational DNA of PCG and CMS by comparing their revenue distribution by segment alongside their internal strengths and weaknesses. The final objective confronts their economic moats to identify which business model offers the most resilient and sustainable competitive advantage in today’s market.
Revenue Segmentation: The Strategic Mix
This visual comparison dissects how Pacific Gas & Electric Co. and CMS Energy diversify income streams and where their primary sector bets lie:
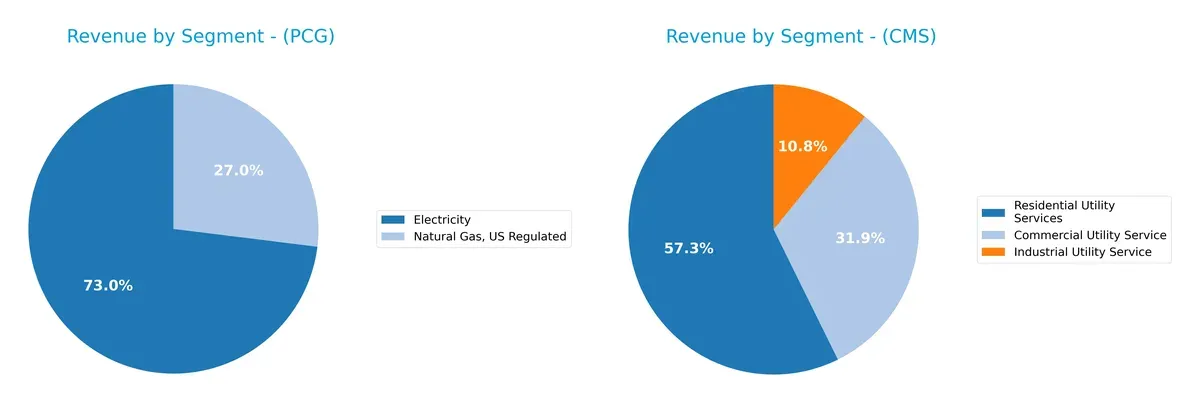
Pacific Gas & Electric Co. anchors its revenue heavily in Electricity at $18.3B, with Natural Gas contributing $6.8B, showing a two-segment focus. CMS Energy displays a more balanced mix across Residential ($4.4B), Commercial ($2.4B), and Industrial ($0.8B) Utility Services. PCG’s concentration risks contrast with CMS’s diversified approach, which reduces exposure and enhances resilience in volatile energy markets.
Strengths and Weaknesses Comparison
This table compares the Strengths and Weaknesses of Pacific Gas & Electric Co. (PCG) and CMS Energy Corporation (CMS):
PCG Strengths
- Strong diversification with significant electricity and natural gas revenues
- Favorable debt-to-equity and debt-to-assets ratios indicate conservative leverage
- Attractive PE and PB ratios suggest market undervaluation
CMS Strengths
- Solid net margin of 12.54% reflecting profitability
- Higher dividend yield at 3.1% appealing to income investors
- Balanced revenue mix across commercial, industrial, and residential utility services
PCG Weaknesses
- Unfavorable profitability metrics: net margin and ROIC at 0%
- Extremely low current and quick ratios indicate liquidity risk
- Negative interest coverage ratio signals difficulty managing debt costs
CMS Weaknesses
- Unfavorable debt-to-equity ratio above 2.0 implies high leverage
- Low asset and fixed asset turnover indicate inefficient asset use
- Unfavorable current and quick ratios highlight liquidity concerns
PCG shows financial conservatism in capital structure but suffers from poor profitability and liquidity. CMS demonstrates better operating profitability and dividend appeal but faces risks from elevated leverage and asset efficiency. These contrasts suggest differing strategic priorities in balancing growth, risk, and shareholder returns.
The Moat Duel: Analyzing Competitive Defensibility
A structural moat is the only shield that protects a company’s long-term profits from relentless competition erosion. Let’s dissect the moats of two regulated electric utilities:
Pacific Gas & Electric Co.: Emerging Profitability Amid Value Destruction
I identify PG&E’s moat rooted in regulated utility status and infrastructure scale. Despite a slightly unfavorable ROIC vs. WACC (-4.9%), its ROIC doubled from 2021 to 2025, signaling improving efficiency. New smart grid tech and microgrid integration could deepen this moat by enhancing customer lock-in in 2026.
CMS Energy Corporation: Established Scale with Declining Returns
CMS leverages a diversified utility network with strong gross (61%) and EBIT margins (24%), contrasting PG&E’s struggles. However, its declining ROIC trend and value destruction signal weakening capital efficiency. Expansion into renewable generation offers upside, but profitability pressures may challenge moat sustainability in 2026.
Regulated Infrastructure Resilience vs. Operational Efficiency Decline
PG&E’s growing ROIC trend, despite current value destruction, suggests a moat rebuilding phase fueled by innovation. CMS shows stronger margins but a shrinking moat due to declining returns on invested capital. I view PG&E as better positioned to defend market share through strategic modernization, while CMS faces tougher headwinds maintaining its competitive edge.
Which stock offers better returns?
Both Pacific Gas & Electric Co. and CMS Energy Corporation have shown notable price appreciation over the past year, with CMS displaying stronger gains despite higher volatility.
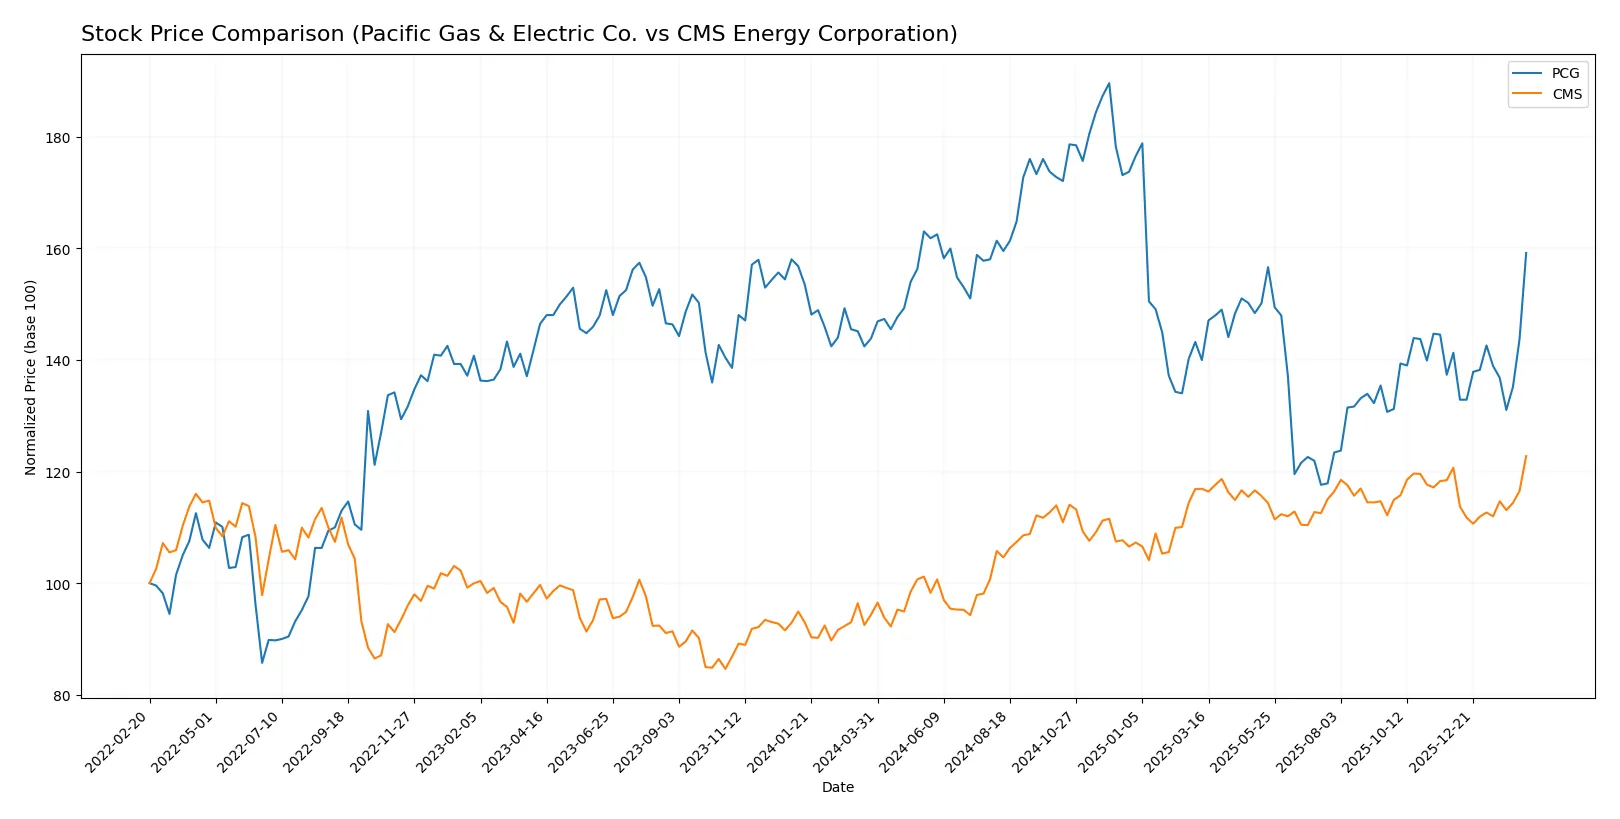
Trend Comparison
Pacific Gas & Electric Co. posted a bullish trend with a 10.66% price increase over 12 months, accelerating steadily from a low of 13.42 to a high of 21.63, with moderate volatility at 1.96.
CMS Energy Corporation surged 30.13% in the same period, also accelerating, but with higher volatility (4.65). Its price ranged from 57.66 to 76.74, reflecting more pronounced market movement.
CMS outperformed Pacific Gas & Electric in market returns by nearly 20 percentage points, despite greater price volatility and a weaker recent trend under 2%.
Target Prices
Analysts present a constructive target consensus for both Pacific Gas & Electric Co. and CMS Energy Corporation.
| Company | Target Low | Target High | Consensus |
|---|---|---|---|
| Pacific Gas & Electric Co. | 18 | 25 | 21.43 |
| CMS Energy Corporation | 74 | 82 | 78.38 |
The consensus target for PCG stands about 18% above its current price of 18.16, signaling moderate upside. CMS’s target suggests a roughly 2% premium to its 76.74 stock price, reflecting more tempered analyst expectations.

Don’t Let Luck Decide Your Entry Point
Optimize your entry points with our advanced ProRealTime indicators. You’ll get efficient buy signals with precise price targets for maximum performance. Start outperforming now!
How do institutions grade them?
The following tables summarize recent grades assigned by reputable financial institutions for the two companies:
Pacific Gas & Electric Co. Grades
This table lists recent grades from established financial firms for Pacific Gas & Electric Co.:
| Grading Company | Action | New Grade | Date |
|---|---|---|---|
| Jefferies | Maintain | Buy | 2026-01-28 |
| Wells Fargo | Maintain | Overweight | 2026-01-20 |
| JP Morgan | Maintain | Overweight | 2025-12-12 |
| UBS | Maintain | Neutral | 2025-10-24 |
| Jefferies | Maintain | Buy | 2025-10-22 |
| BMO Capital | Maintain | Outperform | 2025-10-14 |
| Jefferies | Maintain | Buy | 2025-10-03 |
| Barclays | Maintain | Overweight | 2025-10-01 |
| Morgan Stanley | Maintain | Equal Weight | 2025-09-25 |
| Morgan Stanley | Upgrade | Equal Weight | 2025-09-18 |
CMS Energy Corporation Grades
This table shows recent grades from respected financial firms for CMS Energy Corporation:
| Grading Company | Action | New Grade | Date |
|---|---|---|---|
| BMO Capital | Maintain | Outperform | 2026-02-09 |
| Mizuho | Maintain | Neutral | 2026-02-06 |
| Morgan Stanley | Maintain | Equal Weight | 2026-02-02 |
| Jefferies | Maintain | Buy | 2026-01-28 |
| Wells Fargo | Maintain | Equal Weight | 2026-01-20 |
| JP Morgan | Maintain | Overweight | 2026-01-15 |
| Jefferies | Maintain | Buy | 2026-01-15 |
| Barclays | Maintain | Overweight | 2026-01-15 |
| UBS | Maintain | Neutral | 2025-12-17 |
| JP Morgan | Maintain | Overweight | 2025-12-11 |
Which company has the best grades?
Both companies receive generally positive grades from respected institutions. Pacific Gas & Electric Co. shows multiple Buy and Overweight ratings, while CMS Energy Corporation also secures Outperform and Buy grades. Investors might view Pacific Gas & Electric’s consistent Buy endorsements as a sign of confidence, whereas CMS’s combination of Outperform and Overweight ratings indicates solid institutional support.
Risks specific to each company
The following categories identify the critical pressure points and systemic threats facing Pacific Gas & Electric Co. and CMS Energy Corporation in the 2026 market environment:
1. Market & Competition
Pacific Gas & Electric Co.
- Faces stiff regulation and competition in California’s utility market, with pressure from renewable integration demands.
CMS Energy Corporation
- Operates mainly in Michigan with a diversified energy mix, balancing coal, gas, and renewables amid evolving market demands.
2. Capital Structure & Debt
Pacific Gas & Electric Co.
- Maintains low debt-to-equity ratio (0.27), signaling conservative leverage but weak interest coverage raises red flags.
CMS Energy Corporation
- Carries high debt-to-equity (2.07), increasing financial risk despite moderate interest coverage of 2.58.
3. Stock Volatility
Pacific Gas & Electric Co.
- Exhibits low beta (0.374), indicating less sensitivity to market swings, appealing to risk-averse investors.
CMS Energy Corporation
- Slightly higher beta (0.481) suggests more volatility but still below market averages, offering moderate risk exposure.
4. Regulatory & Legal
Pacific Gas & Electric Co.
- High legal risk due to California wildfire liabilities and stringent state regulations impacting operations.
CMS Energy Corporation
- Faces regulatory pressures in Michigan, but less exposed to catastrophic liability risks compared to PCG.
5. Supply Chain & Operations
Pacific Gas & Electric Co.
- Complex infrastructure with aging assets requires heavy maintenance; operational inefficiencies reflected in zero asset turnover.
CMS Energy Corporation
- Operates extensive electric and gas distribution networks with moderate asset turnover but faces challenges modernizing infrastructure.
6. ESG & Climate Transition
Pacific Gas & Electric Co.
- Transitioning towards renewables but legacy fossil fuel assets and nuclear generation present transition risks.
CMS Energy Corporation
- Active in renewable development but still reliant on coal and gas; balancing ESG goals with operational realities.
7. Geopolitical Exposure
Pacific Gas & Electric Co.
- Primarily regional exposure limited to California, insulating from broad geopolitical shocks but subject to state policy shifts.
CMS Energy Corporation
- Concentrated in Michigan with similar regional risk profile; less vulnerable to international geopolitical disruptions.
Which company shows a better risk-adjusted profile?
Pacific Gas & Electric Co.’s most impactful risk is its legal and regulatory exposure, particularly wildfire liabilities, which threaten financial stability despite low leverage. CMS Energy faces elevated financial risk due to high debt levels but benefits from stronger profitability and operational diversification. CMS’s higher Piotroski score (7 vs. 5) signals better financial health, yet both companies sit in Altman Z-score distress zones, warning of potential bankruptcy risk. Overall, CMS presents a marginally better risk-adjusted profile, supported by superior net margin and dividend yield trends, though both require cautious monitoring.
Final Verdict: Which stock to choose?
Pacific Gas & Electric Co. (PCG) showcases its superpower as a turnaround candidate with improving profitability amid challenging fundamentals. Its value creation remains muted, signaling a point of vigilance around capital efficiency and liquidity. PCG might suit investors seeking an aggressive growth play betting on a recovery.
CMS Energy Corporation (CMS) presents a strategic moat through steady cash flow and recurring revenue stability. It offers a comparatively safer profile than PCG, despite some pressure on profitability trends. CMS fits a GARP (Growth at a Reasonable Price) portfolio focused on income and moderate growth.
If you prioritize high-risk, high-reward turnaround potential, PCG is the compelling choice due to its accelerating price momentum and improving returns. However, if you seek steadier income with a defensive tilt, CMS offers better stability and consistent cash flow, though at a premium valuation and with structural challenges in profitability.
Disclaimer: Investment carries a risk of loss of initial capital. The past performance is not a reliable indicator of future results. Be sure to understand risks before making an investment decision.
Go Further
I encourage you to read the complete analyses of Pacific Gas & Electric Co. and CMS Energy Corporation to enhance your investment decisions: