Home > Comparison > Utilities > CMS vs OKLO
The strategic rivalry between CMS Energy Corporation and Oklo Inc. shapes the future of the regulated electric utilities sector. CMS operates as a capital-intensive utility giant with extensive electric and gas infrastructure, while Oklo focuses on innovative fission power plant development with a lean operational model. This analysis pits traditional scale against cutting-edge technology to identify which trajectory offers superior risk-adjusted returns for a diversified portfolio in today’s evolving energy landscape.
Table of contents
Companies Overview
CMS Energy Corporation and Oklo Inc. are pivotal players reshaping the U.S. regulated electric market.
CMS Energy Corporation: Established Utility Powerhouse
CMS Energy Corporation operates primarily in Michigan and serves 1.9M electric and 1.8M gas customers. Its core business centers on generation, transmission, and distribution of electricity and natural gas via coal, wind, gas, and nuclear sources. In 2026, CMS focuses strategically on expanding renewable generation and upgrading its extensive infrastructure to maintain reliability and regulatory compliance.
Oklo Inc.: Innovative Nuclear Energy Developer
Oklo Inc. designs and develops fission power plants to deliver reliable commercial-scale energy. Its competitive advantage lies in advanced nuclear technology and used fuel recycling services, targeting U.S. energy markets. In 2026, Oklo prioritizes scaling its novel reactors and commercial deployment to disrupt traditional energy sources with clean, efficient nuclear power.
Strategic Collision: Similarities & Divergences
CMS and Oklo both compete in regulated electric utility markets but diverge in approach. CMS relies on a diversified energy mix and extensive infrastructure, while Oklo bets on cutting-edge nuclear innovation. Their battleground is delivering reliable, low-carbon energy amid evolving regulations. Investors should note CMS’s stability contrasts with Oklo’s growth-oriented, tech-driven profile.
Income Statement Comparison
The following data dissects the core profitability and scalability of both corporate engines to reveal who dominates the bottom line:

| Metric | CMS Energy Corporation (CMS) | Oklo Inc. (OKLO) |
|---|---|---|
| Revenue | 8.54B | 0 |
| Cost of Revenue | 3.34B | 0 |
| Operating Expenses | 3.47B | 53M |
| Gross Profit | 5.20B | 0 |
| EBITDA | 3.19B | -53M |
| EBIT | 2.04B | -53M |
| Interest Expense | 789M | 0 |
| Net Income | 1.07B | -74M |
| EPS | 3.53 | -0.74 |
| Fiscal Year | 2025 | 2024 |
Income Statement Analysis: The Bottom-Line Duel
This income statement comparison reveals which company operates its financial engine with greater efficiency and sustainable momentum.
CMS Energy Corporation Analysis
CMS grew revenue steadily from 7.3B in 2021 to 8.5B in 2025, with a peak net income of 1.35B in 2021, settling at 1.07B in 2025. Gross margins hold strong above 60%, indicating robust cost control. Despite a slight net margin dip to 12.5%, CMS’s earnings per share advanced 6% last year, signaling solid operational momentum.
Oklo Inc. Analysis
Oklo posted zero revenue across its available history from 2021 to 2024, reflecting the early-stage nature of its business. Operating losses deepened to -53M in 2024, with net losses increasing to -74M. Margins remain unfavorable at zero due to ongoing investment in R&D and G&A. The company’s negative EPS of -0.74 in 2024 highlights persistent unprofitability and developmental risk.
Margin Strength vs. Development Stage Losses
CMS stands as the clear fundamental winner with consistent revenue growth, positive net income, and strong margins. Oklo’s lack of revenue and mounting losses reflect a high-risk developmental profile. Investors seeking stable earnings and margin resilience will find CMS’s mature model more attractive than Oklo’s early-stage investment story.
Financial Ratios Comparison
These vital ratios act as a diagnostic tool to expose the underlying fiscal health, valuation premiums, and capital efficiency of the companies compared below:
| Ratios | CMS Energy Corporation (CMS) | Oklo Inc. (OKLO) |
|---|---|---|
| ROE | 12.01% (2025) | -29.35% (2024) |
| ROIC | 3.71% (2025) | -19.05% (2024) |
| P/E | 19.49 (2025) | -28.52 (2024) |
| P/B | 2.34 (2025) | 8.37 (2024) |
| Current Ratio | 1.34 (2025) | 43.47 (2024) |
| Quick Ratio | 1.34 (2025) | 43.47 (2024) |
| D/E | 2.12 (2025) | 0.005 (2024) |
| Debt-to-Assets | 47.31% (2025) | 0.46% (2024) |
| Interest Coverage | 2.19 (2025) | 0 (2024) |
| Asset Turnover | 0.21 (2025) | 0 (2024) |
| Fixed Asset Turnover | 0.28 (2025) | 0 (2024) |
| Payout ratio | 60.48% (2025) | 0% (2024) |
| Dividend yield | 3.10% (2025) | 0% (2024) |
| Fiscal Year | 2025 | 2024 |
Efficiency & Valuation Duel: The Vital Signs
Financial ratios serve as a company’s DNA, uncovering hidden risks and operational strengths critical for informed investing.
CMS Energy Corporation
CMS demonstrates solid profitability with a 12.01% ROE and a favorable 12.54% net margin. Its valuation metrics, including a 19.49 P/E and a 2.34 P/B, suggest a fairly valued stock. The 3.1% dividend yield rewards shareholders, reflecting a stable capital allocation strategy amid some operational inefficiencies.
Oklo Inc.
Oklo faces significant profitability challenges, posting a negative 29.35% ROE and zero net margin. Its valuation appears stretched with an 8.37 P/B, despite a negative P/E signaling losses. Oklo retains earnings to fuel growth, yet the absence of dividends and weak operational metrics highlight considerable risk for investors.
Balanced Stability vs. Growth Risk
CMS offers a more balanced profile with moderate profitability and shareholder returns, while Oklo’s financials reveal high risk and operational struggles. Investors seeking stability may prefer CMS, whereas those targeting speculative growth face higher uncertainty with Oklo.
Which one offers the Superior Shareholder Reward?
CMS Energy Corporation pays a steady dividend with a 3.1% yield, supported by a 60% payout ratio and positive free cash flow of 7.5/share in 2025. Its buyback program is modest but consistent, enhancing total returns sustainably. Oklo Inc. pays no dividends and burns cash, focusing on growth investments instead. Oklo’s massive cash reserves and near-zero debt hint at long-term potential but involve higher risk and no immediate shareholder income. I judge CMS offers a superior total return profile in 2026, balancing income and buybacks with sustainable cash flows.
Comparative Score Analysis: The Strategic Profile
The radar chart reveals the fundamental DNA and trade-offs of CMS Energy Corporation and Oklo Inc., highlighting their core financial strengths and vulnerabilities:

CMS shows a more balanced profile with moderate to favorable returns on equity (4) and assets (3), despite weak debt management (1) and valuation metrics (2). Oklo leans heavily on a robust debt-to-equity position (5) and decent DCF score (3) but suffers from poor profitability scores (ROE 1, ROA 1) and weak valuation metrics (PE 1, PB 1). CMS’s diversified strengths contrast with Oklo’s reliance on low leverage, signaling different risk-return trade-offs.
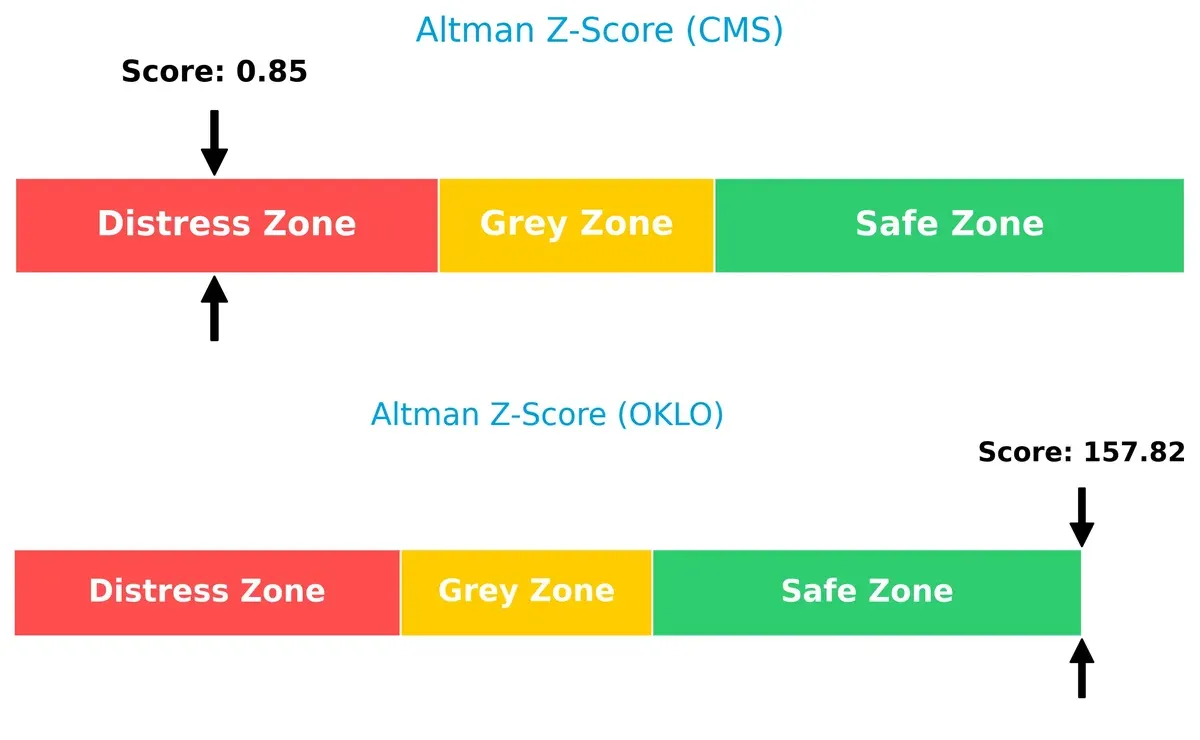
Bankruptcy Risk: Solvency Showdown
CMS’s Altman Z-Score of 0.85 places it deep in the distress zone, signaling high bankruptcy risk. Oklo’s extraordinary 158 score firmly positions it in the safe zone, indicating strong solvency and survival odds in this cycle:
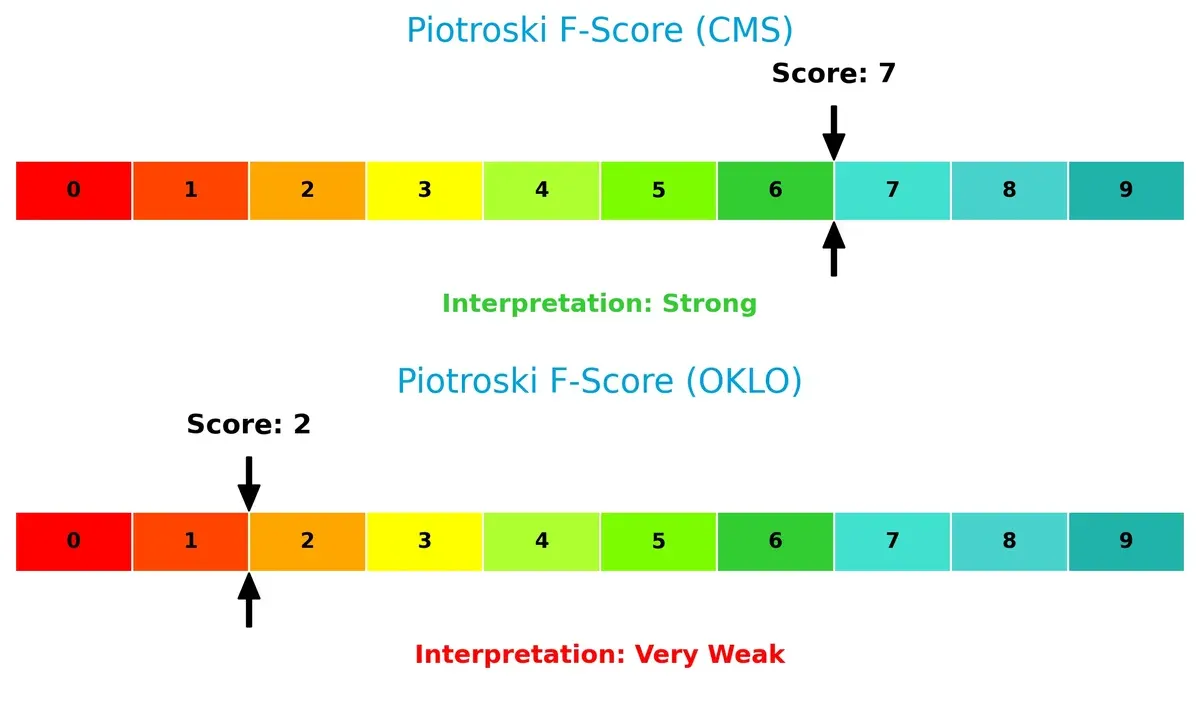
Financial Health: Quality of Operations
CMS’s Piotroski F-Score of 7 reflects strong internal financial health, suggesting operational efficiency and solid fundamentals. Oklo’s low score of 2 raises red flags about its financial quality and potential distress compared to CMS:
How are the two companies positioned?
This section dissects the operational DNA of CMS and Oklo by comparing their revenue distribution by segment and internal dynamics. The goal is to confront their economic moats and identify which model delivers the most resilient competitive advantage today.
Revenue Segmentation: The Strategic Mix
The following visual comparison dissects how both firms diversify their income streams and where their primary sector bets lie:

CMS Energy Corporation anchors its revenue in Residential Utility Services, generating $3.75B in 2024, dwarfing its Commercial ($2.11B) and Industrial ($720M) segments. This concentration reveals a reliance on household energy consumption with steady cash flows but exposes the firm to residential demand fluctuations. Oklo Inc. lacks available data, preventing direct comparison. CMS’s portfolio reflects infrastructure dominance with moderate diversification, balancing concentration risk amid evolving energy markets.
Strengths and Weaknesses Comparison
This table compares the Strengths and Weaknesses of CMS Energy Corporation and Oklo Inc.:
CMS Strengths
- Diversified utility services with strong residential segment
- Favorable net margin at 12.54%
- Favorable quick ratio at 1.34
- Dividend yield of 3.1% supports income investors
Oklo Strengths
- Very low debt-to-equity at 0.01
- Favorable weighted average cost of capital at 7.41%
- Favorable quick ratio at 43.47
- Price-to-earnings ratio favorable despite negative earnings
CMS Weaknesses
- Unfavorable return on invested capital at 3.71% below WACC
- High debt-to-equity of 2.12 signals leverage risk
- Low asset and fixed asset turnover ratios indicate weak operational efficiency
Oklo Weaknesses
- Negative profitability metrics with net margin at 0% and ROE at -29.35%
- Unfavorable price-to-book ratio at 8.37 suggests overvaluation
- Poor asset turnover and no dividend yield highlight operational and shareholder return challenges
CMS shows solid profitability and diversified revenue but struggles with capital efficiency and leverage. Oklo’s balance sheet is conservatively financed but faces steep profitability and operational hurdles, reflecting early-stage or turnaround risks.
The Moat Duel: Analyzing Competitive Defensibility
A structural moat is the only thing protecting long-term profits from the relentless erosion of competition. Let’s dissect the moat dynamics of two energy firms:
CMS Energy Corporation: Infrastructure-Heavy Utility Moat
CMS relies on regulated electric and gas utility assets, creating high switching costs through vast distribution networks. Its steady margins reflect this, but declining ROIC signals weakening competitive leverage. Expansion into renewables could stabilize the moat in 2026, yet value destruction persists.
Oklo Inc.: Emerging Technology Innovation Moat
Oklo’s competitive edge stems from cutting-edge fission power technology, differentiating it from CMS’s traditional infrastructure moat. Despite current value destruction, Oklo’s improving ROIC trend signals potential moat strengthening as it commercializes new nuclear solutions and disrupts energy markets.
Infrastructure Entrenchment vs. Technological Disruption
CMS’s entrenched utility network offers a wider moat through regulatory protection and scale, but deteriorating profitability raises caution. Oklo’s narrower moat currently lacks scale but shows a deeper trajectory of improvement. I see Oklo better positioned to build a sustainable moat defending future market share.
Which stock offers better returns?
The past year shows distinct price trajectories for CMS Energy Corporation and Oklo Inc., marked by strong overall gains but recent downward shifts in both stocks’ trading patterns.
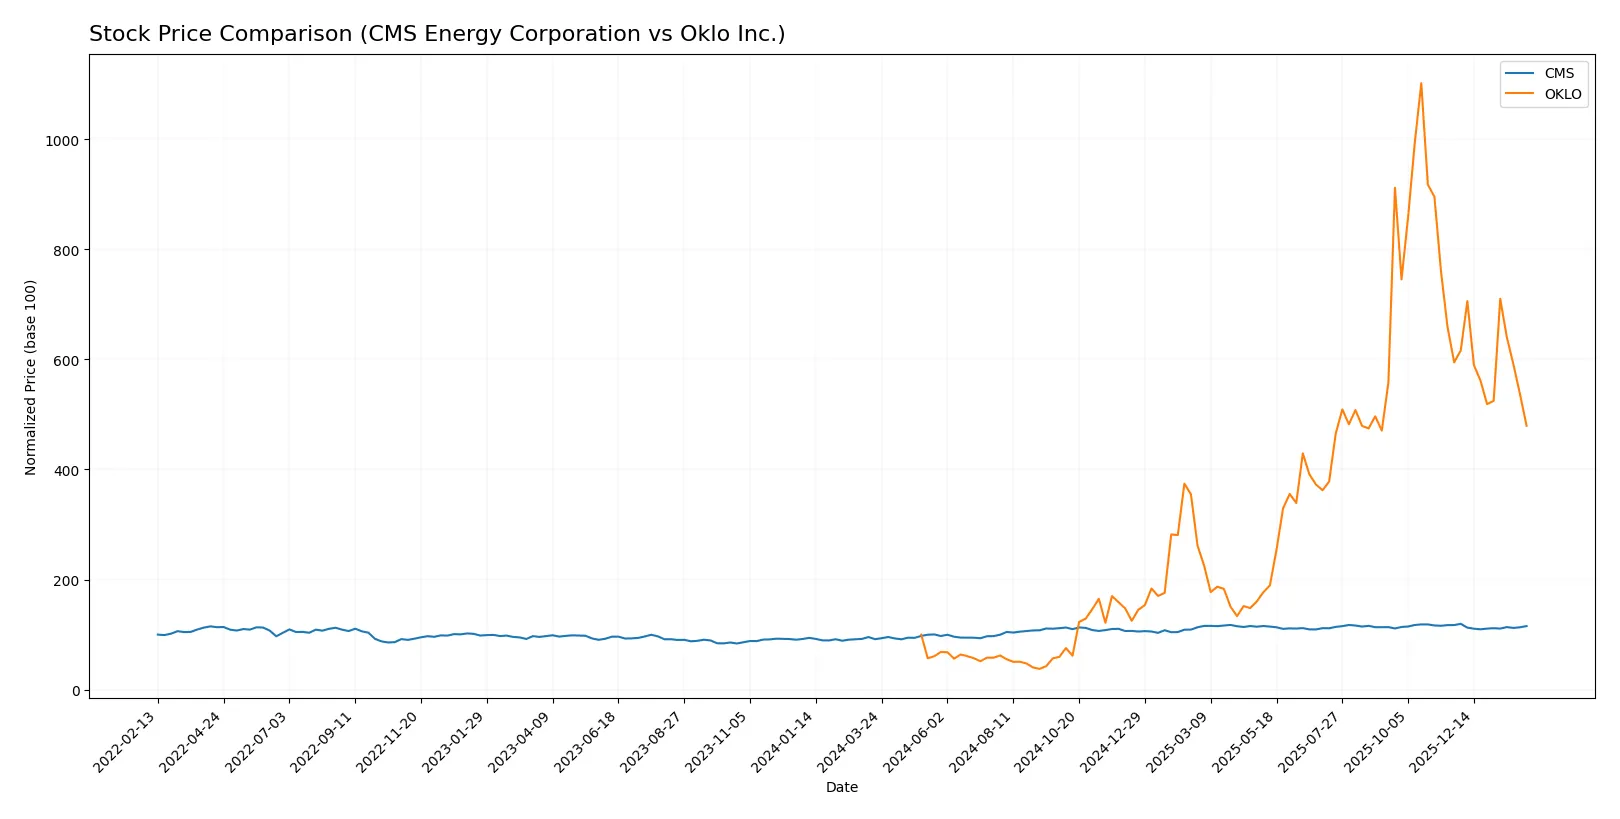
Trend Comparison
CMS Energy Corporation’s stock rose 26.0% over the past 12 months, indicating a bullish trend with decelerating momentum and a peak price of 75.44. Recent weeks show a mild negative trend of -1.62%.
Oklo Inc. delivered a robust 379.4% gain in the last year, reflecting a strong bullish trend despite deceleration and high volatility. However, its recent 19.4% decline signals intensified selling pressure.
Oklo’s stock outperformed CMS significantly over the year, though both experienced recent price declines; Oklo’s larger gains indicate superior market performance through 2026.
Target Prices
Analysts present a bullish consensus for CMS Energy Corporation and Oklo Inc., projecting significant upside relative to current prices.
| Company | Target Low | Target High | Consensus |
|---|---|---|---|
| CMS Energy Corporation | 74 | 82 | 78.14 |
| Oklo Inc. | 95 | 150 | 125.67 |
CMS’s target consensus sits roughly 7% above its current price of 72.84, indicating moderate upside. Oklo’s consensus target exceeds its current 71.1 price by over 75%, reflecting strong growth expectations.

Don’t Let Luck Decide Your Entry Point
Optimize your entry points with our advanced ProRealTime indicators. You’ll get efficient buy signals with precise price targets for maximum performance. Start outperforming now!
How do institutions grade them?
CMS Energy Corporation Grades
The following table summarizes recent institutional grades for CMS Energy Corporation:
| Grading Company | Action | New Grade | Date |
|---|---|---|---|
| Mizuho | Maintain | Neutral | 2026-02-06 |
| Morgan Stanley | Maintain | Equal Weight | 2026-02-02 |
| Jefferies | Maintain | Buy | 2026-01-28 |
| Wells Fargo | Maintain | Equal Weight | 2026-01-20 |
| JP Morgan | Maintain | Overweight | 2026-01-15 |
| Jefferies | Maintain | Buy | 2026-01-15 |
| Barclays | Maintain | Overweight | 2026-01-15 |
| UBS | Maintain | Neutral | 2025-12-17 |
| JP Morgan | Maintain | Overweight | 2025-12-11 |
| Morgan Stanley | Maintain | Equal Weight | 2025-10-22 |
Oklo Inc. Grades
The following table summarizes recent institutional grades for Oklo Inc.:
| Grading Company | Action | New Grade | Date |
|---|---|---|---|
| B of A Securities | Upgrade | Buy | 2026-01-21 |
| Seaport Global | Upgrade | Buy | 2025-12-08 |
| UBS | Maintain | Neutral | 2025-12-03 |
| Wedbush | Maintain | Outperform | 2025-11-12 |
| B. Riley Securities | Maintain | Buy | 2025-11-12 |
| B of A Securities | Maintain | Neutral | 2025-11-12 |
| B of A Securities | Downgrade | Neutral | 2025-09-30 |
| Seaport Global | Downgrade | Neutral | 2025-09-23 |
| Wedbush | Maintain | Outperform | 2025-09-22 |
| Wedbush | Maintain | Outperform | 2025-08-14 |
Which company has the best grades?
CMS Energy consistently holds neutral to overweight ratings, with several buy grades, indicating moderate confidence. Oklo shows more volatility but recent upgrades to buy and outperform suggest stronger momentum. Investors may weigh CMS’s stability against Oklo’s improving outlook.
Risks specific to each company
The following categories identify the critical pressure points and systemic threats facing CMS Energy Corporation and Oklo Inc. in the 2026 market environment:
1. Market & Competition
CMS Energy Corporation
- Established utility with a stable customer base in Michigan faces regulated competition.
Oklo Inc.
- Emerging nuclear tech firm with innovative but unproven market position competes in a niche with high barriers.
2. Capital Structure & Debt
CMS Energy Corporation
- High debt-to-equity ratio (2.12) signals leverage risk despite interest coverage of 2.58.
Oklo Inc.
- Minimal debt (0.01 D/E) provides financial flexibility but zero interest coverage reveals fragile earnings.
3. Stock Volatility
CMS Energy Corporation
- Low beta (0.48) indicates stable stock less sensitive to market swings.
Oklo Inc.
- Higher beta (0.77) reflects more volatile stock price, amplified by wide trading range (17.42–193.84).
4. Regulatory & Legal
CMS Energy Corporation
- Subject to established utility regulations in Michigan with predictable compliance costs.
Oklo Inc.
- Faces uncertain regulatory environment for nuclear innovation and licensing hurdles.
5. Supply Chain & Operations
CMS Energy Corporation
- Operates extensive electric and gas infrastructure, exposed to aging asset risks.
Oklo Inc.
- Relies on advanced nuclear technologies with supply chain risks due to specialized components.
6. ESG & Climate Transition
CMS Energy Corporation
- Balances fossil and renewable sources; transition pressure from regulators and investors.
Oklo Inc.
- Positioned as a clean energy innovator but faces execution risks in scaling climate-friendly tech.
7. Geopolitical Exposure
CMS Energy Corporation
- Primarily U.S.-focused with limited geopolitical risk.
Oklo Inc.
- U.S.-based but dependent on global nuclear material supply chains, sensitive to geopolitical tensions.
Which company shows a better risk-adjusted profile?
CMS faces leverage and operational aging risks but benefits from a stable, regulated market and low stock volatility. Oklo’s minimal debt and innovative positioning are offset by severe profitability issues, regulatory uncertainty, and extreme stock volatility. CMS’s Altman Z-score indicates distress risk, while Oklo scores safe, yet its poor profitability and Piotroski score imply financial weakness. Overall, CMS presents a more balanced risk profile for cautious investors, while Oklo’s profile suits risk-tolerant speculators betting on nuclear innovation breakthroughs.
Final Verdict: Which stock to choose?
CMS Energy Corporation’s superpower lies in its solid income generation and stable cash flow, making it a reliable dividend payer. Its main point of vigilance is the declining return on invested capital, signaling potential value erosion. CMS suits portfolios focused on income stability with moderate growth ambitions.
Oklo Inc. offers a strategic moat through its cutting-edge technology and minimal debt, appealing for long-term innovation plays. Despite current negative profitability, its improving ROIC trend suggests emerging operational leverage. Oklo fits portfolios aiming for high-risk, high-reward exposure in transformative sectors.
If you prioritize steady income and a proven cash machine, CMS is the compelling choice due to its favorable earnings quality and dividend yield. However, if you seek growth through technological innovation with tolerance for volatility, Oklo offers superior upside potential despite current financial challenges. Both require careful risk assessment aligned with your investment horizon.
Disclaimer: Investment carries a risk of loss of initial capital. The past performance is not a reliable indicator of future results. Be sure to understand risks before making an investment decision.
Go Further
I encourage you to read the complete analyses of CMS Energy Corporation and Oklo Inc. to enhance your investment decisions: