Home > Comparison > Utilities > NEE vs CMS
The strategic rivalry between NextEra Energy, Inc. and CMS Energy Corporation shapes the Utilities sector’s future. NextEra operates as a capital-intensive clean energy leader with vast renewable assets. CMS combines electric and gas utilities, focusing on regional energy delivery and diversified fuel sources. This head-to-head pits scale and innovation against operational diversity. This analysis evaluates which company’s strategy offers superior risk-adjusted returns for a well-balanced portfolio in 2026.

Table of contents
Companies Overview
NextEra Energy and CMS Energy stand as pivotal players in the regulated electric utility market, shaping energy supply in key U.S. regions.
NextEra Energy, Inc.: Clean Energy Powerhouse
NextEra Energy dominates as a regulated electric utility with a vast portfolio spanning wind, solar, nuclear, coal, and gas generation. Its core revenue derives from generating, transmitting, and distributing electricity to 11M customers, plus wholesale markets. In 2026, it emphasizes expanding renewable generation and battery storage, reinforcing its clean energy leadership.
CMS Energy Corporation: Michigan’s Energy Backbone
CMS Energy primarily serves Michigan through its electric and gas utility segments, generating revenue by distributing electricity and natural gas to 3.7M customers. It operates a broad infrastructure of generation sources including coal, wind, gas, and nuclear. Its 2026 strategic focus targets integrated energy services and renewable power development within a regional footprint.
Strategic Collision: Similarities & Divergences
Both firms operate regulated utilities with mixed generation assets, yet NextEra leans heavily on renewables nationwide while CMS concentrates regionally with a balanced fuel mix. Their primary battleground lies in expanding clean energy capacity and customer reach under regulatory frameworks. NextEra’s scale and innovation contrast with CMS’s stable, localized utility model, defining distinct investment profiles for growth versus steadiness.
Income Statement Comparison
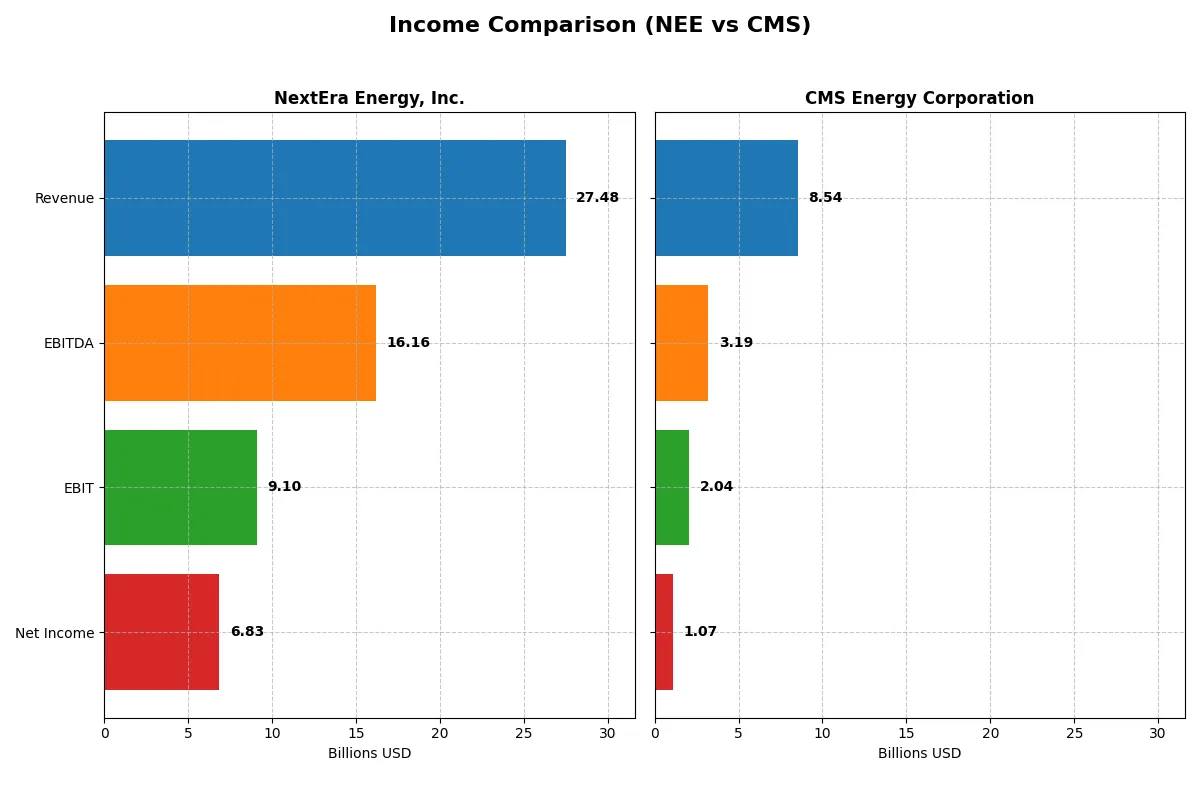
This data dissects the core profitability and scalability of both corporate engines to reveal who dominates the bottom line:
| Metric | NextEra Energy, Inc. (NEE) | CMS Energy Corporation (CMS) |
|---|---|---|
| Revenue | 27.48B | 8.54B |
| Cost of Revenue | 10.22B | 3.34B |
| Operating Expenses | 8.98B | 3.47B |
| Gross Profit | 17.26B | 5.20B |
| EBITDA | 16.17B | 3.19B |
| EBIT | 9.10B | 2.04B |
| Interest Expense | 4.57B | 789M |
| Net Income | 6.83B | 1.07B |
| EPS | 3.31 | 3.53 |
| Fiscal Year | 2025 | 2025 |
Income Statement Analysis: The Bottom-Line Duel
This income statement comparison reveals which company operates its business with greater financial efficiency and profitability precision.
NextEra Energy, Inc. Analysis
NextEra Energy’s revenue climbed steadily from 17B in 2021 to 27.5B in 2025, with net income nearly doubling from 3.57B to 6.83B. The company maintains strong gross and net margins, 62.8% and 24.9% respectively in 2025, demonstrating robust cost control despite an unfavorable interest expense ratio. Efficiency gains slowed slightly in the latest year, with net margin dipping 11.4%.
CMS Energy Corporation Analysis
CMS Energy posted revenue growth from 7.3B in 2021 to 8.5B in 2025, a modest scale increase. Net income, however, declined overall, slipping from 1.35B in 2021 to 1.06B in 2025, with a 12.5% net margin that trails NextEra’s by a wide margin. The company improved gross profit sharply in 2025 but faces pressure from rising operating expenses and a shrinking net margin over the period.
Margin Strength vs. Revenue Expansion
NextEra Energy clearly outperforms CMS in both scale and profitability, with superior margin control and a near doubling of net income. CMS shows revenue gains but struggles to convert sales into bottom-line growth. For investors prioritizing resilient earnings growth and margin strength, NextEra’s profile commands greater appeal.
Financial Ratios Comparison
These vital ratios act as a diagnostic tool to expose the underlying fiscal health, valuation premiums, and capital efficiency of the companies compared below:
| Ratios | NextEra Energy, Inc. (NEE) | CMS Energy Corporation (CMS) |
|---|---|---|
| ROE | 12.5% | 12.0% |
| ROIC | 4.2% | 3.7% |
| P/E | 24.5 | 19.5 |
| P/B | 3.07 | 2.34 |
| Current Ratio | 0.60 | 1.34 |
| Quick Ratio | 0.49 | 1.34 |
| D/E (Debt-to-Equity) | 1.75 | 2.12 |
| Debt-to-Assets | 45.0% | 47.3% |
| Interest Coverage | 1.81 | 2.19 |
| Asset Turnover | 0.13 | 0.21 |
| Fixed Asset Turnover | 0.18 | 0.28 |
| Payout Ratio | 68.5% | 60.5% |
| Dividend Yield | 2.79% | 3.10% |
| Fiscal Year | 2025 | 2025 |
Efficiency & Valuation Duel: The Vital Signs
Financial ratios act like a company’s DNA, exposing hidden risks and operational strengths essential for investment decisions.
NextEra Energy, Inc.
NextEra’s ROE of 12.5% signals moderate profitability, but its ROIC at 4.2% falls below the 6.5% WACC, indicating weak capital efficiency. The stock trades at a neutral P/E of 24.5 but a stretched P/B of 3.07. A 2.79% dividend yield supports steady shareholder returns despite operational challenges.
CMS Energy Corporation
CMS posts a comparable ROE of 12.0% with a slightly lower ROIC of 3.7%, also lagging its 5.0% WACC, reflecting limited capital returns. Its valuation is more attractive with a P/E of 19.5 and a neutral P/B of 2.34. A 3.1% dividend yield enhances income appeal amid balanced liquidity ratios.
Moderate Risk Meets Valuation Discipline
NextEra’s higher valuation contrasts with weaker capital returns and poor liquidity, raising caution flags. CMS offers a better liquidity profile and a more reasonable valuation, balancing risks and rewards. Investors favoring income with operational stability may lean toward CMS’s profile.
Which one offers the Superior Shareholder Reward?
I compare NextEra Energy (NEE) and CMS Energy (CMS) on dividends, payout ratios, and buybacks. NEE yields ~2.8% with a high payout ratio (~68%), but negative free cash flow per share (-5.8) signals risk in sustaining dividends. CMS pays a slightly higher yield (~3.1%) with a lower payout (~60%) and strong free cash flow (7.5B), supporting sustainability. CMS’s robust buyback activity complements dividends, while NEE’s negative free cash flow constrains buybacks. I see CMS’s balanced distribution and stronger cash flow as offering a more sustainable, attractive total return in 2026.
Comparative Score Analysis: The Strategic Profile
The radar chart reveals the fundamental DNA and trade-offs of NextEra Energy, Inc. and CMS Energy Corporation:
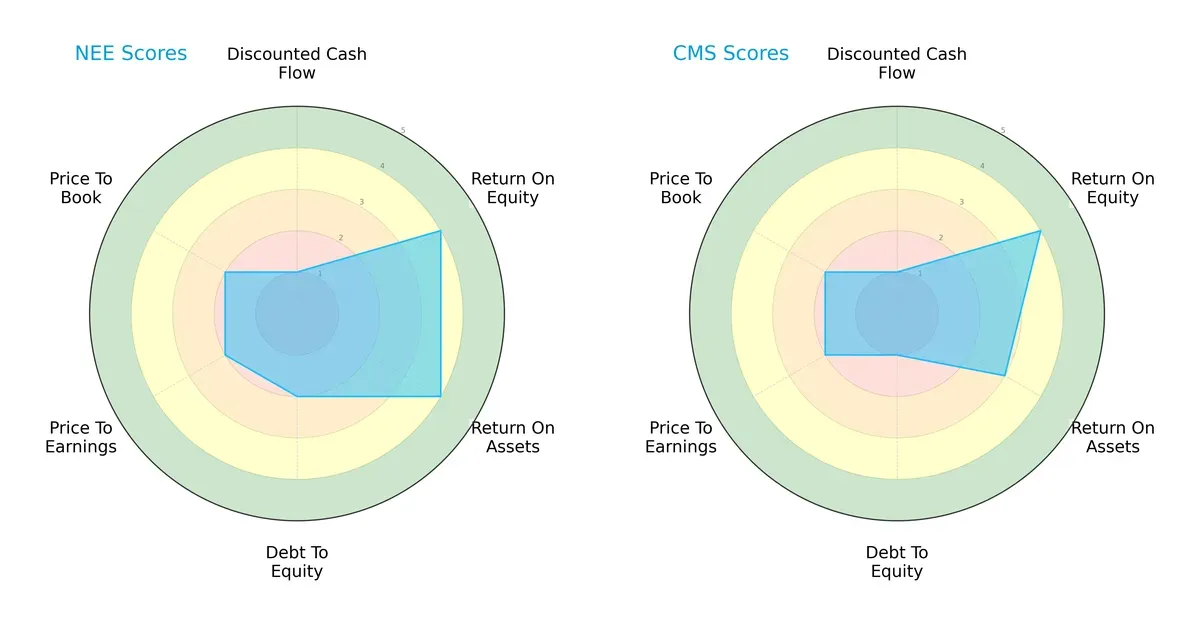
NextEra Energy demonstrates superior asset efficiency with ROA and ROE scores at 4, while CMS has a slightly lower ROA of 3. Both companies share a weak discounted cash flow score of 1, indicating valuation concerns. NextEra carries moderate financial risk with a debt-to-equity score of 2, whereas CMS shows higher leverage risk at 1. Valuation metrics (P/E and P/B) are equally unfavorable for both. Overall, NextEra presents a more balanced profile; CMS relies heavily on equity returns but struggles with leverage.
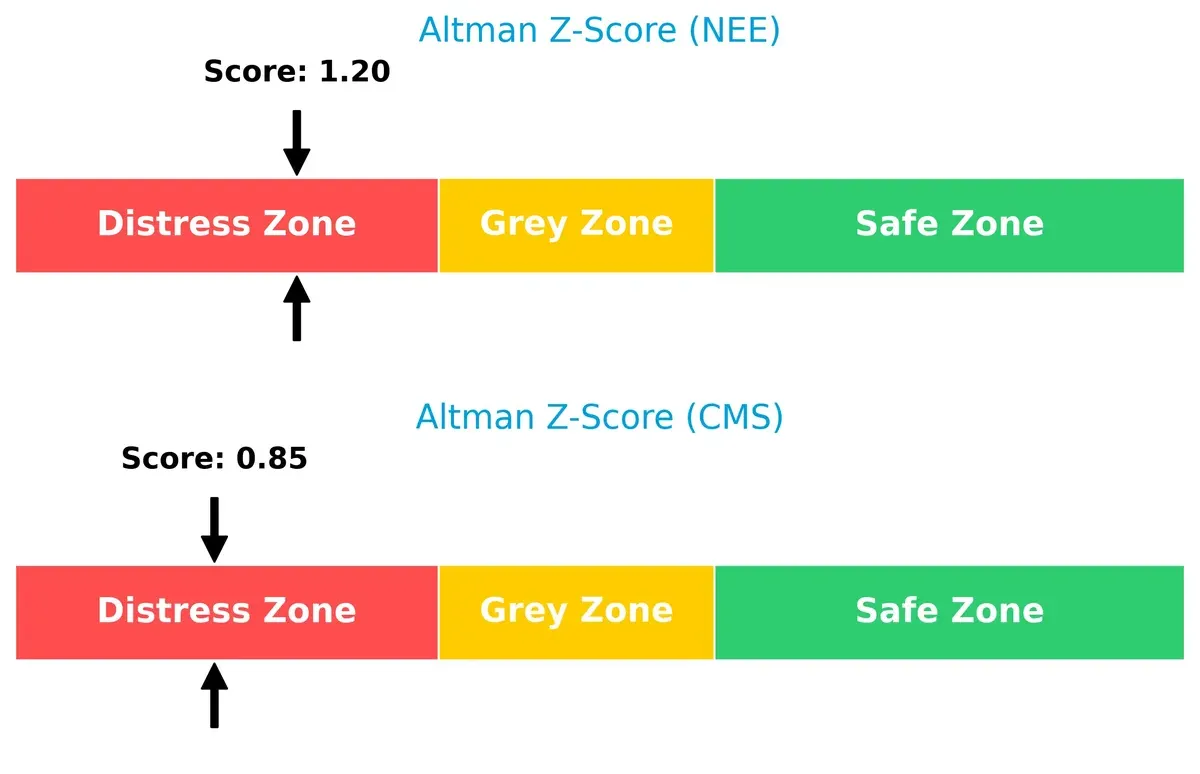
Bankruptcy Risk: Solvency Showdown
NextEra’s Altman Z-Score of 1.20 slightly outperforms CMS’s 0.85, both residing in the distress zone. This signals elevated bankruptcy risk for both firms in the current economic cycle:
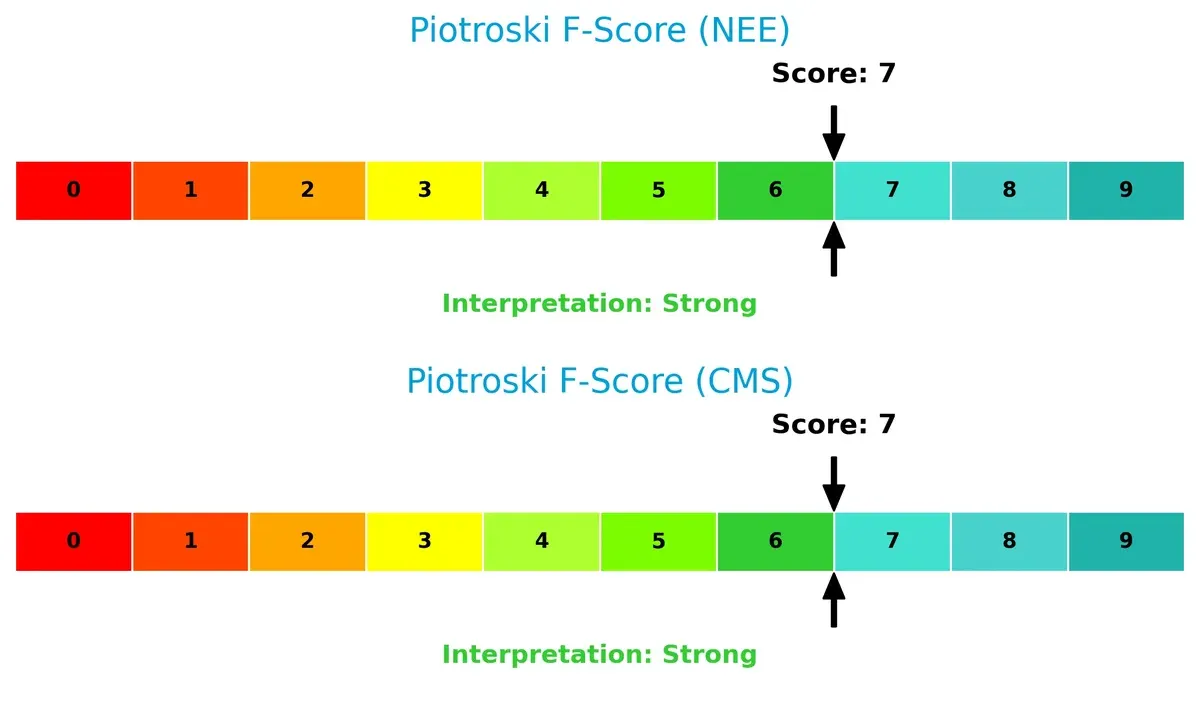
Financial Health: Quality of Operations
Both NextEra and CMS score 7 on the Piotroski F-Score, reflecting strong financial health with no major red flags in profitability, liquidity, or operational efficiency:
How are the two companies positioned?
This section dissects the operational DNA of NEE and CMS by comparing their revenue distribution by segment alongside their internal strengths and weaknesses. The final goal is to confront their economic moats and reveal which model delivers the most resilient, sustainable competitive edge today.
Revenue Segmentation: The Strategic Mix
This visual comparison dissects how NextEra Energy and CMS Energy diversify their income streams and where their primary sector bets lie:
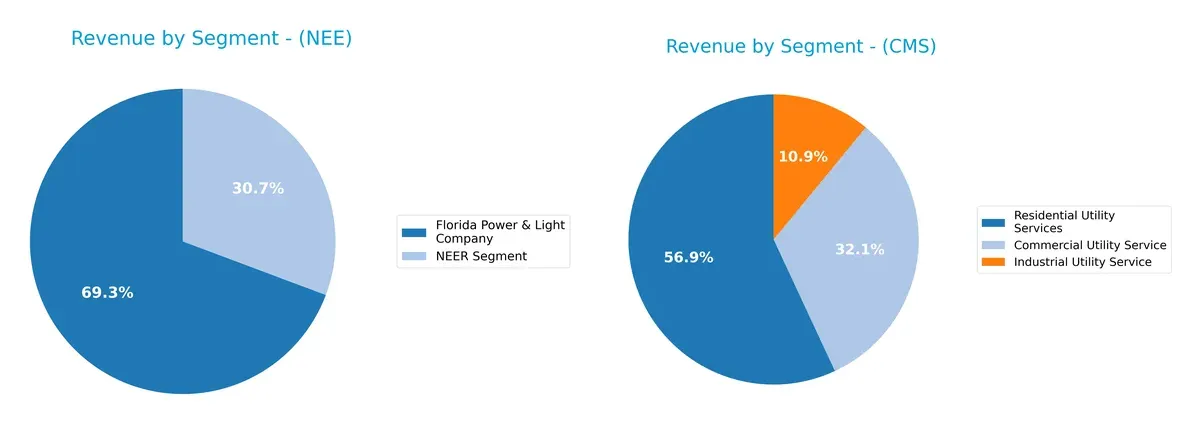
NextEra Energy anchors its revenue in the Florida Power & Light Company with $17B, while its NextEra Energy Resources segment adds $7.5B, showing a two-pronged strategy. CMS Energy displays a more balanced mix, with Residential Utility Services at $3.75B, Commercial at $2.1B, and Industrial at $720M. NextEra’s focus signals infrastructure dominance in Florida, while CMS’s spread reduces concentration risk with broader customer exposure.
Strengths and Weaknesses Comparison
This table compares the strengths and weaknesses of NextEra Energy, Inc. and CMS Energy Corporation:
NEE Strengths
- Strong net margin at 24.87%
- Favorable dividend yield of 2.79%
- Large revenue base dominated by Florida Power & Light segment
CMS Strengths
- Favorable net margin at 12.54%
- Healthy current and quick ratios at 1.34
- Higher dividend yield of 3.1%
- Balanced revenue across commercial, industrial, and residential services
NEE Weaknesses
- Low liquidity with current ratio 0.6 and quick ratio 0.49
- High debt-to-equity at 1.75
- Unfavorable ROIC below WACC (4.23% vs 6.48%)
- Poor asset turnover ratios
CMS Weaknesses
- Elevated debt-to-equity at 2.12
- Unfavorable ROIC below WACC (3.71% vs 5.02%)
- Asset turnover remains weak
- Interest coverage only neutral at 2.58
NextEra excels in profitability and dividend yield but struggles with liquidity and capital efficiency. CMS shows more balanced liquidity and slightly better capital structure metrics but faces similar challenges in asset utilization. Both companies must address efficiency to enhance long-term returns.
The Moat Duel: Analyzing Competitive Defensibility
A structural moat is the only thing protecting long-term profits from relentless competition erosion. Let’s examine how these utilities defend their turf:
NextEra Energy, Inc.: Innovation-Driven Clean Energy Moat
NextEra’s moat stems from its intangible assets and cost advantage in renewable energy. It shows rising profitability despite current value destruction. New clean tech investments in 2026 could deepen its lead.
CMS Energy Corporation: Regional Utility Efficiency Moat
CMS relies on regulated utility scale and stable infrastructure. Unlike NextEra’s growth focus, CMS shows declining ROIC and value destruction. Expansion opportunities appear limited but steady cash flow remains an asset.
Innovation Edge vs. Regulated Stability: The Moat Showdown
NextEra’s growing returns and clean energy investments create a deeper, dynamic moat. CMS’s shrinking profitability and reliance on regulation present a narrower moat. NextEra is better positioned to defend and expand market share in evolving energy markets.
Which stock offers better returns?
The stock prices of NextEra Energy, Inc. and CMS Energy Corporation show distinct dynamics over the past year, with notable price gains and varying momentum profiles influencing market performance.
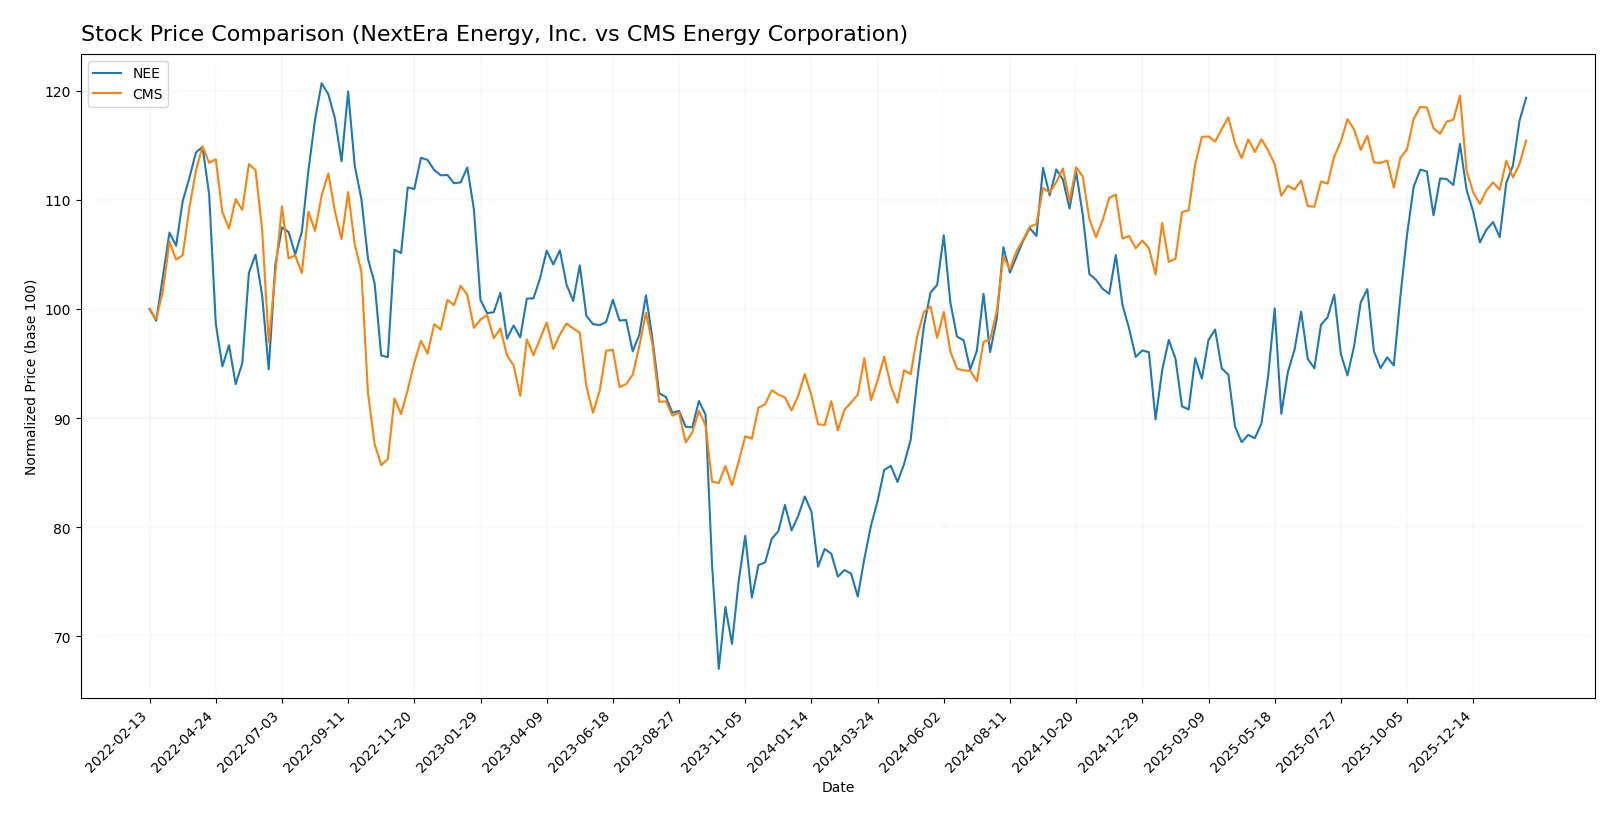
Trend Comparison
NextEra Energy’s stock rose 48.92% over the past year, indicating a strong bullish trend with accelerating gains and a high price range between 60.08 and 89.47. Volatility remains moderate with a 6.36% standard deviation.
CMS Energy’s stock increased 25.98% over the same period, confirming a bullish trend but with decelerating momentum. Its price fluctuated between 57.66 and 75.44 and showed lower volatility at 4.7%.
NextEra Energy outperformed CMS Energy with a higher total return and accelerating upward momentum, delivering the strongest market performance during this period.
Target Prices
Analysts present a clear consensus on target prices for NextEra Energy and CMS Energy, reflecting moderate upside potential.
| Company | Target Low | Target High | Consensus |
|---|---|---|---|
| NextEra Energy, Inc. | 84 | 104 | 93.09 |
| CMS Energy Corporation | 74 | 82 | 78.14 |
NextEra Energy’s consensus target of 93.09 suggests a slight upside from its current 89.47 price. CMS Energy’s consensus target of 78.14 also indicates potential appreciation from 72.84.

Don’t Let Luck Decide Your Entry Point
Optimize your entry points with our advanced ProRealTime indicators. You’ll get efficient buy signals with precise price targets for maximum performance. Start outperforming now!
How do institutions grade them?
NextEra Energy, Inc. Grades
Here are the latest institutional grades for NextEra Energy, Inc.:
| Grading Company | Action | New Grade | Date |
|---|---|---|---|
| Mizuho | Maintain | Neutral | 2026-01-28 |
| Argus Research | Maintain | Buy | 2026-01-28 |
| BMO Capital | Maintain | Outperform | 2026-01-27 |
| Wells Fargo | Maintain | Overweight | 2026-01-20 |
| Barclays | Maintain | Equal Weight | 2026-01-15 |
| Jefferies | Maintain | Hold | 2025-12-31 |
| UBS | Maintain | Buy | 2025-12-17 |
| JP Morgan | Maintain | Overweight | 2025-12-11 |
| UBS | Maintain | Buy | 2025-12-10 |
| BMO Capital | Maintain | Outperform | 2025-12-10 |
CMS Energy Corporation Grades
Here are the latest institutional grades for CMS Energy Corporation:
| Grading Company | Action | New Grade | Date |
|---|---|---|---|
| Mizuho | Maintain | Neutral | 2026-02-06 |
| Morgan Stanley | Maintain | Equal Weight | 2026-02-02 |
| Jefferies | Maintain | Buy | 2026-01-28 |
| Wells Fargo | Maintain | Equal Weight | 2026-01-20 |
| JP Morgan | Maintain | Overweight | 2026-01-15 |
| Jefferies | Maintain | Buy | 2026-01-15 |
| Barclays | Maintain | Overweight | 2026-01-15 |
| UBS | Maintain | Neutral | 2025-12-17 |
| JP Morgan | Maintain | Overweight | 2025-12-11 |
| Morgan Stanley | Maintain | Equal Weight | 2025-10-22 |
Which company has the best grades?
NextEra Energy, Inc. has more buy and outperform ratings from top firms, showing stronger institutional confidence. CMS Energy mostly holds equal weight and overweight grades, signaling a more cautious outlook. This contrast may influence investor sentiment and trading activity.
Risks specific to each company
The following categories identify critical pressure points and systemic threats facing NextEra Energy, Inc. and CMS Energy Corporation in the 2026 market environment:
1. Market & Competition
NextEra Energy, Inc.
- Dominates with 28.5GW capacity and diverse renewables, but faces fierce competition in clean energy markets.
CMS Energy Corporation
- Focuses on Michigan with smaller scale; competition limited regionally but growth constrained.
2. Capital Structure & Debt
NextEra Energy, Inc.
- High debt-to-equity (1.75) and weak interest coverage (1.99) raise financial risk concerns.
CMS Energy Corporation
- Higher leverage (2.12 DE) and distressed Altman Z-score indicate elevated bankruptcy risk.
3. Stock Volatility
NextEra Energy, Inc.
- Beta 0.76 shows moderate volatility, reflecting stable investor sentiment.
CMS Energy Corporation
- Lower beta at 0.48 suggests less market sensitivity and lower stock price swings.
4. Regulatory & Legal
NextEra Energy, Inc.
- Exposure to evolving US clean energy policies could impact capital projects and returns.
CMS Energy Corporation
- Regulatory environment focused on Michigan utilities; less exposed to federal policy shifts.
5. Supply Chain & Operations
NextEra Energy, Inc.
- Complex transmission network (77K circuit miles) risks operational disruptions but enables scale advantages.
CMS Energy Corporation
- Extensive local distribution assets benefit reliability but limit operational flexibility.
6. ESG & Climate Transition
NextEra Energy, Inc.
- Leading in renewables and battery storage; ESG profile strong but capital intensive.
CMS Energy Corporation
- Moderate renewables mix; transition risks manageable but slower decarbonization pace.
7. Geopolitical Exposure
NextEra Energy, Inc.
- Primarily US-focused; geopolitical risks limited to domestic policy and market factors.
CMS Energy Corporation
- Concentrated in Michigan, minimizing international geopolitical risks but increasing regional dependency.
Which company shows a better risk-adjusted profile?
NextEra’s biggest risk lies in its stretched capital structure and weak liquidity, exposing it to refinancing challenges amid rising rates. CMS faces severe financial distress risks, reflected in its lower Altman Z-score and higher leverage. Despite this, CMS’s operational focus and better liquidity ratios provide a more balanced risk profile. Recent data highlight CMS’s stronger current and quick ratios (1.34) versus NextEra’s weaker liquidity (0.6 current ratio), justifying my caution on NextEra’s financial health. Overall, CMS demonstrates a superior risk-adjusted profile in 2026.
Final Verdict: Which stock to choose?
NextEra Energy, Inc. stands out with its superpower in operational scale and robust income quality. Despite its value-destroying capital efficiency and liquidity concerns, it fuels growth with expanding profitability. NextEra suits investors aiming for aggressive growth but demands vigilance on its stretched balance sheet.
CMS Energy Corporation benefits from a strategic moat rooted in stable cash flow and a healthier liquidity position. Its more conservative financial profile offers relative safety compared to NextEra. CMS aligns well with growth-at-a-reasonable-price (GARP) investors prioritizing steadier returns and risk mitigation.
If you prioritize dynamic growth and can tolerate balance sheet risks, NextEra outshines with accelerating earnings momentum. However, if you seek better financial stability and consistent cash flow, CMS offers superior downside protection despite slower growth. Each fits distinctly different investor avatars, making the choice scenario-driven.
Disclaimer: Investment carries a risk of loss of initial capital. The past performance is not a reliable indicator of future results. Be sure to understand risks before making an investment decision.
Go Further
I encourage you to read the complete analyses of NextEra Energy, Inc. and CMS Energy Corporation to enhance your investment decisions: