Home > Comparison > Utilities > FE vs CMS
The strategic rivalry between FirstEnergy Corp. and CMS Energy Corporation shapes the utilities sector’s competitive landscape. FirstEnergy operates as a capital-intensive regulated electric utility with a broad geographic footprint and diverse power generation portfolio. CMS Energy combines regulated electric and gas utilities with a focus on Michigan’s market and renewable energy ventures. This analysis evaluates which company’s operational model presents a superior risk-adjusted investment opportunity for a diversified portfolio.
Table of contents
Companies Overview
FirstEnergy and CMS Energy stand as key players in the regulated electric utilities sector, shaping regional power markets.
FirstEnergy Corp.: Regional Power Giant
FirstEnergy dominates the regulated electric landscape in six states, serving 6M customers. Its core revenue stems from generating and distributing electricity through coal, nuclear, natural gas, and renewables. In 2026, it focuses on maintaining grid reliability while navigating energy transition challenges across 24K circuit miles of transmission and 273K miles of distribution lines.
CMS Energy Corporation: Michigan’s Energy Backbone
CMS Energy commands Michigan’s energy market with 1.9M electric and 1.8M gas customers. It earns revenue primarily via electric and gas utilities plus independent renewable power ventures. The 2026 strategy emphasizes expanding renewable generation while managing extensive electricity and gas infrastructure to balance customer demand and sustainability goals.
Strategic Collision: Similarities & Divergences
Both companies operate regulated utilities with mix-generation portfolios including renewables and fossil fuels. FirstEnergy emphasizes broad regional transmission and distribution scale; CMS integrates gas and electric utilities with a stronger renewables push. They compete on reliability and sustainable delivery but differ in customer base size and fuel mix. Their investment profiles reflect distinct operational footprints and energy transition approaches.
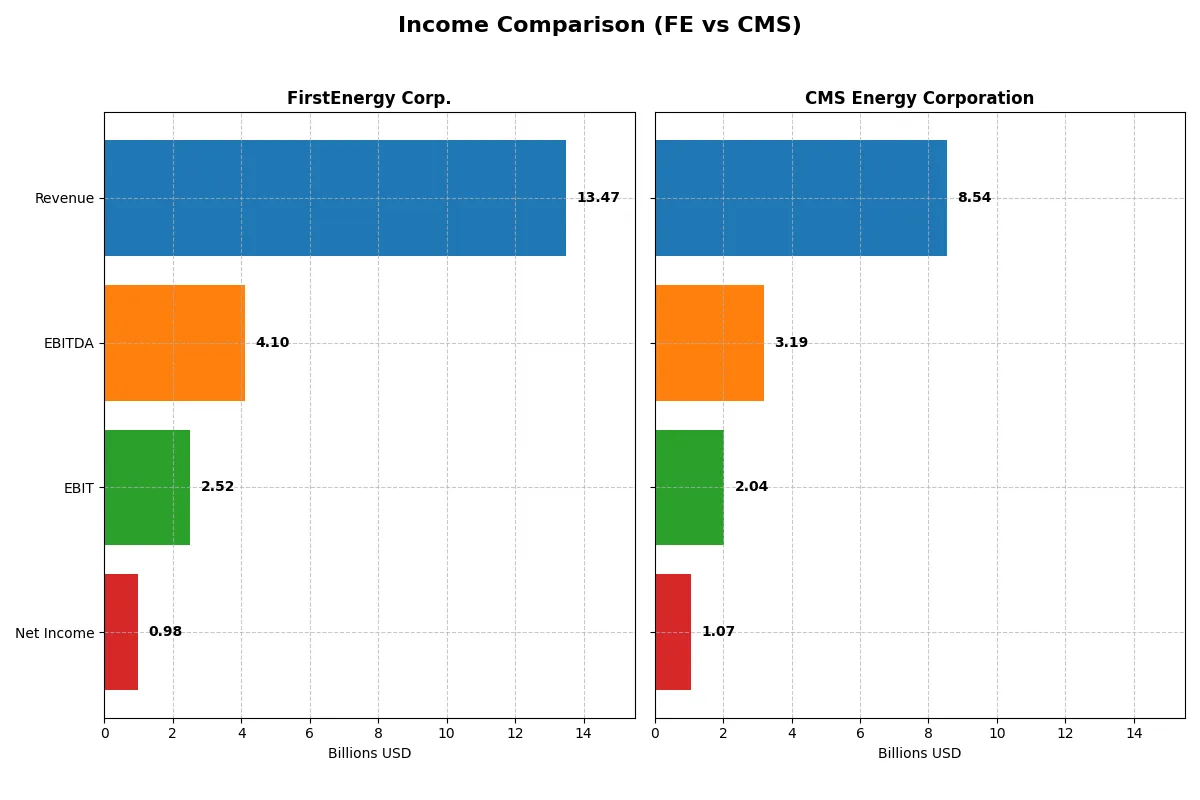
Income Statement Comparison
This data dissects the core profitability and scalability of both corporate engines to reveal who dominates the bottom line:
| Metric | FirstEnergy Corp. (FE) | CMS Energy Corporation (CMS) |
|---|---|---|
| Revenue | 13.47B | 7.52B |
| Cost of Revenue | 4.38B | 4.31B |
| Operating Expenses | 6.72B | 1.72B |
| Gross Profit | 9.10B | 3.21B |
| EBITDA | 4.10B | 3.07B |
| EBIT | 2.52B | 1.83B |
| Interest Expense | 1.01B | 708M |
| Net Income | 978M | 1.00B |
| EPS | 1.70 | 3.33 |
| Fiscal Year | 2024 | 2024 |
Income Statement Analysis: The Bottom-Line Duel
This comparison reveals which company converts revenue into profit with greater efficiency and sustainable margin strength.
FirstEnergy Corp. Analysis
FirstEnergy’s revenue rose steadily from 10.8B in 2020 to 13.5B in 2024, yet net income declined from 1.08B to 978M. Its gross margin holds firm above 67%, but net margin shrank to 7.26%, reflecting increased operating costs. In 2024, sluggish EBIT growth and falling EPS highlight margin pressure despite revenue gains.
CMS Energy Corporation Analysis
CMS grew revenue from 7.3B in 2021 to 8.5B in 2025, with net income dipping from 1.35B to 1.06B. It sustains a solid gross margin near 61% and superior net margin of 12.54%. The recent year shows robust revenue and EBIT growth, alongside EPS improvement, signaling operational momentum despite slight net margin compression.
Margin Resilience vs. Earnings Momentum
CMS outperforms with higher net margins (12.5% vs. 7.3%) and stronger recent earnings growth, while FirstEnergy boasts larger revenue scale but weakening profitability. CMS’s profile appeals more to investors prioritizing margin quality and earnings momentum over pure revenue size.
Financial Ratios Comparison
These vital ratios act as a diagnostic tool to expose the underlying fiscal health, valuation premiums, and capital efficiency of the companies compared:
| Ratios | FirstEnergy Corp. (FE) | CMS Energy Corporation (CMS) |
|---|---|---|
| ROE | 7.85% | 12.01% |
| ROIC | 3.66% | 3.71% |
| P/E | 23.39 | 19.49 |
| P/B | 1.84 | 2.34 |
| Current Ratio | 0.56 | 1.34 |
| Quick Ratio | 0.45 | 1.34 |
| D/E | 1.95 | 2.12 |
| Debt-to-Assets | 46.63% | 47.31% |
| Interest Coverage | 2.35 | 2.19 |
| Asset Turnover | 0.26 | 0.21 |
| Fixed Asset Turnover | 0.33 | 0.28 |
| Payout ratio | 99.18% | 60.48% |
| Dividend yield | 4.24% | 3.10% |
| Fiscal Year | 2024 | 2025 |
Efficiency & Valuation Duel: The Vital Signs
Financial ratios serve as a company’s DNA, unveiling hidden risks and operational strengths that shape investor decisions.
FirstEnergy Corp.
FirstEnergy exhibits a modest 7.85% ROE and a neutral 23.39 P/E, signaling average profitability and valuation. Margins at 7.26% show operational stability, but its high debt-to-equity ratio of 1.95 and low current ratio of 0.56 raise liquidity concerns. The firm rewards shareholders with a strong 4.24% dividend yield, indicating steady income focus over growth reinvestment.
CMS Energy Corporation
CMS posts a healthier 12.01% ROE and a lower 19.49 P/E, reflecting better profitability and a more attractive valuation. Its net margin of 12.54% confirms operational efficiency. The current and quick ratios above 1.3 highlight sound liquidity, despite a slightly elevated debt-to-equity of 2.12. CMS offers a 3.1% dividend yield, balancing shareholder returns with growth potential.
Balanced Operational Efficiency vs. Dividend Stability
CMS delivers superior profitability and liquidity, offering a more balanced risk-reward profile. FirstEnergy’s stronger dividend yield appeals to income-focused investors but carries liquidity and leverage risks. Investors seeking operational strength may prefer CMS, while those prioritizing dividend income may lean toward FirstEnergy.
Which one offers the Superior Shareholder Reward?
I compare FirstEnergy Corp. (FE) and CMS Energy Corporation (CMS) on dividends, payout ratios, and buybacks. FE yields 4.24% with a payout ratio near 99%, but suffers negative free cash flow (-$2/share). CMS yields 3.10% with a 60% payout ratio and positive free cash flow ($7.49/share). FE’s dividend sustainability is questionable given persistent negative free cash flow and a high payout. CMS reinvests excess cash prudently, balancing dividends and growth. FE’s buybacks are limited by cash constraints; CMS shows stronger operating cash flow supporting shareholder returns. I find CMS’s distribution model more sustainable, offering a superior total return profile in 2026.
Comparative Score Analysis: The Strategic Profile
The radar chart reveals the fundamental DNA and trade-offs of FirstEnergy Corp. and CMS Energy Corporation, highlighting their financial strengths and vulnerabilities:

FirstEnergy (FE) demonstrates a more balanced profile with favorable discounted cash flow and return on equity scores. CMS (CMS) matches FE in ROE but lags significantly in DCF, indicating weaker future cash flow prospects. Both firms share very unfavorable debt-to-equity scores, signaling elevated financial risk. Valuation metrics (PE/PB) are equally unfavorable, suggesting market discounts. FE’s diversified strengths contrast with CMS’s reliance on operational efficiency.
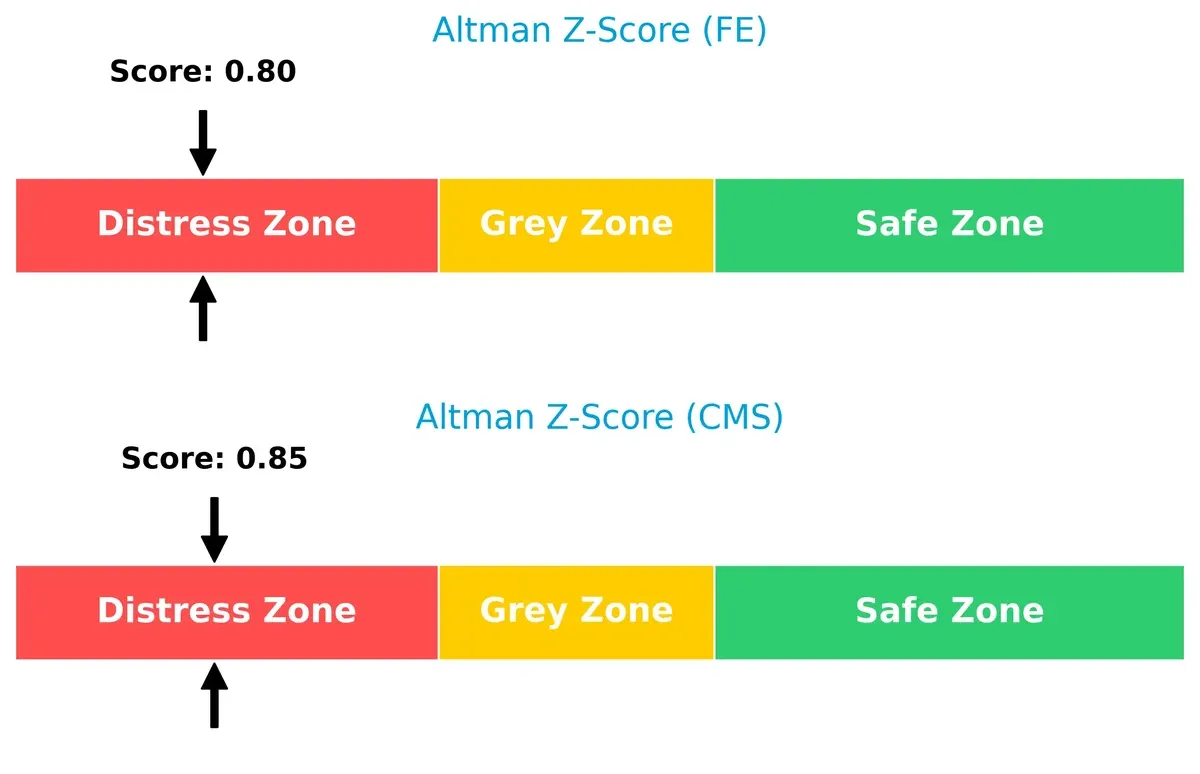
Bankruptcy Risk: Solvency Showdown
Both FirstEnergy and CMS fall within the Altman Z-Score distress zone, signaling high bankruptcy risk and caution for long-term survival in this cycle:
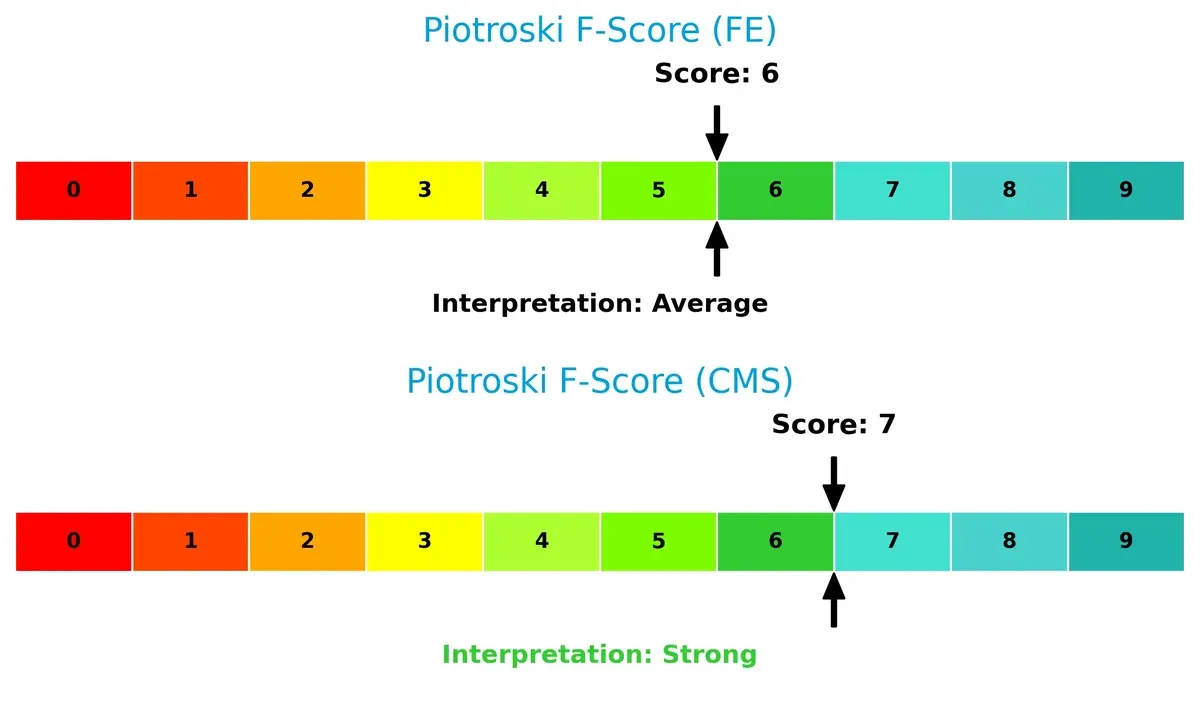
Financial Health: Quality of Operations
CMS edges out FirstEnergy in financial health with a Piotroski F-Score of 7 versus FE’s 6, reflecting stronger internal metrics and operational quality. FE’s average score raises modest red flags compared to CMS’s stronger financial footing:
How are the two companies positioned?
This section dissects the operational DNA of FE and CMS by comparing their revenue distribution and internal dynamics—strengths and weaknesses. The goal is to confront their economic moats to identify which model offers the most resilient, sustainable competitive advantage today.
Revenue Segmentation: The Strategic Mix
This visual comparison dissects how FirstEnergy Corp. and CMS Energy diversify income streams, revealing where each anchors its primary sector bets:
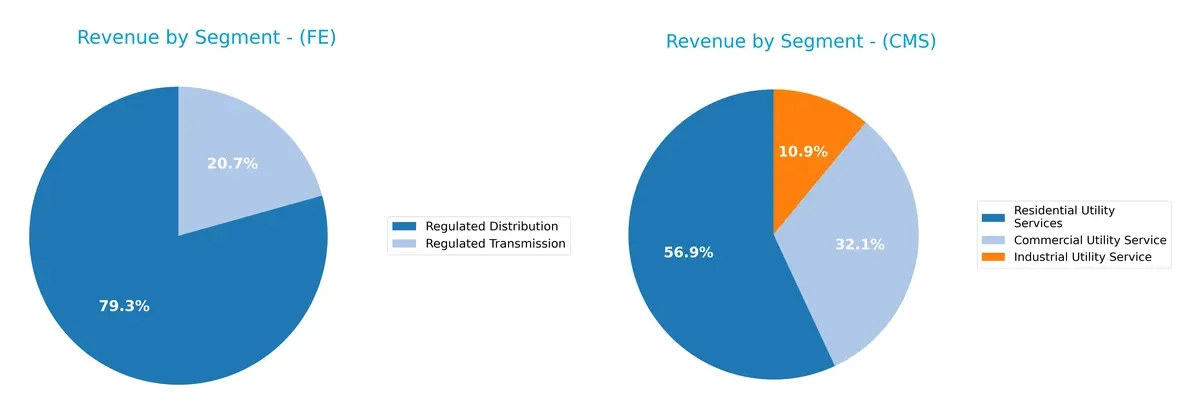
FirstEnergy Corp. leans heavily on Regulated Distribution, generating $6.9B in 2024, dwarfing its $1.8B Regulated Transmission segment. CMS Energy shows a more balanced mix, with $3.7B Residential, $2.1B Commercial, and $0.7B Industrial Utility Services. FE’s concentration signals infrastructure dominance but raises concentration risk. CMS’s spread suggests resilience across customer types, reducing dependency on any single segment.
Strengths and Weaknesses Comparison
This table compares the Strengths and Weaknesses of FirstEnergy Corp. (FE) and CMS Energy Corporation (CMS):
FE Strengths
- Strong dividend yield at 4.24%
- Favorable WACC at 4.88%
- Large regulated distribution revenue stream
CMS Strengths
- Higher net margin at 12.54%
- Favorable quick ratio at 1.34
- Favorable WACC at 5.02%
- Diversified utility services including residential, commercial, industrial
FE Weaknesses
- Unfavorable ROE at 7.85% and ROIC at 3.66%
- Low liquidity ratios (current 0.56, quick 0.45)
- High debt-to-equity at 1.95
- Unfavorable asset turnover
CMS Weaknesses
- Unfavorable ROIC at 3.71%
- High debt-to-equity at 2.12
- Unfavorable asset turnover
- Neutral current ratio at 1.34
Both companies show strengths in capital cost management with favorable WACC figures. CMS exhibits better profitability and liquidity metrics, while FE relies on strong dividend yield and regulated revenue. Both face challenges in asset efficiency and leverage, which could influence their strategic focus on operational improvements and debt management.
The Moat Duel: Analyzing Competitive Defensibility
A structural moat is the only thing protecting long-term profits from relentless competition erosion. Let’s dissect how it shapes value for these utilities:
FirstEnergy Corp.: Scale and Infrastructure-Driven Moat
FirstEnergy’s competitive edge stems from its vast transmission and distribution network. This scale supports stable margins but declining ROIC signals weakening capital efficiency. New energy markets and renewables could either deepen or disrupt this moat in 2026.
CMS Energy Corporation: Integrated Utility Moat
CMS leverages a diversified utility model combining electric and gas services, creating higher margin stability than FirstEnergy. Despite a similar ROIC decline, CMS’s broader service base offers stronger growth potential through renewable investments and grid modernization.
Network Scale vs. Service Integration: The Moat Showdown
Both companies face value erosion with declining ROIC, yet CMS’s integrated utility model presents a wider moat. I see CMS better positioned to defend market share amid energy transition and regulatory shifts.
Which stock offers better returns?
Over the past 12 months, both FirstEnergy Corp. and CMS Energy Corporation exhibited strong price gains with distinct trading patterns and momentum shifts in recent weeks.
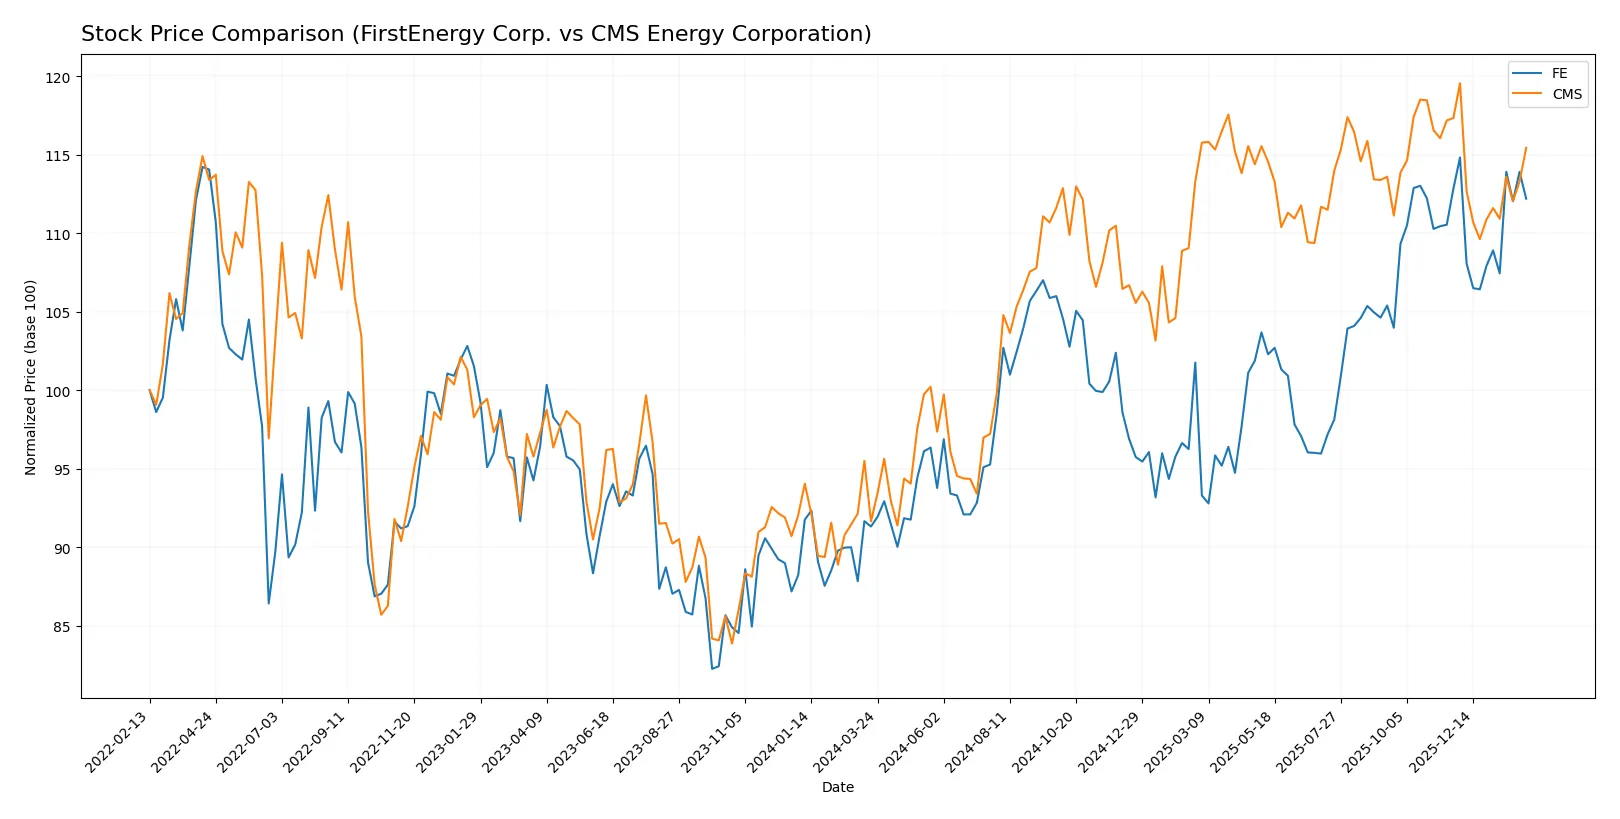
Trend Comparison
FirstEnergy Corp. shows a 22.87% price increase over the last year, confirming a bullish trend with accelerating momentum. The stock oscillated between $37.41 and $47.72, with moderate volatility (2.7 std deviation).
CMS Energy Corporation gained 25.98% over the same period, also bullish but with decelerating momentum. Price ranged from $57.66 to $75.44, displaying higher volatility (4.7 std deviation).
CMS outperformed FirstEnergy by nearly 3 percentage points over the year. Both stocks remain bullish, but CMS’s higher volatility and slowing acceleration suggest a more cautious outlook.
Target Prices
Analysts present a clear target consensus for FirstEnergy Corp. and CMS Energy Corporation.
| Company | Target Low | Target High | Consensus |
|---|---|---|---|
| FirstEnergy Corp. | 46 | 54 | 49.5 |
| CMS Energy Corporation | 74 | 82 | 78.14 |
The consensus target for FirstEnergy sits slightly above the current price of 46.63, implying modest upside. CMS shows a stronger potential gain, with targets well above its 72.84 share price.

Don’t Let Luck Decide Your Entry Point
Optimize your entry points with our advanced ProRealTime indicators. You’ll get efficient buy signals with precise price targets for maximum performance. Start outperforming now!
How do institutions grade them?
Institutional grading for FirstEnergy Corp. and CMS Energy Corporation shows varied analyst opinions:
FirstEnergy Corp. Grades
The table below summarizes recent institutional grades for FirstEnergy Corp.:
| Grading Company | Action | New Grade | Date |
|---|---|---|---|
| Wolfe Research | Upgrade | Outperform | 2026-01-27 |
| Barclays | Maintain | Overweight | 2026-01-22 |
| Wells Fargo | Maintain | Overweight | 2026-01-20 |
| UBS | Maintain | Neutral | 2025-12-17 |
| UBS | Maintain | Neutral | 2025-10-24 |
| Scotiabank | Maintain | Sector Outperform | 2025-10-24 |
| Mizuho | Maintain | Neutral | 2025-10-24 |
| Morgan Stanley | Maintain | Overweight | 2025-10-21 |
| Jefferies | Maintain | Hold | 2025-10-21 |
| Keybanc | Downgrade | Sector Weight | 2025-10-15 |
CMS Energy Corporation Grades
The table below summarizes recent institutional grades for CMS Energy Corporation:
| Grading Company | Action | New Grade | Date |
|---|---|---|---|
| Mizuho | Maintain | Neutral | 2026-02-06 |
| Morgan Stanley | Maintain | Equal Weight | 2026-02-02 |
| Jefferies | Maintain | Buy | 2026-01-28 |
| Wells Fargo | Maintain | Equal Weight | 2026-01-20 |
| JP Morgan | Maintain | Overweight | 2026-01-15 |
| Jefferies | Maintain | Buy | 2026-01-15 |
| Barclays | Maintain | Overweight | 2026-01-15 |
| UBS | Maintain | Neutral | 2025-12-17 |
| JP Morgan | Maintain | Overweight | 2025-12-11 |
| Morgan Stanley | Maintain | Equal Weight | 2025-10-22 |
Which company has the best grades?
FirstEnergy Corp. holds several overweight and outperform ratings, including a recent upgrade to Outperform. CMS Energy Corporation displays a consistent pattern of overweight and buy ratings but lacks an outperform grade. Investors might view FirstEnergy’s higher tier grades as stronger institutional confidence, impacting perceived risk and potential reward.
Risks specific to each company
The following categories identify the critical pressure points and systemic threats facing both firms in the 2026 market environment:
1. Market & Competition
FirstEnergy Corp.
- Faces challenges from aging coal assets and the transition to renewables, risking market share loss.
CMS Energy Corporation
- Benefits from a diversified energy mix including gas and renewables, enhancing competitive resilience.
2. Capital Structure & Debt
FirstEnergy Corp.
- High debt-to-equity ratio of 1.95 signals elevated financial risk and leverage stress.
CMS Energy Corporation
- Even higher debt-to-equity at 2.12, increasing vulnerability to interest rate hikes and refinancing risks.
3. Stock Volatility
FirstEnergy Corp.
- Beta of 0.62 indicates moderate stock volatility, less sensitive to market swings.
CMS Energy Corporation
- Lower beta of 0.48 shows reduced stock volatility, appealing for risk-averse investors.
4. Regulatory & Legal
FirstEnergy Corp.
- Exposure to multi-state regulatory environments with ongoing scrutiny on coal plants and carbon emissions.
CMS Energy Corporation
- Regulatory risks concentrated in Michigan; progressive policies favor cleaner energy could pressure legacy assets.
5. Supply Chain & Operations
FirstEnergy Corp.
- Complex transmission network (24K miles) demands high maintenance cost and operational risk.
CMS Energy Corporation
- Extensive electric and gas distribution systems require robust operational management to avoid service disruptions.
6. ESG & Climate Transition
FirstEnergy Corp.
- Lagging on ESG performance with coal reliance and unfavorable ROIC vs. WACC metrics.
CMS Energy Corporation
- Stronger ESG stance through renewables and gas; better positioned for climate transition incentives.
7. Geopolitical Exposure
FirstEnergy Corp.
- Primarily US-focused with localized state risks; minimal direct geopolitical exposure.
CMS Energy Corporation
- Similarly US-centric with Michigan concentration; geopolitical risks are low but local policy shifts matter.
Which company shows a better risk-adjusted profile?
CMS Energy faces its most significant risk in capital structure with a high debt load, yet its stronger ESG positioning and lower stock volatility improve its risk stance. FirstEnergy’s dominant risk is financial distress indicated by a low Altman Z-score and weak liquidity ratios. CMS shows a better risk-adjusted profile, supported by a stronger Piotroski score (7 vs. 6) and more favorable operational diversification. The elevated debt levels and liquidity challenges at FirstEnergy underline my concern for financial stability in a rising-rate environment.
Final Verdict: Which stock to choose?
FirstEnergy Corp. stands out for its reliable dividend yield and solid gross margins, making it a steady cash generator. However, its declining ROIC and weak liquidity ratios are points of vigilance. This stock suits portfolios seeking income with moderate risk tolerance but requires careful monitoring of financial health.
CMS Energy Corporation benefits from a stronger net margin and a more favorable income statement trajectory, reflecting operational efficiency. Its strategic moat lies in steady cash flow and a healthier liquidity profile compared to FirstEnergy. CMS fits well in GARP portfolios that balance growth potential with reasonable valuation discipline.
If you prioritize income stability and dividend yield, FirstEnergy offers a compelling choice due to its cash generation despite some financial headwinds. However, if you seek operational efficiency and slightly better financial stability, CMS outshines with its stronger margin profile and healthier balance sheet, albeit at a premium valuation and moderate risk.
Disclaimer: Investment carries a risk of loss of initial capital. The past performance is not a reliable indicator of future results. Be sure to understand risks before making an investment decision.
Go Further
I encourage you to read the complete analyses of FirstEnergy Corp. and CMS Energy Corporation to enhance your investment decisions: