Home > Comparison > Utilities > EXC vs CMS
The strategic rivalry between Exelon Corporation and CMS Energy Corporation shapes the Utilities sector’s evolution in the U.S. Exelon operates as a broad energy services holding company with diverse generation assets. CMS Energy focuses on integrated electric and gas utility operations, primarily in Michigan. This analysis pits Exelon’s diversified scale against CMS’s regional utility focus to identify which offers a superior risk-adjusted return for a balanced portfolio.
Table of contents
Companies Overview
Exelon Corporation and CMS Energy Corporation play pivotal roles in the regulated electric utility market in the United States. Both companies anchor their business models in energy generation and distribution, serving millions of customers with a diverse fuel mix.
Exelon Corporation: Diverse Energy Giant
Exelon dominates as a utility services holding company with a broad energy portfolio including nuclear, fossil, wind, hydroelectric, biomass, and solar. Its core revenue stems from electricity generation, wholesale and retail sales, and natural gas marketing. In 2026, Exelon emphasizes expanding renewable assets while optimizing regulated transmission and distribution networks, cementing its competitive advantage in clean energy transition.
CMS Energy Corporation: Regional Utility Leader
CMS Energy primarily operates in Michigan, focusing on electric and gas utilities. Its revenue engine relies on generating electricity from coal, gas, nuclear, and renewables plus extensive transmission and distribution infrastructure. The 2026 strategy centers on enhancing grid reliability and expanding renewable independent power production, balancing regulated utility services with enterprise growth in clean energy.
Strategic Collision: Similarities & Divergences
Both companies rely heavily on regulated electric utilities but differ in scale and scope—Exelon operates broadly across the U.S. and Canada with a diversified generation mix, while CMS concentrates regionally with integrated gas and electric services. Their primary battleground lies in renewable energy expansion and grid modernization. Exelon’s diversified footprint contrasts with CMS’s focused regional approach, creating distinct risk and growth profiles for investors.
Income Statement Comparison
This data dissects the core profitability and scalability of both corporate engines to reveal who dominates the bottom line:
| Metric | Exelon Corporation (EXC) | CMS Energy Corporation (CMS) |
|---|---|---|
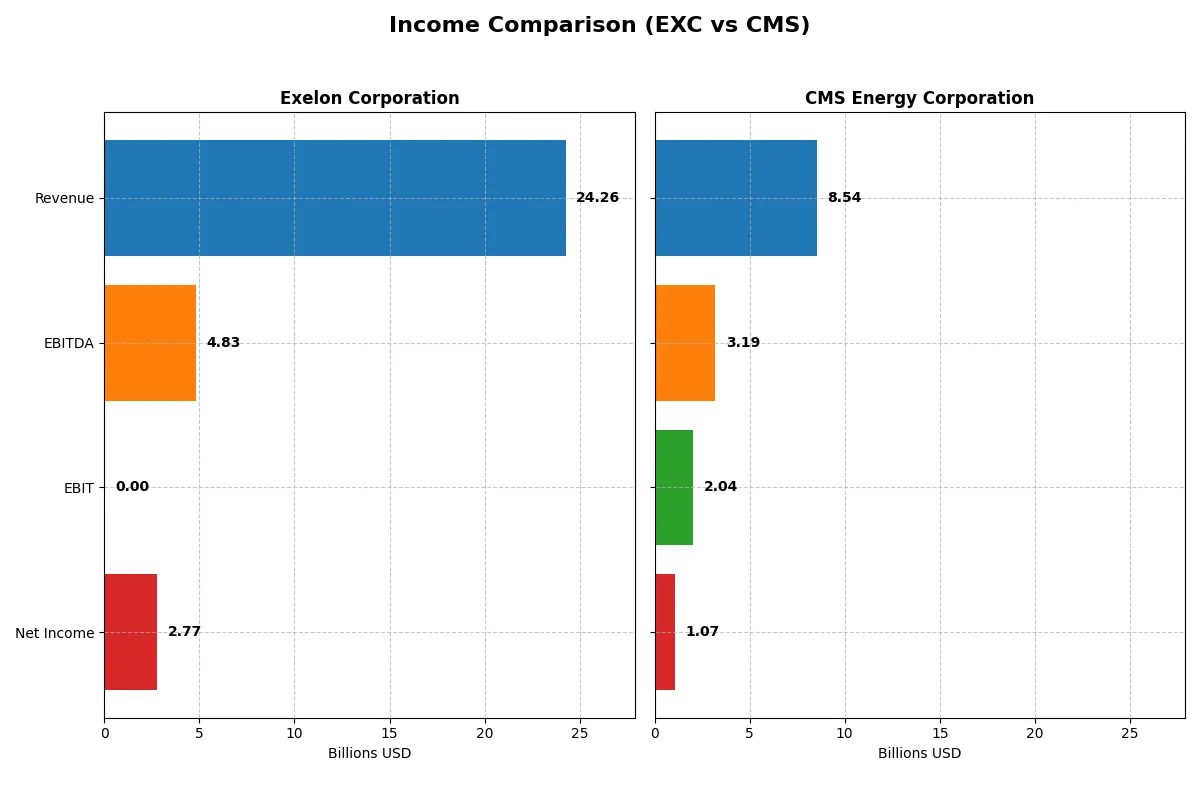
| Revenue | 24.3B | 8.5B |
| Cost of Revenue | 13.1B | 3.3B |
| Operating Expenses | 19.1B | 3.5B |
| Gross Profit | 11.1B | 5.2B |
| EBITDA | 4.8B | 3.2B |
| EBIT | 0 | 2.0B |
| Interest Expense | -2.1B | 789M |
| Net Income | 2.8B | 1.1B |
| EPS | 2.74 | 3.53 |
| Fiscal Year | 2025 | 2025 |
Income Statement Analysis: The Bottom-Line Duel
The following income statement comparison reveals each company’s operational efficiency and profitability trends over recent years.
Exelon Corporation Analysis
Exelon’s revenue climbs steadily from $17.9B in 2021 to $24.3B in 2025, with net income rising 62% over five years to $2.77B. The gross margin remains robust near 46%, while net margin improves to 11.4%, reflecting disciplined cost control despite rising expenses. In 2025, Exelon’s growth momentum shows in rising gross profit (+18%) and EPS (+11%), though EBIT margin hit zero, indicating operational challenges.
CMS Energy Corporation Analysis
CMS posts moderate revenue growth, from $7.3B in 2021 to $8.5B in 2025, but net income declines by 21% to $1.07B. Gross margin stands strong at 61%, outperforming Exelon by a wide margin, and EBIT margin reaches a healthy 24%. However, CMS’s net margin slipped slightly to 12.5%, signaling pressure on profitability despite improving revenue and operating income in 2025.
Growth Momentum vs. Margin Dominance
Exelon leads with superior top-line growth and net income expansion, showcasing its ability to scale profitably over time. CMS, conversely, excels in margin quality and operational efficiency but struggles to grow net income sustainably. Investors seeking revenue and earnings growth may favor Exelon, while those prioritizing margin strength and consistent operating profit might lean toward CMS’s profile.
Financial Ratios Comparison
These vital ratios act as a diagnostic tool to expose the underlying fiscal health, valuation premiums, and capital efficiency of each company:
| Ratios | Exelon Corporation (EXC) | CMS Energy Corporation (CMS) |
|---|---|---|
| ROE | 17.7% | 11.7% |
| ROIC | -53.8% | 3.7% |
| P/E | 15.9 | 19.6 |
| P/B | 2.82 | 2.30 |
| Current Ratio | 0.87 | 0.98 |
| Quick Ratio | 0.78 | 0.76 |
| D/E | 3.18 | 2.07 |
| Debt-to-Assets | 43.3% | 46.9% |
| Interest Coverage | -2.45 | 2.19 |
| Asset Turnover | 0 | 0.21 |
| Fixed Asset Turnover | 0 | 0.28 |
| Payout Ratio | 58.4% | 60.9% |
| Dividend Yield | 3.67% | 3.10% |
| Fiscal Year | 2025 | 2025 |
Efficiency & Valuation Duel: The Vital Signs
Ratios act as a company’s DNA, exposing operational strengths and hidden financial risks critical for investment decisions.
Exelon Corporation
Exelon shows a robust ROE of 17.74% and a solid net margin at 11.41%, signaling strong profitability. Its P/E of 15.92 and P/B of 2.82 indicate a fairly valued stock. The 3.67% dividend yield rewards shareholders, reflecting a balanced capital return approach despite some unfavorable liquidity and leverage metrics.
CMS Energy Corporation
CMS posts a decent net margin of 12.54% but a more moderate ROE at 11.71%. The stock trades at a higher P/E of 19.63 with a P/B of 2.3, suggesting a slightly stretched valuation. It maintains a 3.1% dividend yield, prioritizing shareholder returns, although several efficiency ratios and liquidity measures remain less favorable.
Valuation Fairness vs. Profitability Strength
Exelon offers stronger profitability and a more attractive dividend yield at a reasonable valuation, despite some financial risks. CMS trades higher but delivers moderate returns with more neutral risk metrics. Investors seeking solid income with operational efficiency may lean toward Exelon’s profile, while those tolerating valuation premium might consider CMS.
Which one offers the Superior Shareholder Reward?
Exelon (EXC) yields 3.7% with a payout ratio near 58%, yet it suffers negative free cash flow, signaling strained dividend sustainability. CMS Energy (CMS) offers a 3.1% dividend yield at a 61% payout ratio but generates positive free cash flow and strong buyback capacity. CMS’s consistent buybacks and healthier cash metrics underpin a more sustainable total return. I conclude CMS Energy provides a superior shareholder reward in 2026, balancing income with capital return more prudently than Exelon.
Comparative Score Analysis: The Strategic Profile
The radar chart reveals the fundamental DNA and trade-offs of Exelon Corporation and CMS Energy Corporation, highlighting their financial strengths and weaknesses:
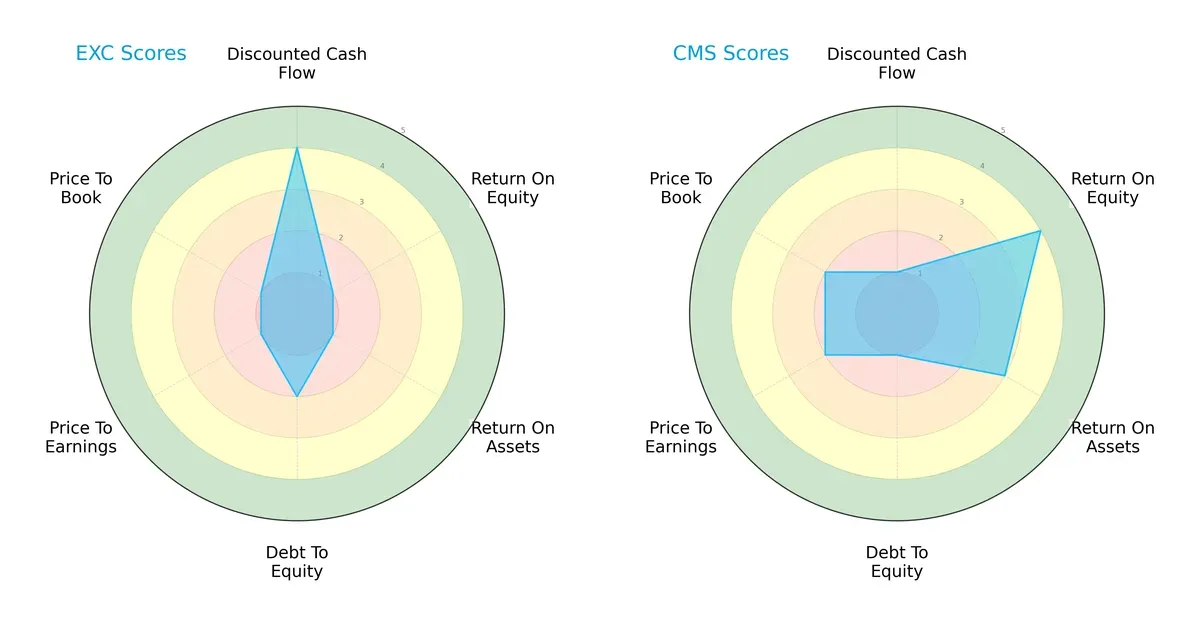
Exelon relies heavily on discounted cash flow with a favorable DCF score of 4 but struggles on profitability metrics (ROE and ROA both at 1). CMS shows a more balanced profitability profile with ROE at 4 and ROA at 3 but weak cash flow valuation (DCF score 1). Both firms have weak debt management scores (2 for Exelon, 1 for CMS) and face valuation challenges, although CMS fares slightly better on P/E and P/B ratios. CMS presents a more balanced profile, while Exelon leans on DCF strength amid profitability and valuation weaknesses.
—
Financial Health: Quality of Operations
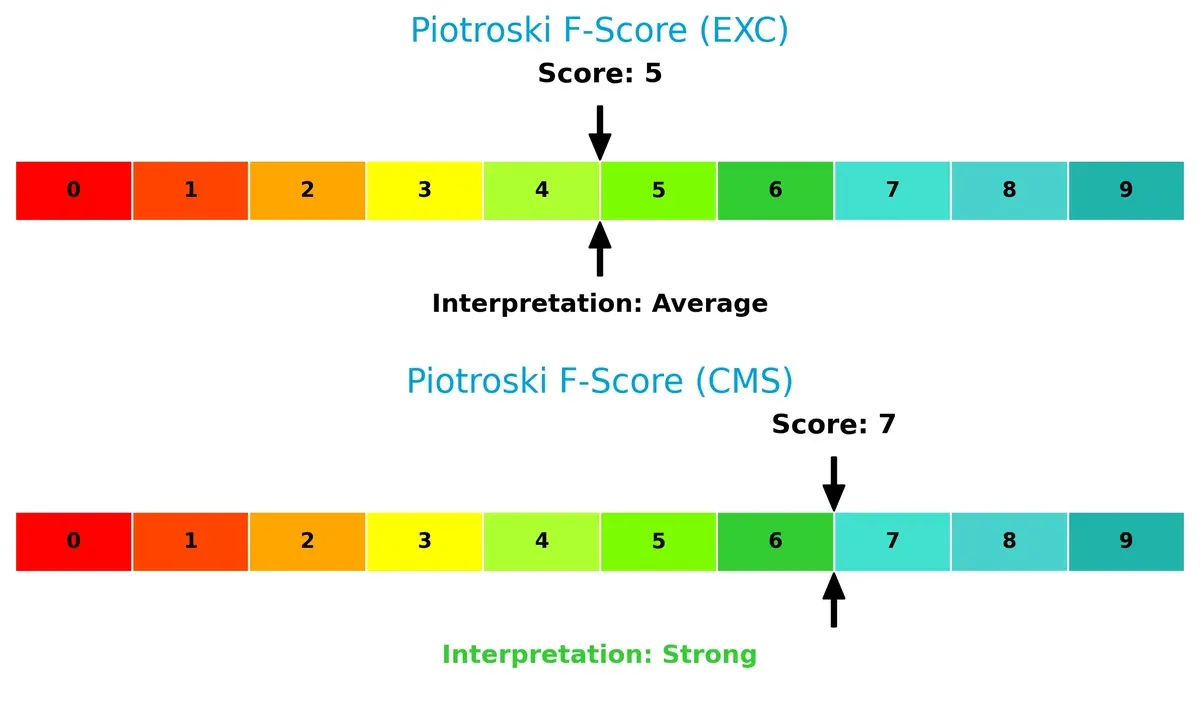
CMS leads with a stronger Piotroski F-Score of 7, indicating robust financial health and operational quality. Exelon’s score of 5 signals average strength with potential internal red flags compared to CMS:
How are the two companies positioned?
This section dissects the operational DNA of EXC and CMS by comparing their revenue distribution by segment and internal dynamics, including strengths and weaknesses. The final objective confronts their economic moats to identify which model offers the most resilient, sustainable competitive advantage in today’s market landscape.
Revenue Segmentation: The Strategic Mix
This comparison dissects how Exelon Corporation and CMS Energy Corporation diversify income streams and highlights their primary sector bets:
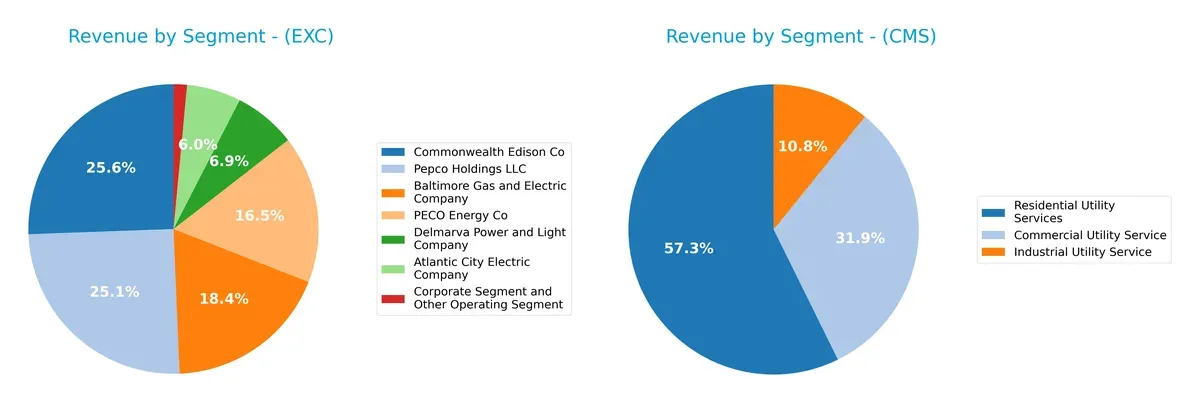
Exelon generates revenue from six operating segments, with Pepco Holdings LLC anchoring at $7.14B in 2025, followed closely by Commonwealth Edison Co at $7.27B. This mix signals a broad regional utility presence, limiting concentration risk. CMS Energy leans on Residential Utility Services as its largest segment at $4.36B, supported by Commercial and Industrial services, showing moderate diversification but a heavier reliance on residential demand. Exelon’s diversified portfolio suggests stronger ecosystem lock-in compared to CMS’s focused utility services.
Strengths and Weaknesses Comparison
This table compares the Strengths and Weaknesses of Exelon Corporation and CMS Energy Corporation:
Exelon Corporation Strengths
- Higher net margin at 11.41%
- Strong return on equity at 17.74%
- Favorable WACC at 4.47%
- Higher dividend yield of 3.67%
- Diverse revenue streams across multiple utility subsidiaries
CMS Energy Corporation Strengths
- Slightly higher net margin at 12.54%
- Favorable WACC at 4.96%
- Moderate dividend yield at 3.1%
- Stable revenue from commercial, industrial, and residential utility services
Exelon Corporation Weaknesses
- Negative ROIC at -53.76%, well below WACC
- Zero current and quick ratios indicate liquidity concerns
- High debt-to-equity ratio at 3.18
- Negative interest coverage ratio
- Low asset and fixed asset turnover ratios
CMS Energy Corporation Weaknesses
- ROIC below WACC at 3.67%
- Current ratio below 1 at 0.98 and quick ratio at 0.76, signaling liquidity pressure
- Elevated debt-to-equity ratio at 2.07
- Neutral interest coverage at 2.58
- Low asset turnover ratios
Exelon exhibits stronger profitability metrics but faces severe liquidity and capital efficiency challenges. CMS maintains more balanced liquidity and capital structure but shows weaker returns on invested capital. Both companies must address operational efficiency to improve financial resilience.
The Moat Duel: Analyzing Competitive Defensibility
A structural moat alone shields long-term profits from relentless competitive erosion. Let’s dissect how these two utilities defend their turf:
Exelon Corporation: Complex Asset Base with Nuclear Backbone
Exelon’s moat stems from its diverse generation portfolio, notably nuclear assets with high barriers to entry. Despite a very unfavorable ROIC trend, its broad mix supports margin stability. New renewable ventures in 2026 could either bolster or strain capital allocation.
CMS Energy Corporation: Regulated Utility with Localized Monopoly
CMS relies on regulated electric and gas utility monopolies in Michigan, producing steady cash flows and favorable margins. However, its slightly declining ROIC signals caution. Expanding renewable projects offer upside but demand careful capital discipline amid regulatory shifts.
Nuclear Complexity vs. Regulated Monopoly: Who Holds the Deeper Moat?
Both firms show very unfavorable ROIC trends with value destruction signals. Yet, Exelon’s broad asset complexity and nuclear foothold create a wider moat than CMS’s regional monopoly. Exelon is marginally better positioned to defend market share despite current profitability headwinds.
Which stock offers better returns?
Over the past 12 months, both Exelon Corporation and CMS Energy Corporation posted strong gains with accelerating bullish trends, reflecting significant upward price momentum and sustained buyer interest.
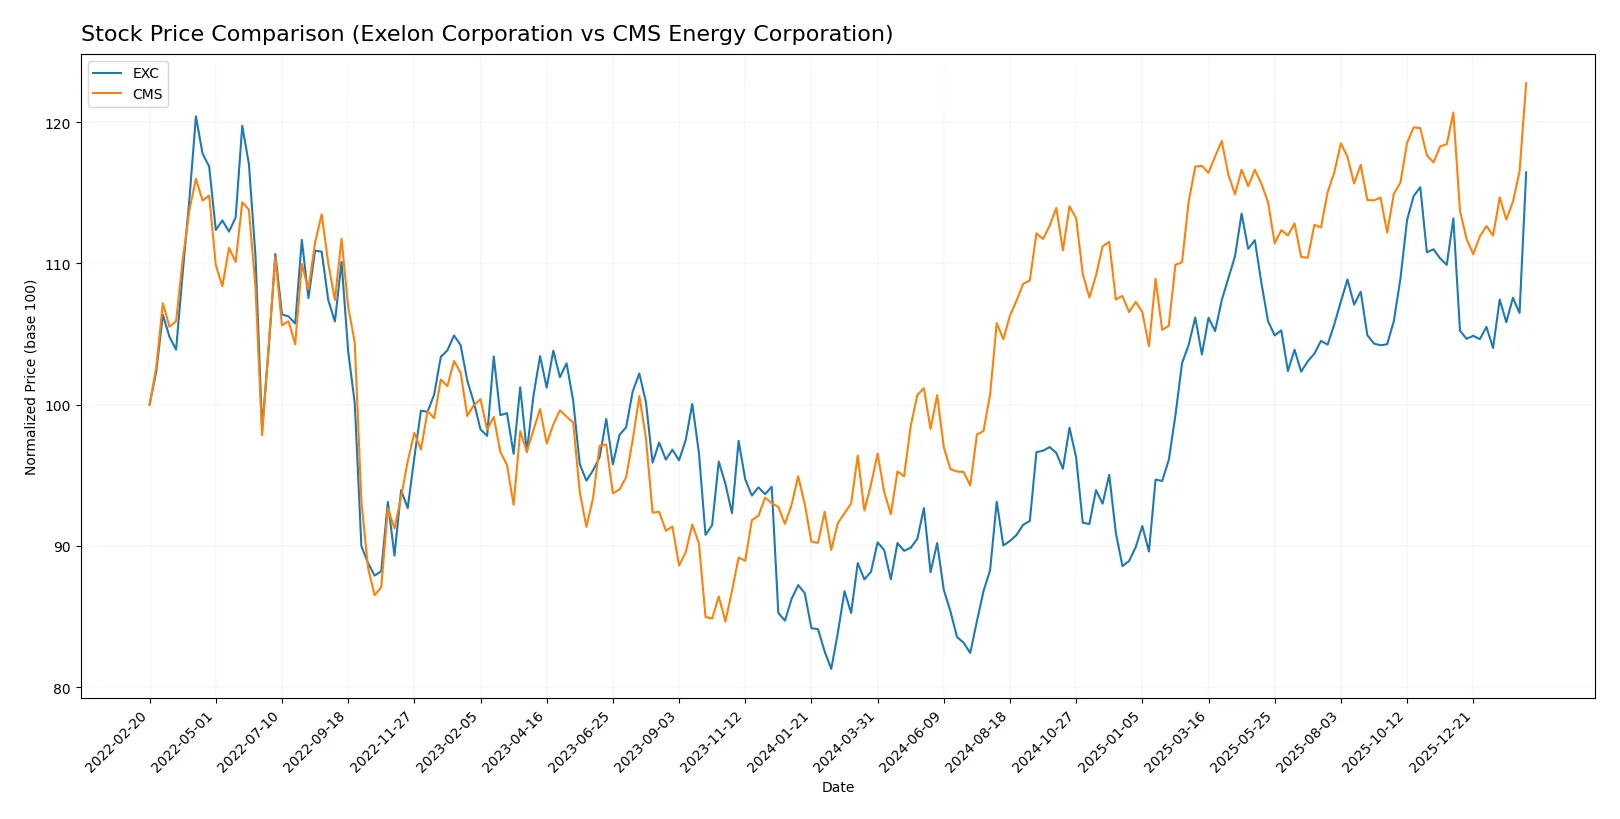
Trend Comparison
Exelon Corporation’s stock rose 32.1% over the last year, showing an accelerating bullish trend with moderate volatility and a high of 48.48. The recent three-month trend remains positive with a 2.89% gain.
CMS Energy Corporation gained 30.13% over the same period, also accelerating bullishly but with higher volatility and a peak price of 76.74. The recent trend shows a smaller 1.72% increase.
Exelon outperformed CMS by a narrow margin, delivering the highest overall market return with steadier recent growth despite CMS’s stronger short-term buyer dominance.
Target Prices
Analysts provide a clear target price consensus for Exelon Corporation and CMS Energy Corporation.
| Company | Target Low | Target High | Consensus |
|---|---|---|---|
| Exelon Corporation | 39 | 57 | 50.27 |
| CMS Energy Corporation | 74 | 82 | 78.38 |
The consensus target prices for both utilities suggest upside potential versus current prices: Exelon trades near $48.48, CMS near $76.74. Analysts expect moderate appreciation reflecting stable sector fundamentals.

Don’t Let Luck Decide Your Entry Point
Optimize your entry points with our advanced ProRealTime indicators. You’ll get efficient buy signals with precise price targets for maximum performance. Start outperforming now!
How do institutions grade them?
Exelon Corporation Grades
The following table summarizes recent grades issued by major financial institutions for Exelon Corporation.
| Grading Company | Action | New Grade | Date |
|---|---|---|---|
| Scotiabank | Maintain | Sector Perform | 2026-02-13 |
| BMO Capital | Maintain | Outperform | 2026-02-13 |
| Wells Fargo | Maintain | Overweight | 2026-02-13 |
| Mizuho | Maintain | Outperform | 2026-02-13 |
| Jefferies | Maintain | Buy | 2026-01-27 |
| Barclays | Maintain | Overweight | 2026-01-22 |
| Wells Fargo | Maintain | Overweight | 2026-01-20 |
| UBS | Maintain | Neutral | 2025-12-17 |
| JP Morgan | Maintain | Neutral | 2025-12-12 |
| Morgan Stanley | Maintain | Equal Weight | 2025-10-22 |
CMS Energy Corporation Grades
The following table details recent grades from key financial institutions for CMS Energy Corporation.
| Grading Company | Action | New Grade | Date |
|---|---|---|---|
| BMO Capital | Maintain | Outperform | 2026-02-09 |
| Mizuho | Maintain | Neutral | 2026-02-06 |
| Morgan Stanley | Maintain | Equal Weight | 2026-02-02 |
| Jefferies | Maintain | Buy | 2026-01-28 |
| Wells Fargo | Maintain | Equal Weight | 2026-01-20 |
| JP Morgan | Maintain | Overweight | 2026-01-15 |
| Jefferies | Maintain | Buy | 2026-01-15 |
| Barclays | Maintain | Overweight | 2026-01-15 |
| UBS | Maintain | Neutral | 2025-12-17 |
| JP Morgan | Maintain | Overweight | 2025-12-11 |
Which company has the best grades?
Exelon Corporation generally receives a higher concentration of “Outperform” and “Overweight” ratings compared to CMS Energy, which has more “Neutral” and “Equal Weight” grades. This pattern suggests Exelon currently holds stronger institutional support, potentially impacting investor sentiment and valuation positively.
Risks specific to each company
The following categories identify the critical pressure points and systemic threats facing both firms in the 2026 market environment:
1. Market & Competition
Exelon Corporation
- Faces intense competition in regulated electric markets with a diverse generation mix but negative ROIC signals efficiency challenges.
CMS Energy Corporation
- Competes primarily in Michigan with a strong customer base but limited geographic diversification.
2. Capital Structure & Debt
Exelon Corporation
- High debt-to-equity ratio (3.18) and poor interest coverage signal financial leverage risk.
CMS Energy Corporation
- Lower debt-to-equity ratio (2.07) but interest coverage only moderate at 2.58, indicating some refinancing risks.
3. Stock Volatility
Exelon Corporation
- Beta of 0.44 indicates lower stock volatility, appealing for risk-averse investors.
CMS Energy Corporation
- Beta of 0.48 suggests slightly higher volatility but still below market average.
4. Regulatory & Legal
Exelon Corporation
- Operates in multiple states, exposing it to complex regulatory environments and potential legal challenges.
CMS Energy Corporation
- Primarily Michigan-based, regulatory risk is more concentrated but potentially manageable.
5. Supply Chain & Operations
Exelon Corporation
- Broad generation portfolio requires complex supply chain management, increasing operational risks.
CMS Energy Corporation
- Extensive electric and gas infrastructure in Michigan demands high maintenance but benefits from regional focus.
6. ESG & Climate Transition
Exelon Corporation
- Heavy nuclear and renewable assets align with clean energy transition but face regulatory scrutiny.
CMS Energy Corporation
- Mix of coal, gas, and renewables slows ESG progress, posing transition risks.
7. Geopolitical Exposure
Exelon Corporation
- US and Canada presence subjects it to cross-border policy shifts and trade risks.
CMS Energy Corporation
- Concentrated US Midwest exposure limits geopolitical risk but increases vulnerability to regional policies.
Which company shows a better risk-adjusted profile?
Exelon’s most impactful risk is its strained capital structure with a high debt load and poor interest coverage. CMS’s key risk lies in its financial distress signals, evident in its Altman Z-Score placing it in the distress zone. CMS shows a stronger Piotroski score, indicating better financial health despite leverage concerns. However, Exelon’s lower beta and broader geographic reach offer some risk diversification. Overall, CMS displays a better risk-adjusted profile, supported by a stronger financial strength score and more manageable debt levels amid regulatory and operational pressures.
Final Verdict: Which stock to choose?
Exelon Corporation’s superpower lies in its steady revenue growth and favorable net margin, making it a resilient cash generator in a capital-intensive sector. However, its declining return on invested capital and stretched liquidity ratios remain points of vigilance. It suits investors targeting aggressive growth with a tolerance for operational risks.
CMS Energy Corporation benefits from a strategic moat rooted in its strong gross and EBIT margins, reflecting efficient cost management and operational excellence. Its safer liquidity profile compared to Exelon adds a layer of stability. CMS fits well within a GARP (Growth at a Reasonable Price) portfolio seeking balanced growth and moderate risk.
If you prioritize growth fueled by robust margin expansion and can tolerate financial leverage, Exelon outshines as a compelling choice due to its superior income growth trajectory. However, if you seek better stability and operational efficiency with a more conservative risk profile, CMS offers a more prudent scenario despite a slower growth pace. Both present analytical scenarios for different investor appetites rather than a definitive winner.
Disclaimer: Investment carries a risk of loss of initial capital. The past performance is not a reliable indicator of future results. Be sure to understand risks before making an investment decision.
Go Further
I encourage you to read the complete analyses of Exelon Corporation and CMS Energy Corporation to enhance your investment decisions: