Home > Comparison > Utilities > ES vs CMS
The strategic rivalry between Eversource Energy and CMS Energy Corporation shapes the competitive landscape of the regulated electric utilities sector. Eversource operates a diversified energy delivery model including electric, gas, and water distribution, while CMS Energy focuses on integrated electric and gas utility services with significant renewable generation. This analysis evaluates their divergent operational strategies to identify which offers superior risk-adjusted returns for a diversified portfolio in today’s utility environment.

Table of contents
Companies Overview
Eversource Energy and CMS Energy Corporation both hold pivotal roles in the regulated electric utility sector in the United States.
Eversource Energy: Regional Power and Water Leader
Eversource Energy commands a regulated electric utility footprint across Connecticut, Massachusetts, and New Hampshire. Its core revenue stems from electric distribution, transmission, natural gas delivery, and water utilities serving roughly 226K customers. In 2026, the company focuses on maintaining infrastructure reliability while advancing solar power integration to meet evolving energy demands.
CMS Energy Corporation: Diversified Michigan Utility Powerhouse
CMS Energy operates primarily in Michigan, generating revenue through electric and gas utilities plus renewable energy ventures. Its electric segment spans coal, wind, gas, oil, and nuclear generation, serving 1.9M electricity and 1.8M gas customers. The 2026 strategy emphasizes expanding renewable generation and optimizing its extensive transmission and distribution network to balance sustainability and customer needs.
Strategic Collision: Similarities & Divergences
Both companies anchor their business models in regulated utilities but diverge in geographic scope and energy mix. Eversource pursues a focused regional approach with an emphasis on solar and water services, while CMS leverages a broader fuel mix and a larger customer base in Michigan. Their primary competition lies in efficiently modernizing infrastructure amid regulatory pressures. These differences shape distinct risk profiles and growth dynamics for investors in regulated utilities.
Income Statement Comparison
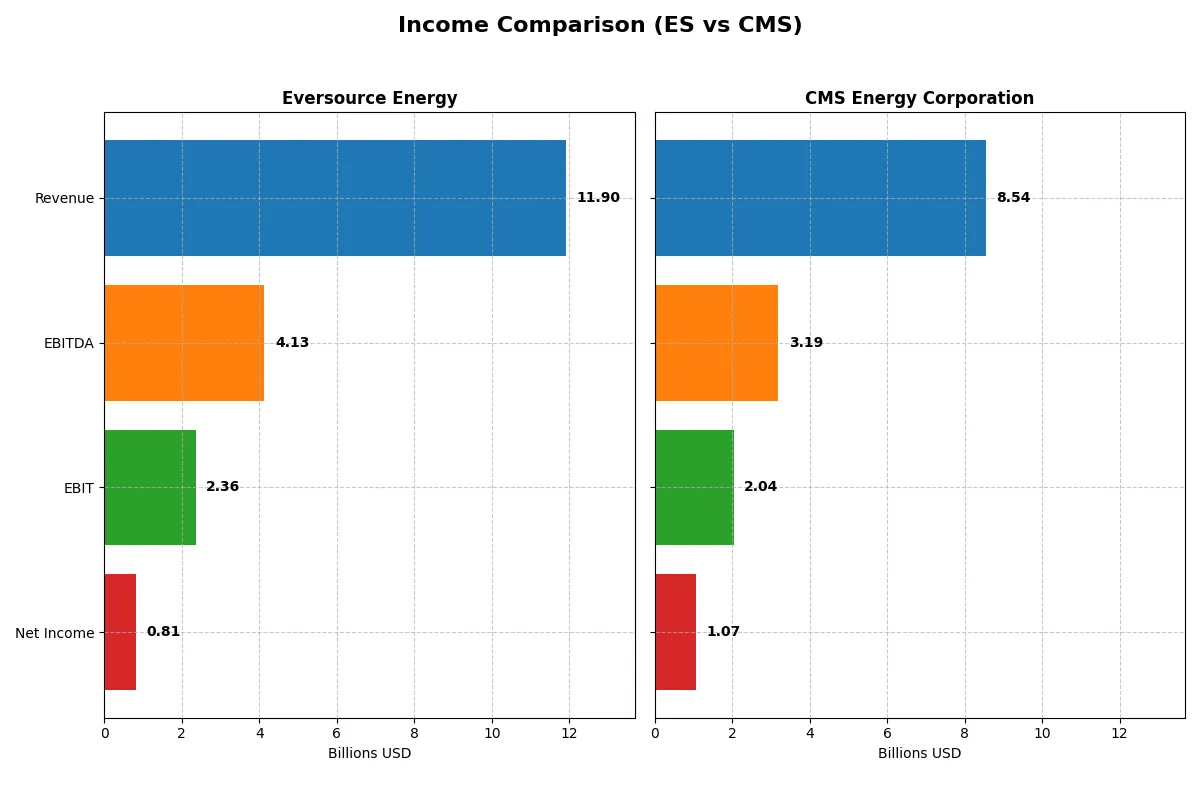
This data dissects the core profitability and scalability of both corporate engines to reveal who dominates the bottom line:
| Metric | Eversource Energy (ES) | CMS Energy Corporation (CMS) |
|---|---|---|
| Revenue | 11.9B | 7.5B |
| Cost of Revenue | 8.2B | 4.3B |
| Operating Expenses | 1.0B | 1.7B |
| Gross Profit | 3.7B | 3.2B |
| EBITDA | 4.1B | 3.1B |
| EBIT | 2.4B | 1.8B |
| Interest Expense | 1.1B | 708M |
| Net Income | 812M | 1.0B |
| EPS | 2.27 | 3.33 |
| Fiscal Year | 2024 | 2024 |
Income Statement Analysis: The Bottom-Line Duel
This income statement comparison unveils which company converts revenue into profit with greater efficiency and momentum.
Eversource Energy Analysis
Eversource Energy’s revenue remained nearly flat at $11.9B in 2024, following a 33.6% growth from 2020. Net income rebounded sharply from a loss in 2023 to $812M in 2024. Its gross margin deteriorated from 40.7% in 2023 to 31.1% in 2024, but EBIT margin surged to 19.8%, reflecting improved operational efficiency and a strong earnings recovery.
CMS Energy Corporation Analysis
CMS Energy grew revenue 13.6% to $8.5B in 2025 and expanded gross profit by 62% year-over-year to $5.2B. Its gross margin stands at a robust 60.9%, with EBIT margin at 23.9%. Net income reached $1.07B despite a slight 6% dip in net margin. CMS shows consistent top-line momentum and solid profitability metrics, though operating expenses grew in step with revenue.
Margin Strength vs. Revenue Resilience
Eversource displays a volatile margin profile but a strong bounce in net income, driven by operational gains despite declining gross profit. CMS maintains superior margins and steady revenue growth, though net margin slipped slightly. CMS’s profile suits investors valuing margin dominance and stable earnings. Eversource appeals to those tracking a turnaround story with improving bottom-line momentum.
Financial Ratios Comparison
These vital ratios act as a diagnostic tool to expose the underlying fiscal health, valuation premiums, and capital efficiency of the companies compared below:
| Ratios | Eversource Energy (ES) | CMS Energy Corporation (CMS) |
|---|---|---|
| ROE | 5.40% | 12.19% |
| ROIC | 3.18% | 3.73% |
| P/E | 25.29 | 19.49 |
| P/B | 1.37 | 2.34 |
| Current Ratio | 0.76 | 1.34 |
| Quick Ratio | 0.67 | 1.34 |
| D/E | 1.94 | 2.12 |
| Debt-to-Assets | 48.9% | 47.3% |
| Interest Coverage | 2.43 | 2.19 |
| Asset Turnover | 0.20 | 0.21 |
| Fixed Asset Turnover | 0.29 | 0.28 |
| Payout Ratio | 124.3% | 60.5% |
| Dividend Yield | 4.91% | 3.10% |
| Fiscal Year | 2024 | 2025 |
Efficiency & Valuation Duel: The Vital Signs
Financial ratios act as a company’s DNA, unveiling hidden risks and operational excellence critical for investment decisions.
Eversource Energy
Eversource Energy shows modest profitability with a 5.4% ROE and 6.82% net margin but lags behind in ROIC at 3.18%. The stock appears stretched with a P/E of 25.29. Shareholders benefit from a solid 4.91% dividend yield, reflecting a value-return focus amid limited reinvestment in growth.
CMS Energy Corporation
CMS Energy delivers stronger profitability, posting a 12.01% ROE and 12.54% net margin. Its valuation is more attractive with a P/E of 19.49. CMS balances shareholder returns with a 3.1% dividend yield and maintains capacity for reinvestment, signaling operational efficiency and moderate growth potential.
Premium Valuation vs. Operational Safety
CMS offers a better balance of profitability and valuation, with fewer unfavorable ratios and a healthier liquidity profile. Eversource’s higher dividend yield suits income-focused investors, while CMS appeals to those seeking stable growth and efficient capital use.
Which one offers the Superior Shareholder Reward?
I observe Eversource Energy (ES) offers a higher dividend yield at ~4.9% versus CMS Energy’s ~3.1% in 2025. ES’s payout ratio exceeds 120%, signaling aggressive dividends but questionable FCF coverage due to negative free cash flow. CMS maintains a more sustainable payout ratio near 60%, supported by positive free cash flow of 7.5B and steady buybacks. I note CMS’s robust operating cash flow ratio (~0.86) and manageable leverage support prudent capital allocation. ES’s payout is riskier with free cash flow deficits and heavy debt load. For 2026, CMS’s balanced dividend and buyback strategy delivers superior long-term total return potential.
Comparative Score Analysis: The Strategic Profile
The radar chart reveals the fundamental DNA and trade-offs of both firms, highlighting their financial strengths and weaknesses across key metrics:
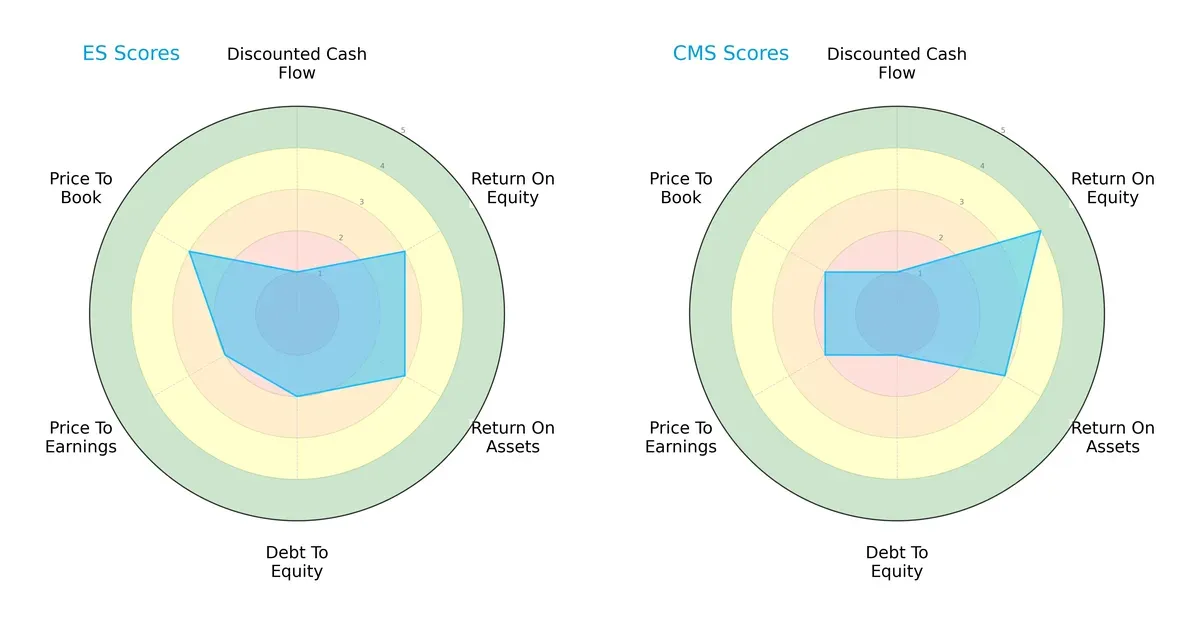
Eversource Energy (ES) and CMS Energy Corporation (CMS) share weak discounted cash flow scores (1), signaling undervaluation concerns. CMS leads in return on equity (4 vs. 3) but lags in debt-to-equity (1 vs. 2), indicating higher leverage risk. ES has a more balanced valuation profile with better price-to-book score (3 vs. 2). Overall, CMS relies heavily on superior profitability, while ES maintains steadier financial balance.
Bankruptcy Risk: Solvency Showdown
Both firms fall in the distress zone with Altman Z-Scores below 1, signaling elevated bankruptcy risk in this cycle:
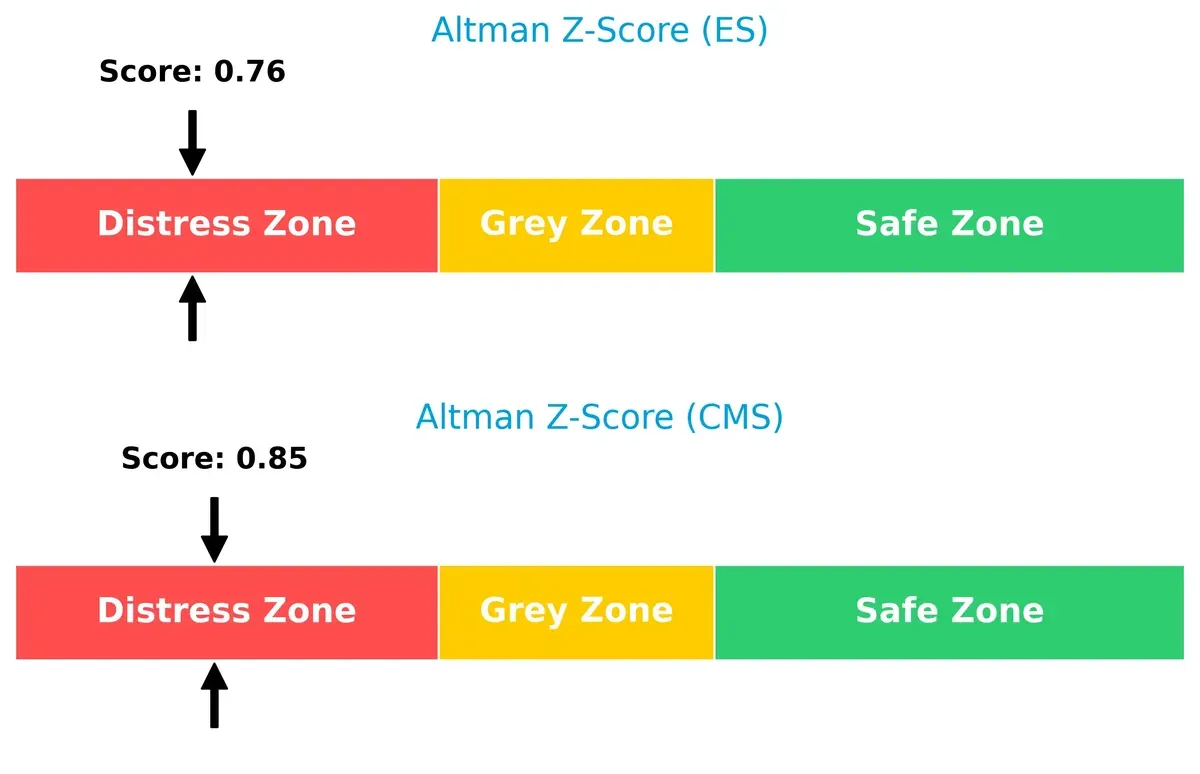
Eversource’s Z-Score at 0.76 slightly trails CMS’s 0.85, suggesting marginally higher financial fragility. Investors should remain cautious given ongoing solvency concerns.
Financial Health: Quality of Operations
CMS edges ahead with a stronger Piotroski F-Score, reflecting superior operational quality and financial health:
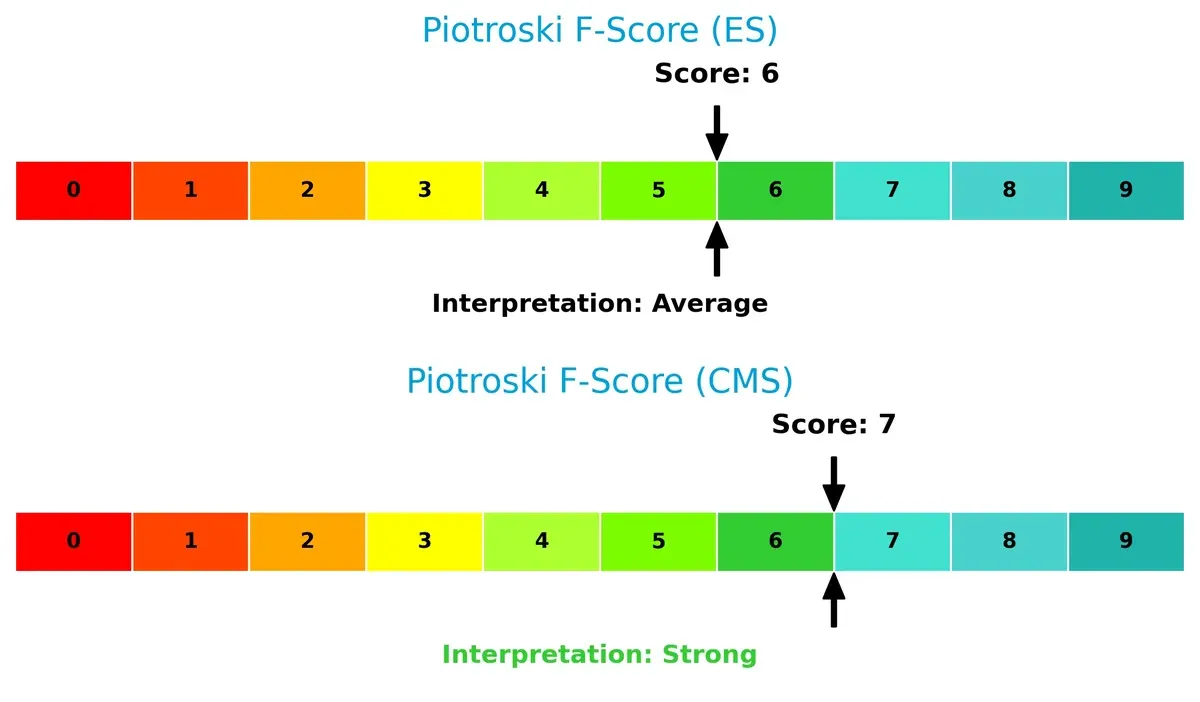
CMS scores 7 (strong), outperforming Eversource’s 6 (average). This indicates CMS’s internal metrics are more robust, though neither firm exhibits critical red flags. The difference suggests CMS manages profitability and leverage more effectively.
How are the two companies positioned?
This section dissects the operational DNA of ES and CMS by comparing their revenue distribution by segment alongside their strengths and weaknesses. The final objective is to confront their economic moats to identify which model offers the most resilient and sustainable competitive advantage in today’s market.
Revenue Segmentation: The Strategic Mix
This visual comparison dissects how Eversource Energy and CMS Energy diversify their income streams and where their primary sector bets lie:
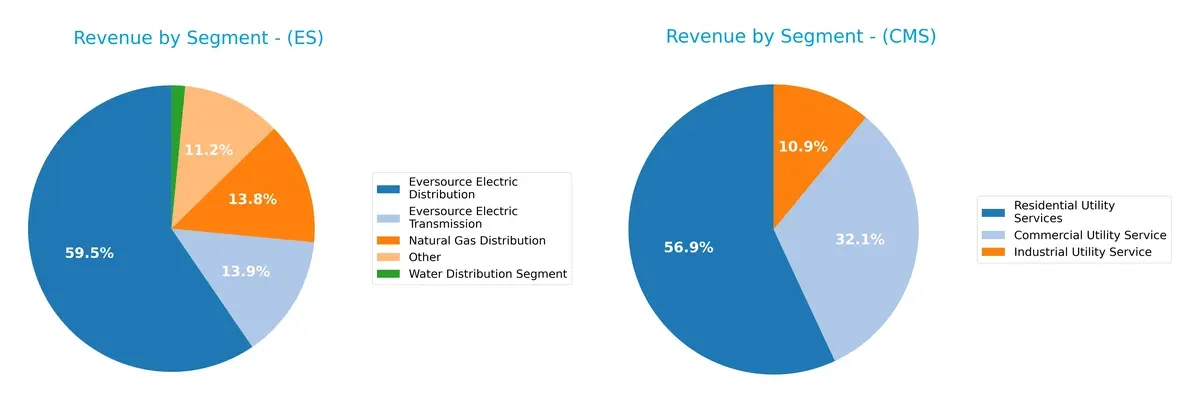
Eversource Energy anchors revenue in Electric Distribution at 9.07B, dwarfing other segments like Natural Gas Distribution at 2.10B. CMS Energy pivots around Residential Utility Services with 3.75B but shows a more balanced mix, including Commercial (2.11B) and Industrial (720M) Utility Services. Eversource’s heavy concentration signals infrastructure dominance but raises concentration risk, while CMS’s spread reduces sector vulnerability and supports ecosystem lock-in.
Strengths and Weaknesses Comparison
This table compares the Strengths and Weaknesses of Eversource Energy (ES) and CMS Energy Corporation (CMS):
ES Strengths
- Diversified revenue streams including electric, gas, and water distribution
- Favorable WACC at 5.05% supporting cost of capital efficiency
- Attractive dividend yield at 4.91% appealing to income investors
CMS Strengths
- Strong net margin at 12.54% indicating operational efficiency
- Favorable quick ratio at 1.34 signaling solid liquidity
- Neutral PE at 19.49 suggesting reasonable valuation
ES Weaknesses
- Unfavorable ROE (5.4%) and ROIC (3.18%) below cost of capital
- Low current (0.76) and quick ratios (0.67) raising short-term liquidity concerns
- High debt-to-equity (1.94) and weak asset turnover (0.2) limiting efficiency
CMS Weaknesses
- Unfavorable ROIC (3.71%) below WACC (5.02%) reducing capital returns
- Elevated debt-to-equity (2.12) increasing leverage risk
- Unfavorable asset turnover (0.21) and fixed asset turnover (0.28) reflecting asset use inefficiency
Eversource Energy shows strengths in diversification and dividend yield but faces challenges in profitability and liquidity metrics. CMS Energy benefits from superior margin performance and liquidity but must address capital efficiency and leverage concerns to enhance its financial resilience.
The Moat Duel: Analyzing Competitive Defensibility
A structural moat is the only barrier shielding long-term profits from fierce competition and market pressures. Let’s dissect how these utilities defend their turf:
Eversource Energy: Regulatory Franchise and Infrastructure Control
Eversource’s moat stems from its regulated electric and natural gas utilities, creating high switching costs and stable margins. Despite a declining ROIC, its infrastructure investments underpin margin resilience in 2026.
CMS Energy Corporation: Integrated Utility with Diverse Energy Mix
CMS leverages a broad energy portfolio and regulated network, differentiating by combining gas and electric utilities. Its superior gross and EBIT margins reflect operational strength, though a slight ROIC decline signals caution ahead.
Regulated Networks vs. Diversified Energy Mix: Which Moat Holds Stronger?
Both companies face shrinking ROIC trends, signaling value erosion. However, CMS’s higher margin profile and broader energy mix provide a deeper moat to defend market share versus Eversource’s narrower regulatory play.
Which stock offers better returns?
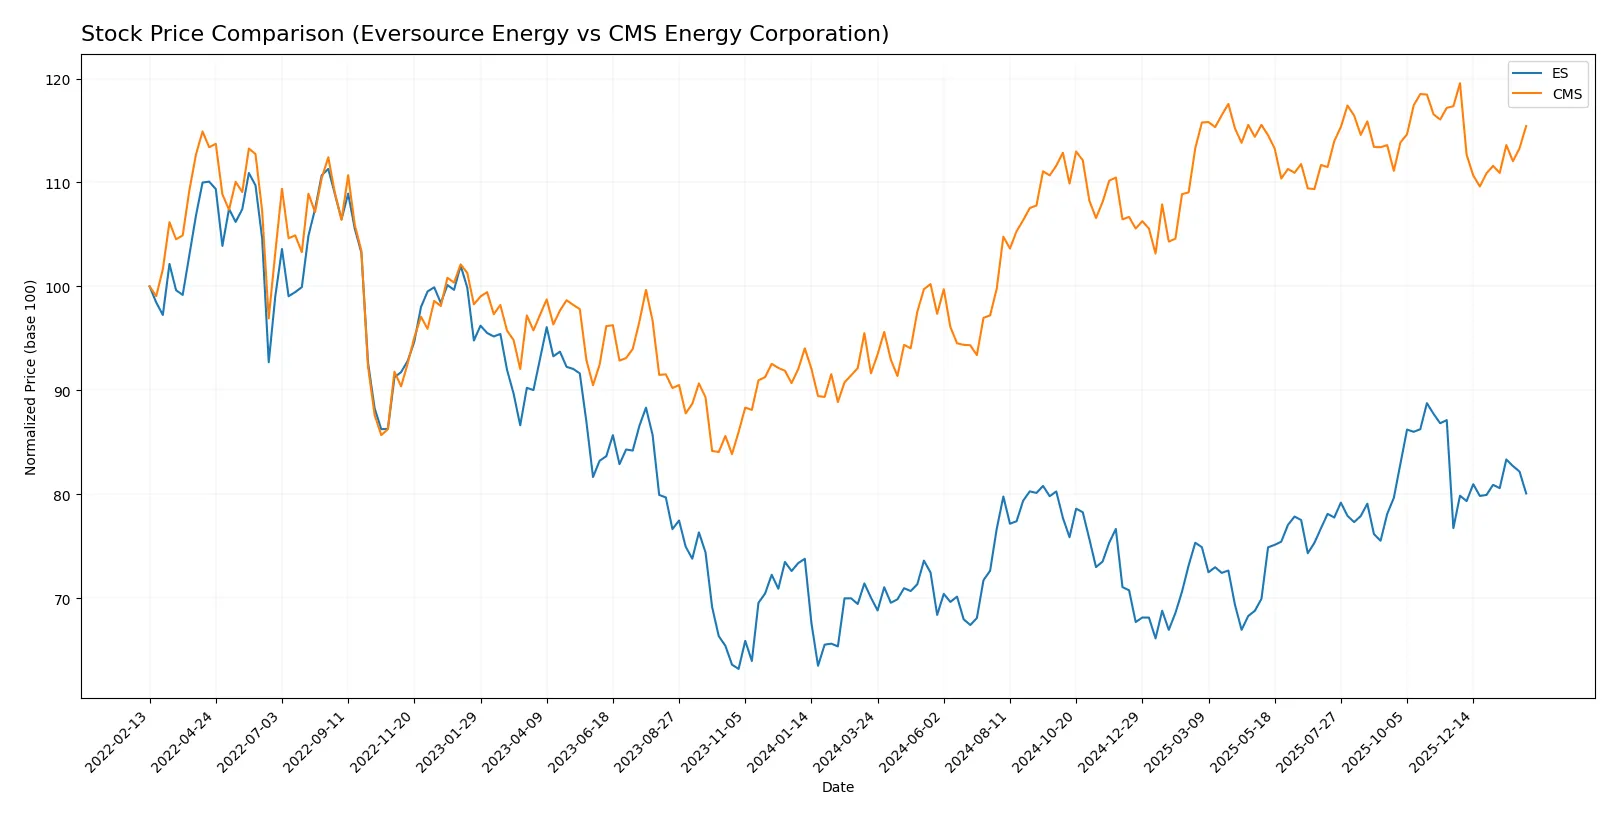
Over the past year, both stocks showed bullish trends with distinct trading dynamics. Eversource Energy accelerated gains, while CMS Energy’s rally slowed despite a higher percentage increase overall.
Trend Comparison
Eversource Energy’s stock rose 14.32% over the last 12 months, displaying an accelerating bullish trend with price highs at 74.67 and lows at 55.63. Volatility measured by a 4.57 standard deviation supports active trading.
CMS Energy’s stock gained 25.98% over the same period, maintaining a bullish trend but with deceleration. The highest price reached 75.44, and the lowest was 57.66. Volatility is similar at 4.7 standard deviation.
CMS Energy outperformed Eversource Energy with a 25.98% gain versus 14.32%, despite deceleration. CMS delivered the highest market return in the analyzed year.
Target Prices
Analysts present a cautiously optimistic consensus for these regulated electric utilities.
| Company | Target Low | Target High | Consensus |
|---|---|---|---|
| Eversource Energy | 60 | 81 | 69.6 |
| CMS Energy Corporation | 74 | 82 | 78.14 |
Eversource’s consensus target sits slightly above its current price of 67.36, suggesting moderate upside. CMS’s target consensus of 78.14 implies a stronger appreciation potential from its 72.84 price, reflecting analyst confidence in its stable utility operations.

Don’t Let Luck Decide Your Entry Point
Optimize your entry points with our advanced ProRealTime indicators. You’ll get efficient buy signals with precise price targets for maximum performance. Start outperforming now!
How do institutions grade them?
Eversource Energy Grades
The following table summarizes recent analyst grades for Eversource Energy:
| Grading Company | Action | New Grade | Date |
|---|---|---|---|
| UBS | Maintain | Neutral | 2025-12-17 |
| JP Morgan | Maintain | Underweight | 2025-12-12 |
| Janney Montgomery Scott | Upgrade | Buy | 2025-11-24 |
| Scotiabank | Maintain | Sector Underperform | 2025-11-20 |
| Mizuho | Downgrade | Neutral | 2025-11-20 |
| Wells Fargo | Downgrade | Equal Weight | 2025-11-20 |
| Scotiabank | Maintain | Sector Underperform | 2025-11-06 |
| BMO Capital | Maintain | Market Perform | 2025-11-06 |
| UBS | Downgrade | Neutral | 2025-11-06 |
| Mizuho | Maintain | Outperform | 2025-10-27 |
CMS Energy Corporation Grades
Recent analyst grades for CMS Energy Corporation are listed below:
| Grading Company | Action | New Grade | Date |
|---|---|---|---|
| Mizuho | Maintain | Neutral | 2026-02-06 |
| Morgan Stanley | Maintain | Equal Weight | 2026-02-02 |
| Jefferies | Maintain | Buy | 2026-01-28 |
| Wells Fargo | Maintain | Equal Weight | 2026-01-20 |
| JP Morgan | Maintain | Overweight | 2026-01-15 |
| Jefferies | Maintain | Buy | 2026-01-15 |
| Barclays | Maintain | Overweight | 2026-01-15 |
| UBS | Maintain | Neutral | 2025-12-17 |
| JP Morgan | Maintain | Overweight | 2025-12-11 |
| Morgan Stanley | Maintain | Equal Weight | 2025-10-22 |
Which company has the best grades?
CMS Energy Corporation consistently receives higher grades, including multiple Buy and Overweight ratings. Eversource Energy shows more mixed and cautious grades. This disparity may influence investors seeking stronger analyst conviction.
Risks specific to each company
The following categories identify critical pressure points and systemic threats facing Eversource Energy and CMS Energy Corporation in the 2026 market environment:
1. Market & Competition
Eversource Energy
- Operates in regulated electric markets in three states; faces regional competition and regulatory rate caps.
CMS Energy Corporation
- Strong presence in Michigan with diverse generation mix; faces competition from renewables and regulatory shifts.
2. Capital Structure & Debt
Eversource Energy
- High debt-to-equity ratio (1.94) and low interest coverage (2.12) suggests financial leverage risk.
CMS Energy Corporation
- Slightly higher leverage (2.12 D/E); marginally better interest coverage (2.58), but still elevated financial risk.
3. Stock Volatility
Eversource Energy
- Beta of 0.79 indicates moderate volatility, less than market average, supporting stability.
CMS Energy Corporation
- Lower beta of 0.48 implies lower volatility, potentially safer during market downturns.
4. Regulatory & Legal
Eversource Energy
- Subject to multi-state regulatory bodies with evolving clean energy mandates; risk of rate case delays.
CMS Energy Corporation
- Regulated primarily in Michigan; faces regulatory scrutiny on fossil fuel generation and renewable integration policies.
5. Supply Chain & Operations
Eversource Energy
- Reliant on infrastructure in Northeast; weather events and aging assets pose operational risks.
CMS Energy Corporation
- Extensive transmission and distribution network; complexity in managing gas and electric systems increases operational risk.
6. ESG & Climate Transition
Eversource Energy
- Investing in solar and clean energy; must manage transition risks and carbon regulations in Northeast.
CMS Energy Corporation
- Diverse generation including coal and nuclear creates transition challenges; renewable development ongoing but pace critical.
7. Geopolitical Exposure
Eversource Energy
- Primarily domestic U.S. operations limit geopolitical risk; regional economic shifts impact demand.
CMS Energy Corporation
- Similar domestic focus with limited global exposure; Michigan’s economic health influences customer base and capital plans.
Which company shows a better risk-adjusted profile?
CMS Energy faces notable leverage risks but benefits from stronger profitability and lower stock volatility. Eversource’s weaker liquidity and profitability ratios heighten financial stress, reflected in its distressed Altman Z-score. CMS’s higher Piotroski score indicates better financial health. CMS shows a superior risk-adjusted profile, driven by improved operational efficiency and more favorable liquidity metrics in 2025. Eversource’s deteriorating liquidity ratios and low Altman Z-score raise caution, reinforcing concerns over near-term financial distress risks.
Final Verdict: Which stock to choose?
Eversource Energy’s superpower lies in its steady income generation and attractive dividend yield, appealing to income-focused investors. Its point of vigilance is the declining ROIC, signaling value erosion risks. This stock suits portfolios targeting stable income with moderate growth tolerance.
CMS Energy commands a strategic moat through its superior net margin and stronger return on equity, reflecting operational efficiency and profitability. It offers better liquidity and free cash flow stability relative to Eversource, fitting well within a GARP (Growth at a Reasonable Price) portfolio seeking balanced growth and safety.
If you prioritize resilient income and dividend yield, Eversource Energy is the compelling choice due to its consistent cash flow despite value challenges. However, if you seek operational efficiency combined with growth potential and comparatively stronger financial health, CMS Energy offers better stability and a quality moat, though at a modest valuation premium.
Disclaimer: Investment carries a risk of loss of initial capital. The past performance is not a reliable indicator of future results. Be sure to understand risks before making an investment decision.
Go Further
I encourage you to read the complete analyses of Eversource Energy and CMS Energy Corporation to enhance your investment decisions: