Home > Comparison > Utilities > CMS vs EVRG
The strategic rivalry between CMS Energy Corporation and Evergy, Inc. shapes the competitive landscape of the regulated electric utilities sector. CMS operates a diversified utility model with electric and gas segments across Michigan, emphasizing integrated energy solutions. Evergy focuses on electric generation and distribution in Kansas and Missouri with a strong transmission footprint. This analysis pits their operational strengths against each other to identify which offers a superior risk-adjusted return for a diversified portfolio in today’s evolving energy market.
Table of contents
Companies Overview
CMS Energy Corporation and Evergy, Inc. stand as key players in the regulated electric utility market, shaping regional energy landscapes.
CMS Energy Corporation: Michigan’s Diverse Energy Provider
CMS Energy dominates Michigan’s utility sector with a diversified energy portfolio spanning electric and gas utilities. It generates revenue by selling electricity and natural gas to 3.7M combined customers. In 2026, CMS emphasizes expanding renewable energy sources while maintaining robust transmission and distribution infrastructure.
Evergy, Inc.: Midwestern Power Consolidator
Evergy operates primarily in Kansas and Missouri, focusing on electricity generation and distribution for over 1.6M customers. It leverages coal, natural gas, and renewables to sustain revenue growth. Its 2026 strategy centers on modernizing grids and increasing renewable capacity to enhance reliability and sustainability.
Strategic Collision: Similarities & Divergences
Both companies rely on regulated electric utility models but diverge in scale and energy mix diversity. CMS’s broader gas integration contrasts with Evergy’s concentrated electric focus. Their battleground lies in renewable adoption and grid modernization. CMS offers a more complex, multi-utility profile, while Evergy presents a streamlined electric play, shaping distinct risk-return profiles for investors.
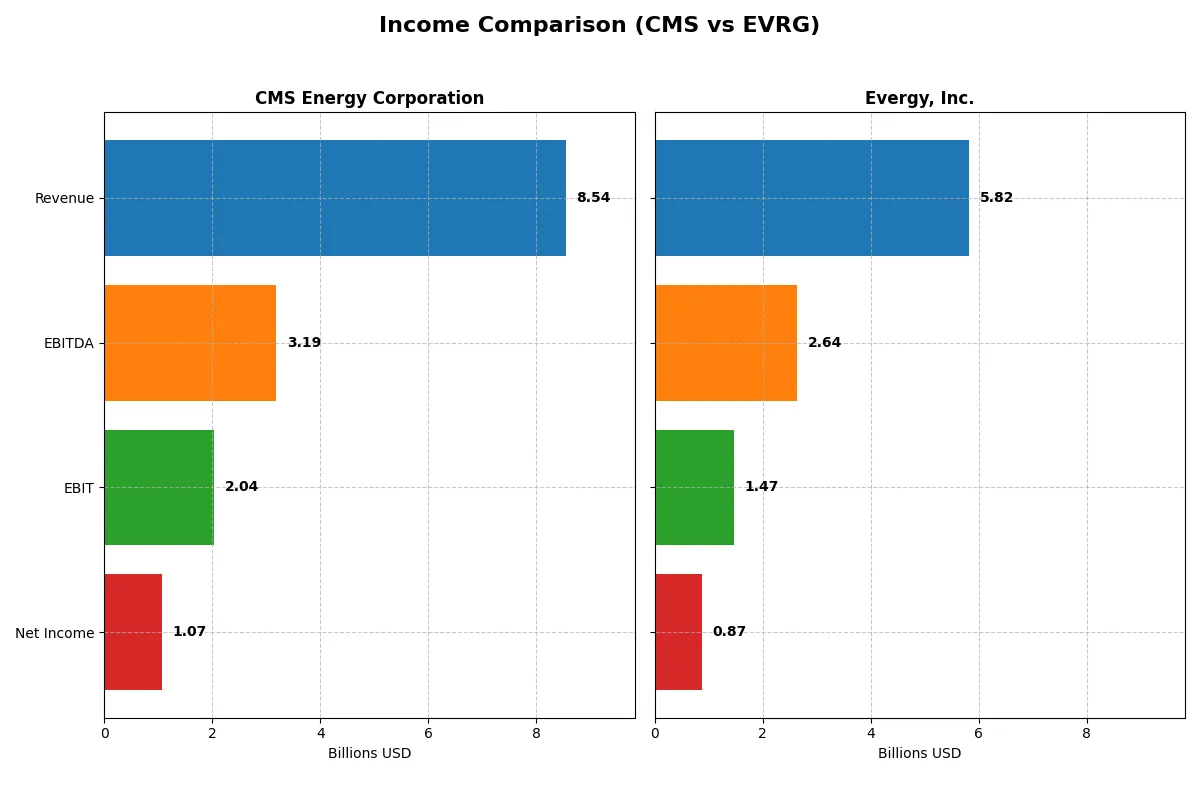
Income Statement Comparison
This data dissects the core profitability and scalability of both corporate engines to reveal who dominates the bottom line:
| Metric | CMS Energy Corporation (CMS) | Evergy, Inc. (EVRG) |
|---|---|---|
| Revenue | 8.54B | 5.82B |
| Cost of Revenue | 3.34B | 3.93B |
| Operating Expenses | 3.47B | 453M |
| Gross Profit | 5.20B | 1.90B |
| EBITDA | 3.19B | 2.64B |
| EBIT | 2.04B | 1.47B |
| Interest Expense | 789M | 563M |
| Net Income | 1.07B | 873M |
| EPS | 3.53 | 3.79 |
| Fiscal Year | 2025 | 2024 |
Income Statement Analysis: The Bottom-Line Duel
This income statement comparison reveals which company runs a more efficient and profitable corporate engine in recent years.
CMS Energy Corporation Analysis
CMS posted steady revenue growth, reaching $8.54B in 2025, up 13.6% from 2024. Gross margin climbed sharply to 60.9%, indicating strong cost control. Despite a slight dip in net margin to 12.5%, CMS’s EBIT margin remains healthy at 23.9%. The 2025 figures show solid momentum in gross profit and operating income, reflecting operational efficiency.
Evergy, Inc. Analysis
Evergy’s revenue grew moderately by 6.2% to $5.82B in 2024 with a gross margin of 32.6%. EBIT margin improved to 25.3%, signaling effective cost management. Net margin rose to 15%, supported by a 12.5% net margin growth over the past year. Evergy’s overall income statement strength appears more consistent, with robust net income and EPS growth.
Margin Strength vs. Growth Momentum
CMS delivers superior gross margins and strong revenue expansion but struggles with net income and margin contraction. Evergy maintains lower gross margins but achieves better net margin growth and consistent profitability gains. For investors, Evergy’s profile offers a more balanced margin expansion and bottom-line growth dynamic.
Financial Ratios Comparison
These vital ratios act as a diagnostic tool to expose the underlying fiscal health, valuation premiums, and capital efficiency of the companies compared below:
| Ratios | CMS Energy Corporation (CMS) | Evergy, Inc. (EVRG) |
|---|---|---|
| ROE | 12.01% | 8.77% |
| ROIC | 3.71% | 4.52% |
| P/E | 19.49 | 16.23 |
| P/B | 2.34 | 1.42 |
| Current Ratio | 1.34 | 0.50 |
| Quick Ratio | 1.34 | 0.27 |
| D/E (Debt-to-Equity) | 2.12 | 1.41 |
| Debt-to-Assets | 47.31% | 43.58% |
| Interest Coverage | 2.19 | 2.57 |
| Asset Turnover | 0.21 | 0.18 |
| Fixed Asset Turnover | 0.28 | 0.23 |
| Payout ratio | 60.48% | 68.31% |
| Dividend yield | 3.10% | 4.21% |
| Fiscal Year | 2025 | 2024 |
Efficiency & Valuation Duel: The Vital Signs
Ratios act as a company’s DNA, exposing hidden risks and revealing operational excellence crucial for investment decisions.
CMS Energy Corporation
CMS shows a solid net margin of 12.54% and a neutral ROE at 12.01%, indicating stable profitability. Its P/E of 19.49 suggests a fairly valued stock, neither cheap nor stretched. CMS offers a 3.1% dividend yield, rewarding shareholders amid a cautious capital structure with a debt-to-equity ratio of 2.12.
Evergy, Inc.
Evergy delivers a higher net margin at 15.0%, but a weaker ROE of 8.77%, signaling less equity efficiency. Its P/E of 16.23 implies reasonable valuation, slightly more attractive than CMS. The 4.21% dividend yield outpaces CMS, reflecting a stronger cash return to shareholders despite a lower current ratio of 0.5, which raises liquidity concerns.
Dividend Yield vs. Operational Efficiency: Balancing Risk and Return
CMS balances profitability and shareholder returns with moderate valuation and stable dividends. Evergy offers a higher dividend yield but faces liquidity and efficiency challenges. CMS fits investors prioritizing operational safety; Evergy suits those seeking income with higher risk tolerance.
Which one offers the Superior Shareholder Reward?
I compare CMS Energy Corporation (CMS) and Evergy, Inc. (EVRG) on dividends, payout ratios, and buybacks to assess total shareholder return. CMS yields ~3.1% with a 60% payout ratio, well-covered by free cash flow. EVRG offers a higher yield near 4.2% but with a riskier 68% payout ratio and negative free cash flow. CMS’s buyback activity is modest but more sustainable given its stable free cash flow. EVRG’s aggressive dividends and buybacks could strain cash flow long-term. I conclude CMS delivers a superior, more sustainable shareholder reward profile in 2026.
Comparative Score Analysis: The Strategic Profile
The radar chart reveals the fundamental DNA and trade-offs of CMS Energy Corporation and Evergy, Inc., highlighting their financial strengths and vulnerabilities:
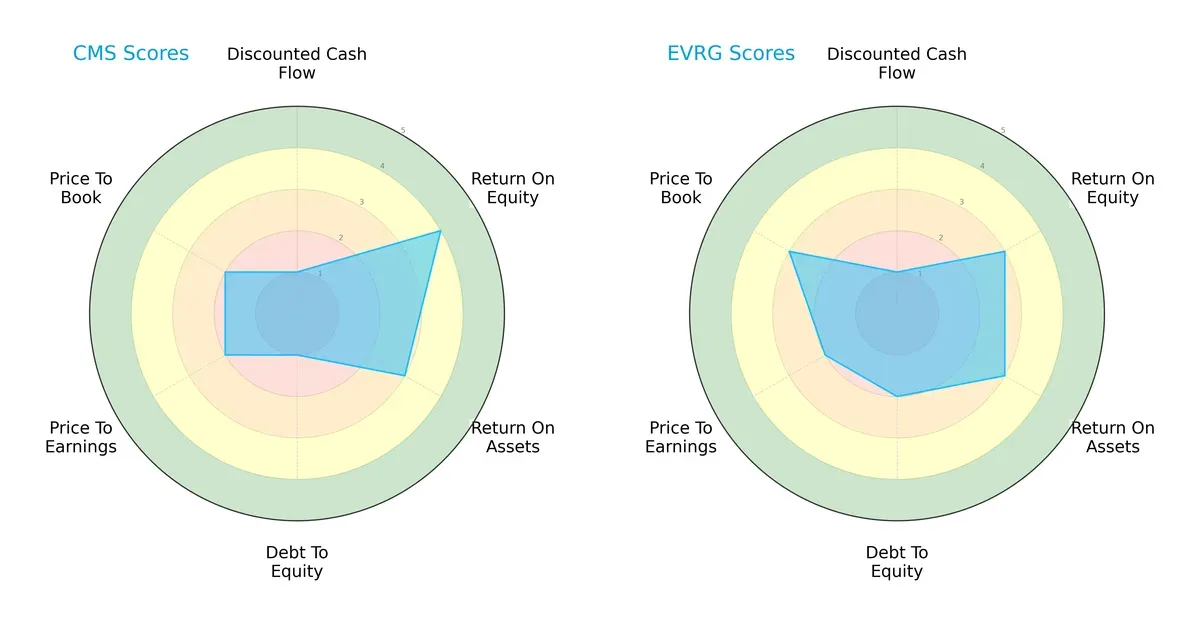
CMS exhibits a stronger return on equity (4 vs. 3) and a moderate return on assets (3 each), signaling efficient profit generation. However, its debt-to-equity score is very unfavorable (1), indicating higher leverage risk compared to Evergy’s moderate position (2). Both firms share weak discounted cash flow scores (1), suggesting valuation challenges. Evergy edges CMS on price-to-book (3 vs. 2), reflecting relatively better market valuation discipline. Overall, Evergy presents a more balanced profile, while CMS leans heavily on operational efficiency but carries financial risk.
Bankruptcy Risk: Solvency Showdown
CMS and Evergy both register Altman Z-Scores below 1, placing them firmly in the distress zone:
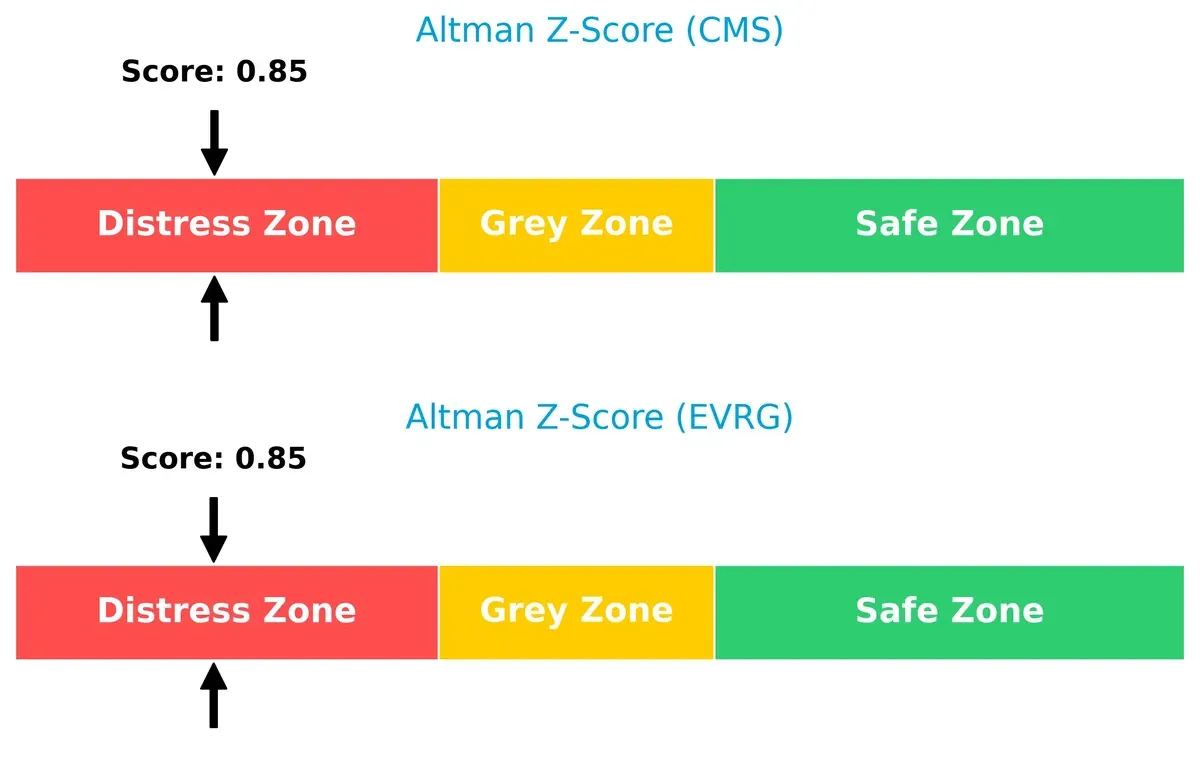
These low scores warn of heightened bankruptcy risk in this economic cycle. Both companies face significant solvency challenges, demanding cautious risk management from investors.
Financial Health: Quality of Operations
CMS outperforms Evergy on the Piotroski F-Score scale, scoring 7 (strong) versus Evergy’s 5 (average):
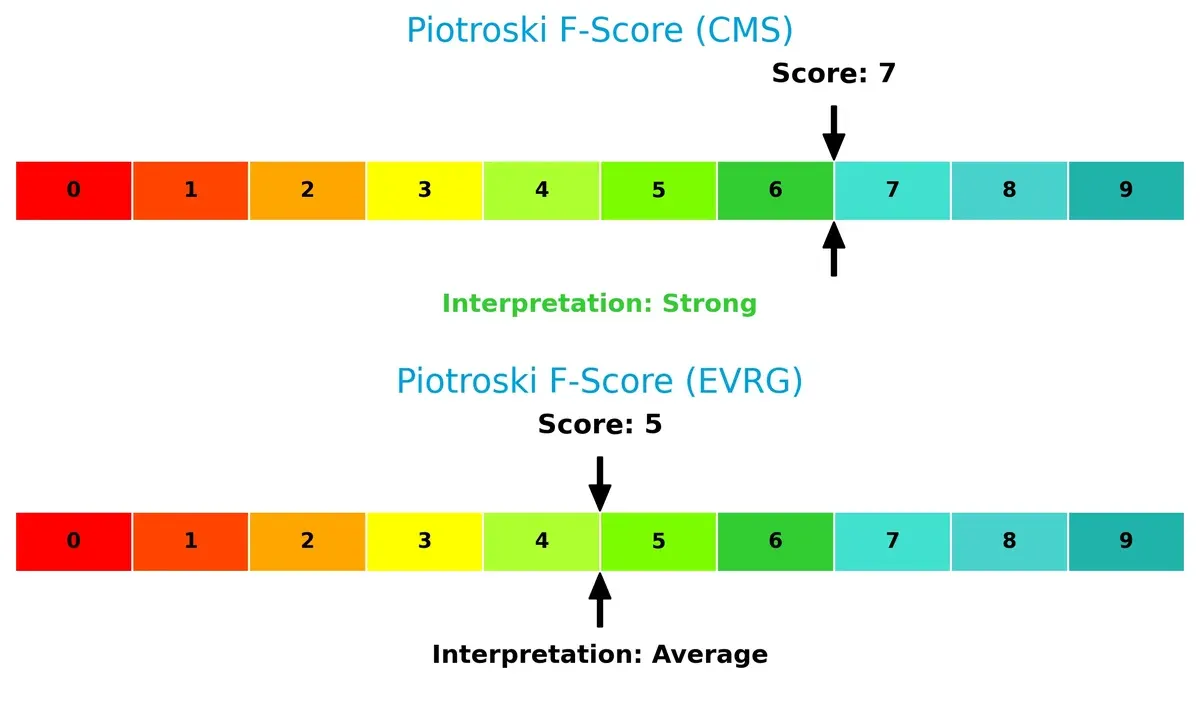
CMS demonstrates superior internal financial health with fewer red flags in profitability and efficiency metrics. Evergy’s middling score suggests room for operational improvement, which could impact its investment appeal.
How are the two companies positioned?
This section dissects the operational DNA of CMS and Evergy by comparing their revenue distribution and internal dynamics. The goal is to confront their economic moats to identify which model offers the most resilient competitive advantage today.
Revenue Segmentation: The Strategic Mix
This visual comparison dissects how CMS Energy Corporation and Evergy, Inc. diversify their income streams and where their primary sector bets lie:
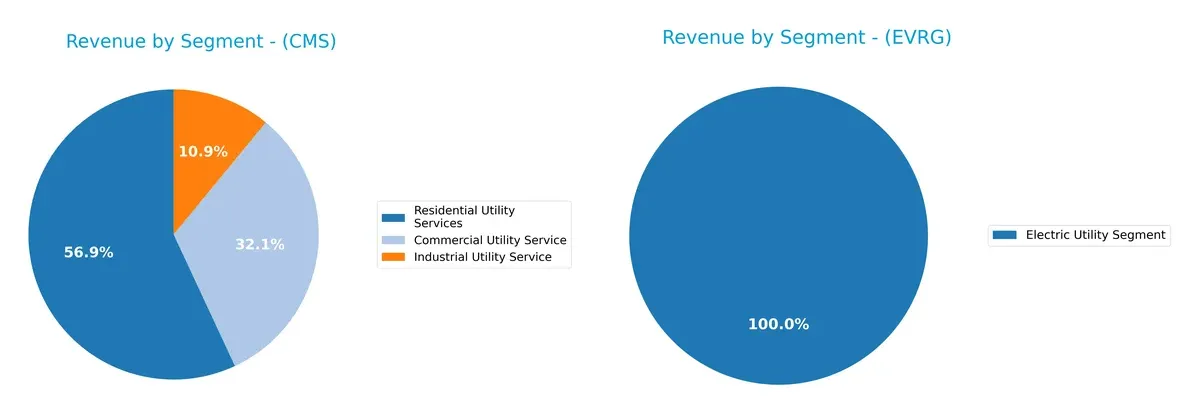
CMS shows a diversified revenue base with Residential Utility Services anchoring at $3.75B and Commercial Utility Service contributing $2.11B, plus $720M from Industrial Utility Service. Evergy relies solely on its Electric Utility Segment, reporting about $2.7B. CMS’s spread reduces concentration risk and leverages multiple customer bases, while Evergy’s single-segment focus signals infrastructure dominance but heightens exposure to sector-specific shocks.
Strengths and Weaknesses Comparison
This table compares the Strengths and Weaknesses of CMS Energy Corporation and Evergy, Inc.:
CMS Strengths
- Diversified revenue across commercial, industrial, and residential utility services
- Favorable net margin at 12.54%
- Favorable quick ratio at 1.34
- Favorable dividend yield at 3.1%
Evergy Strengths
- Higher net margin at 15.0%
- Favorable price-to-book ratio at 1.42
- Favorable dividend yield at 4.21%
- Diversified electric utility segment revenue
CMS Weaknesses
- Unfavorable return on invested capital at 3.71% below WACC
- Unfavorable debt-to-equity ratio at 2.12
- Unfavorable asset turnover ratios
- Neutral return on equity at 12.01%
Evergy Weaknesses
- Unfavorable return on equity at 8.77% and ROIC at 4.52% below WACC
- Unfavorable current (0.5) and quick ratios (0.27)
- Unfavorable debt-to-equity at 1.41
- Unfavorable asset turnover ratios
CMS shows balanced strengths in profitability and liquidity, with diversification across segments but faces capital efficiency challenges. Evergy excels in profitability metrics but suffers from liquidity and leverage weaknesses. These profiles suggest distinct strategic priorities for financial health and operational efficiency.
The Moat Duel: Analyzing Competitive Defensibility
A structural moat alone shields long-term profits from relentless competition’s erosion. Let’s dissect the moat dynamics between two regulated electric utilities:
CMS Energy Corporation: Asset-Heavy Infrastructure Moat
CMS leverages extensive regulated electric and gas infrastructure as its moat. Despite strong gross margins near 61%, its declining ROIC signals deteriorating capital efficiency. New renewable projects in 2026 could stabilize margins but face stiff regulatory scrutiny.
Evergy, Inc.: Operational Efficiency and Growth Moat
Evergy builds its moat on improving operational efficiency and expanding renewables. It shows steady ROIC growth despite currently shedding value relative to WACC. Its broader transmission network and rising net margins suggest better adaptability to market shifts in 2026.
Verdict: Infrastructure Stability vs. Growth Momentum
CMS’s capital-intensive moat is deeper but weakening due to value destruction and declining ROIC. Evergy’s slightly unfavorable moat status masks improving profitability and growth momentum. I see Evergy better positioned to defend and expand market share in a dynamic energy landscape.
Which stock offers better returns?
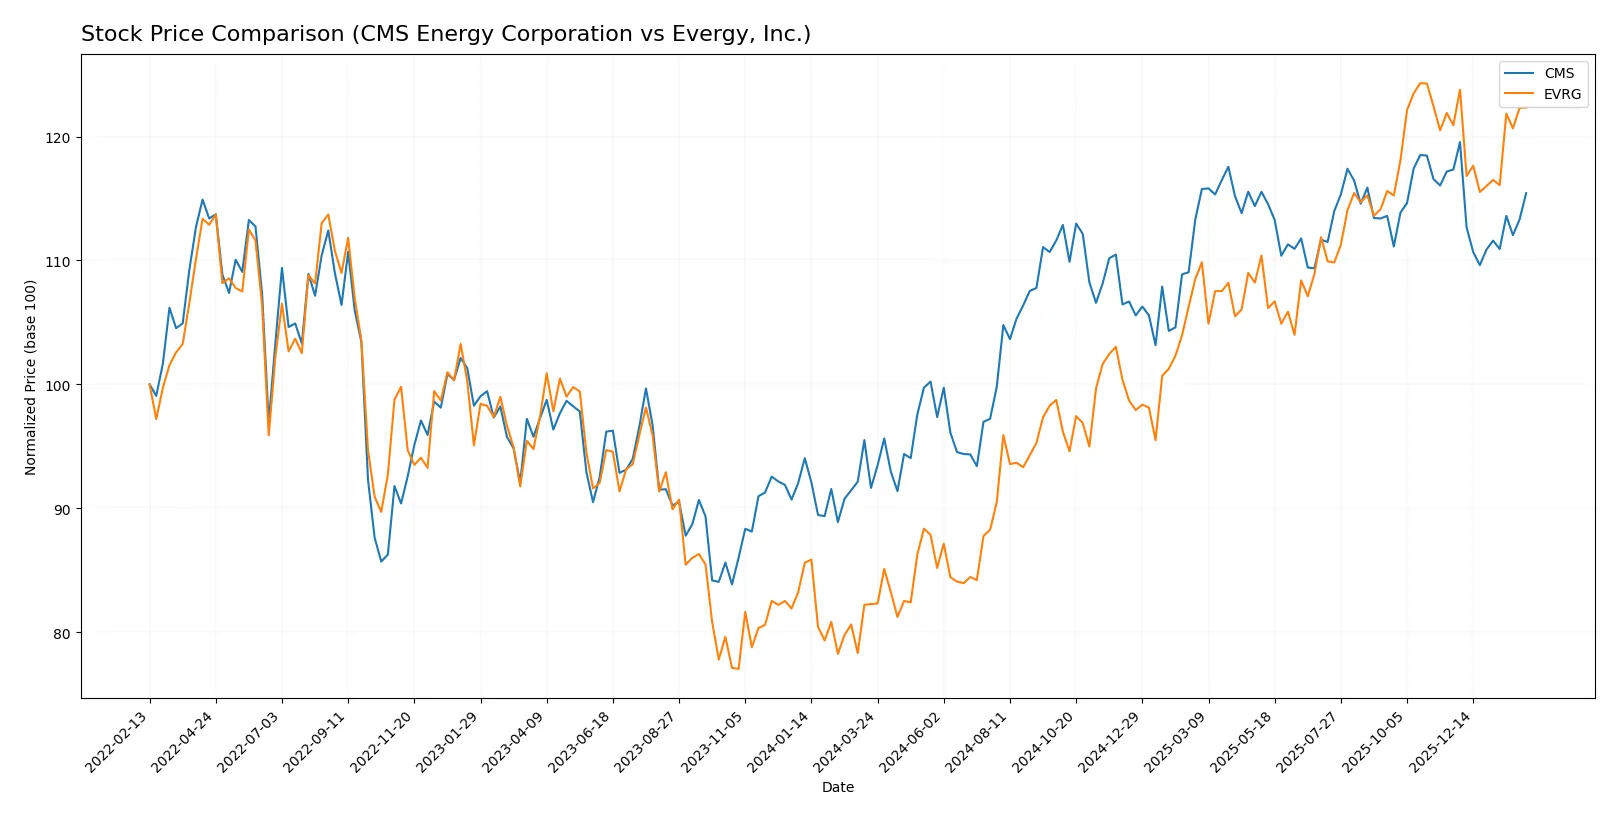
Both CMS Energy Corporation and Evergy, Inc. showed notable price appreciation over the past 12 months, with distinct trading volumes and momentum shifts shaping their recent dynamics.
Trend Comparison
CMS Energy Corporation’s stock gained 26.0% over the last year, reflecting a bullish trend with decelerating momentum. The price ranged between 57.66 and 75.44, with recent minor correction of -1.62%.
Evergy, Inc. outperformed with a 48.7% rise over the same period, also bullish but slowing down. Its price fluctuated from 50.95 to 77.98, with a slight recent uptick of 1.19%.
Comparing both, Evergy delivered the highest market returns, nearly doubling CMS’s growth in the past year despite both showing signs of trend deceleration.
Target Prices
Analysts present a moderately bullish consensus for CMS Energy Corporation and Evergy, Inc., reflecting confidence in regulated utilities.
| Company | Target Low | Target High | Consensus |
|---|---|---|---|
| CMS Energy Corporation | 74 | 82 | 78.14 |
| Evergy, Inc. | 76 | 91 | 82.67 |
Both stocks trade below their consensus targets, suggesting upside potential. CMS’s current price of 72.84 is near its lower target band, while Evergy’s 76.75 sits closer to its low estimate, signaling cautious optimism from analysts.

Don’t Let Luck Decide Your Entry Point
Optimize your entry points with our advanced ProRealTime indicators. You’ll get efficient buy signals with precise price targets for maximum performance. Start outperforming now!
How do institutions grade them?
Here is a summary of recent institutional grades for CMS Energy Corporation and Evergy, Inc.:
CMS Energy Corporation Grades
The following table shows recent grades assigned to CMS Energy Corporation by reputable institutions.
| Grading Company | Action | New Grade | Date |
|---|---|---|---|
| Mizuho | Maintain | Neutral | 2026-02-06 |
| Morgan Stanley | Maintain | Equal Weight | 2026-02-02 |
| Jefferies | Maintain | Buy | 2026-01-28 |
| Wells Fargo | Maintain | Equal Weight | 2026-01-20 |
| JP Morgan | Maintain | Overweight | 2026-01-15 |
| Jefferies | Maintain | Buy | 2026-01-15 |
| Barclays | Maintain | Overweight | 2026-01-15 |
| UBS | Maintain | Neutral | 2025-12-17 |
| JP Morgan | Maintain | Overweight | 2025-12-11 |
| Morgan Stanley | Maintain | Equal Weight | 2025-10-22 |
Evergy, Inc. Grades
Below are the latest grades for Evergy, Inc. from recognized grading firms.
| Grading Company | Action | New Grade | Date |
|---|---|---|---|
| BMO Capital | Maintain | Outperform | 2026-01-27 |
| Barclays | Maintain | Overweight | 2026-01-22 |
| Wells Fargo | Maintain | Equal Weight | 2026-01-20 |
| Mizuho | Downgrade | Neutral | 2025-12-18 |
| UBS | Maintain | Buy | 2025-12-17 |
| Citigroup | Maintain | Buy | 2025-11-10 |
| Jefferies | Maintain | Buy | 2025-10-09 |
| Mizuho | Maintain | Outperform | 2025-08-08 |
| Mizuho | Maintain | Outperform | 2025-07-18 |
| Barclays | Maintain | Overweight | 2025-05-30 |
Which company has the best grades?
Evergy, Inc. consistently receives higher ratings such as Outperform and Buy from multiple institutions. CMS Energy’s grades cluster around Neutral to Overweight, indicating slightly more cautious views. This difference may influence investor sentiment and portfolio positioning.
Risks specific to each company
The following categories identify the critical pressure points and systemic threats facing both firms in the 2026 market environment:
1. Market & Competition
CMS Energy Corporation
- Operates mainly in Michigan with a diverse energy mix, facing regional market saturation.
Evergy, Inc.
- Serves Kansas and Missouri with a slightly smaller footprint but faces growing competition in renewables.
2. Capital Structure & Debt
CMS Energy Corporation
- High debt-to-equity ratio (2.12) signals elevated leverage risk.
Evergy, Inc.
- Lower debt-to-equity (1.41) but weak liquidity ratios raise solvency concerns.
3. Stock Volatility
CMS Energy Corporation
- Low beta (0.48) implies less stock price volatility and defensive profile.
Evergy, Inc.
- Moderate beta (0.64) suggests higher sensitivity to market swings.
4. Regulatory & Legal
CMS Energy Corporation
- Subject to Michigan state regulations; potential risks from evolving energy policies.
Evergy, Inc.
- Faces regulatory complexity across two states, increasing compliance risk.
5. Supply Chain & Operations
CMS Energy Corporation
- Extensive infrastructure with multiple energy sources; operational complexity is high.
Evergy, Inc.
- Large transmission and distribution network but smaller workforce may strain operations.
6. ESG & Climate Transition
CMS Energy Corporation
- Invests in renewables but coal and nuclear exposure pose transition risks.
Evergy, Inc.
- Diverse generation mix including renewables; ongoing shift from fossil fuels required.
7. Geopolitical Exposure
CMS Energy Corporation
- Primarily domestic with limited geopolitical risk.
Evergy, Inc.
- Domestic focus limits geopolitical exposure but regional policy shifts could impact.
Which company shows a better risk-adjusted profile?
CMS’s most impactful risk is high leverage, threatening financial flexibility. Evergy’s critical risk lies in poor liquidity, raising short-term solvency alarms. Despite CMS’s leverage, its stronger liquidity and lower stock volatility offer a better risk-adjusted profile. Evergy’s sub-1 current and quick ratios indicate pressing liquidity challenges, justifying caution.
Final Verdict: Which stock to choose?
CMS Energy Corporation’s superpower lies in its stable cash generation and solid dividend yield, appealing to income-focused investors. However, its declining ROIC signals a point of vigilance, suggesting efficiency challenges ahead. CMS fits an income and steady-growth portfolio seeking moderate risk.
Evergy, Inc. commands a strategic moat through improving profitability and a growing ROIC trend, reflecting operational momentum. Its lower valuation multiples and higher dividend yield offer relative safety compared to CMS. Evergy suits a GARP (Growth at a Reasonable Price) portfolio aiming for balanced growth with income.
If you prioritize steady income and capital preservation, CMS is compelling due to its consistent cash flow and dividend stability. However, if you seek growth with improving profitability metrics, Evergy outshines CMS by offering better earnings momentum and valuation appeal. Both carry risks—especially regarding financial leverage and cash flow quality—that investors should weigh carefully.
Disclaimer: Investment carries a risk of loss of initial capital. The past performance is not a reliable indicator of future results. Be sure to understand risks before making an investment decision.
Go Further
I encourage you to read the complete analyses of CMS Energy Corporation and Evergy, Inc. to enhance your investment decisions: