Home > Comparison > Utilities > ETR vs CMS
The strategic rivalry between Entergy Corporation and CMS Energy Corporation shapes the Utilities sector’s future in the U.S. Entergy operates a capital-intensive, diversified power generation model with nuclear and wholesale commodities, while CMS focuses on an integrated electric and gas utility business primarily in Michigan. This analysis pits Entergy’s scale and generation diversity against CMS’s regional utility strength to identify which offers a superior risk-adjusted return for a diversified portfolio.
Table of contents
Companies Overview
Entergy Corporation and CMS Energy Corporation stand as significant players in the regulated electric utility sector in the United States.
Entergy Corporation: Integrated Power Producer and Distributor
Entergy Corporation operates as a regulated electric utility serving 3M customers across Arkansas, Louisiana, Mississippi, and Texas. Its core revenue derives from electric power generation and retail distribution through diverse fuel sources, including nuclear, gas, coal, hydro, and solar. In 2026, Entergy emphasizes maintaining and decommissioning nuclear assets while balancing wholesale and retail power sales to sustain its competitive edge.
CMS Energy Corporation: Regional Energy Provider with Multi-Segment Operations
CMS Energy Corporation drives revenue primarily from electricity and natural gas services delivered to 1.9M electric and 1.8M gas customers in Michigan. Its business spans electric and gas utilities plus renewable power development, showcasing a multi-segment utility model. The company’s 2026 strategic focus lies in expanding renewable generation alongside managing extensive distribution infrastructure to improve service reliability.
Strategic Collision: Similarities & Divergences
Both companies anchor their models in regulated utilities, yet Entergy integrates wholesale power generation with a strong nuclear footprint, while CMS diversifies into gas utilities and renewables. Their primary battleground is customer base expansion and infrastructure modernization within regional markets. Investors should note Entergy’s broader geographic scale and nuclear assets contrast with CMS’s focused multi-utility approach, defining distinct risk and growth profiles.
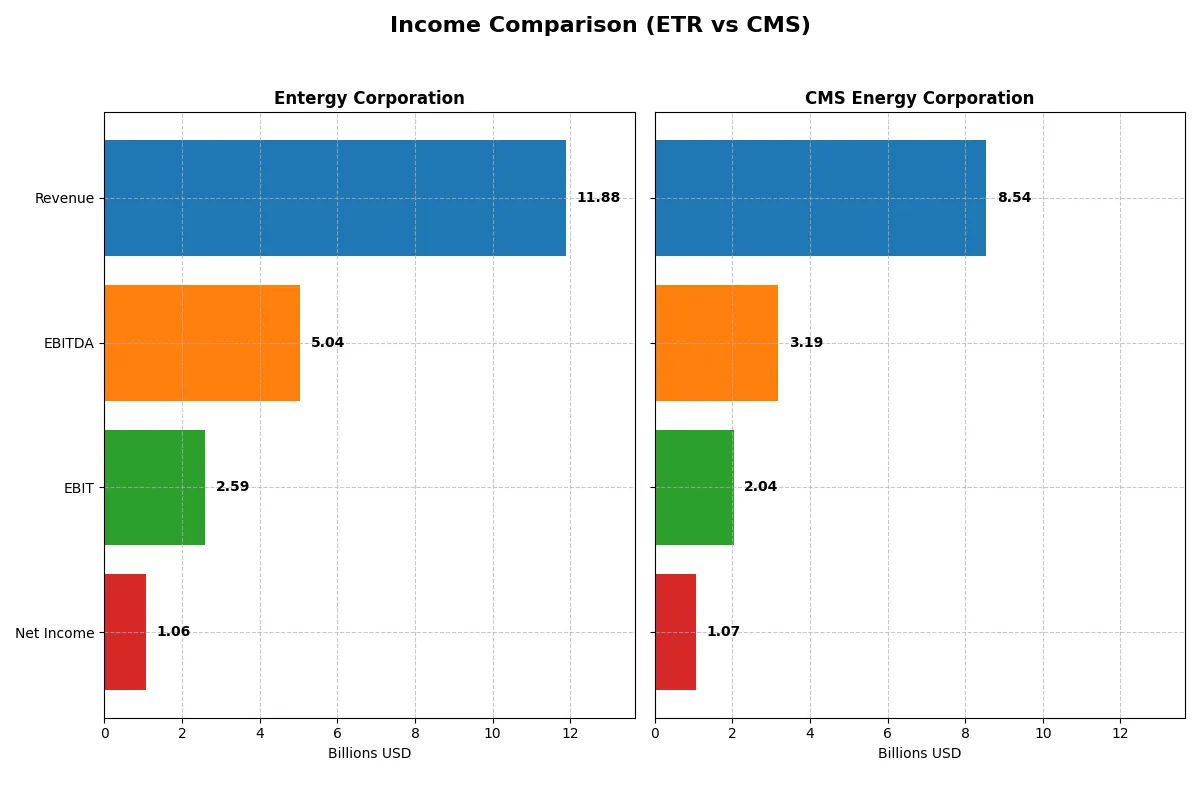
Income Statement Comparison
This data dissects the core profitability and scalability of both corporate engines to reveal who dominates the bottom line:
| Metric | Entergy Corporation (ETR) | CMS Energy Corporation (CMS) |
|---|---|---|
| Revenue | 11.9B | 7.5B |
| Cost of Revenue | 6.1B | 4.3B |
| Operating Expenses | 3.1B | 1.7B |
| Gross Profit | 5.7B | 3.2B |
| EBITDA | 5.0B | 3.1B |
| EBIT | 2.6B | 1.8B |
| Interest Expense | 1.2B | 0.7B |
| Net Income | 1.1B | 1.0B |
| EPS | 2.47 | 3.34 |
| Fiscal Year | 2024 | 2024 |
Income Statement Analysis: The Bottom-Line Duel
This income statement comparison reveals which company converts its revenue into profits most efficiently and sustainably.
Entergy Corporation Analysis
Entergy’s revenue shows a moderate 17% rise over five years but declined 2.2% in 2024. Net income fell sharply by 25% overall, with a 54% dip in net margin last year. Gross margin remains solid at 48.3%, but net margin compression and a 3.2% EBIT decline signal weakening profitability momentum.
CMS Energy Corporation Analysis
CMS posts strong revenue growth of 16.5% over five years and a 13.6% jump in 2025. Gross margin stands robust at 60.9%, and EBIT margin improved to 23.9%. Despite a slight 6% net margin contraction last year, EPS growth of 6% and consistent operating income gains reflect improving operational leverage.
Margin Strength vs. Growth Momentum
CMS outperforms Entergy with higher margins and more consistent revenue and EBIT growth. Entergy’s shrinking net margins and income decline contrast with CMS’s efficient cost control and rising profitability. For investors, CMS’s profile offers a stronger combination of margin power and growth momentum.
Financial Ratios Comparison
These vital ratios act as a diagnostic tool to expose the underlying fiscal health, valuation premiums, and capital efficiency of the companies compared below:
| Ratios | Entergy Corporation (ETR) | CMS Energy Corporation (CMS) |
|---|---|---|
| ROE | 6.9% | 12.0% |
| ROIC | 3.2% | 3.7% |
| P/E | 30.6 | 19.5 |
| P/B | 2.12 | 2.34 |
| Current Ratio | 0.70 | 1.34 |
| Quick Ratio | 0.41 | 1.34 |
| D/E | 1.92 | 2.12 |
| Debt-to-Assets | 45.2% | 47.3% |
| Interest Coverage | 2.30 | 2.19 |
| Asset Turnover | 0.18 | 0.21 |
| Fixed Asset Turnover | 0.25 | 0.28 |
| Payout Ratio | 94.2% | 60.5% |
| Dividend Yield | 3.08% | 3.10% |
| Fiscal Year | 2024 | 2025 |
Efficiency & Valuation Duel: The Vital Signs
Financial ratios act as a company’s DNA, unveiling hidden risks and operational strengths essential for investor insight.
Entergy Corporation
Entergy reports a modest 6.9% ROE with an 8.93% net margin, signaling restrained profitability. Its P/E of 30.56 suggests a stretched valuation compared to peers. The company sustains shareholder returns via a 3.08% dividend yield, balancing modest growth with income despite unfavorable leverage and liquidity ratios.
CMS Energy Corporation
CMS posts a stronger 12.0% ROE and a favorable 12.54% net margin, reflecting efficient operations. The P/E stands at 19.49, indicating a fair valuation. CMS delivers a 3.1% dividend yield and maintains solid liquidity ratios, supporting both income and operational stability despite moderately high debt.
Balanced Profitability Meets Valuation Discipline
CMS Energy offers a better blend of profitability and valuation, with stronger returns and more favorable liquidity. Entergy’s higher P/E and weaker leverage signal elevated risk. Investors seeking operational efficiency and income stability may find CMS’s profile more aligned with prudent portfolio construction.
Which one offers the Superior Shareholder Reward?
I observe that Entergy Corporation (ETR) delivers higher dividend yields, around 3.5–4.4%, with payout ratios nearing 94%, signaling aggressive income distribution but strained free cash flow (FCF) coverage. CMS Energy Corporation (CMS) yields slightly lower at 3.1–3.4%, with payout ratios near 60%, supporting more sustainable dividends backed by positive FCF. CMS’s consistent buyback activity, reflected in positive free cash flow per share (7.5), contrasts with ETR’s negative FCF, limiting buybacks. Historically, CMS balances dividends and buybacks prudently, ensuring durable shareholder returns. I conclude CMS offers a superior total return profile in 2026 due to its sustainable capital allocation and healthier FCF coverage.
Comparative Score Analysis: The Strategic Profile
The radar chart reveals the fundamental DNA and trade-offs of Entergy Corporation and CMS Energy Corporation, highlighting their financial strengths and weaknesses:
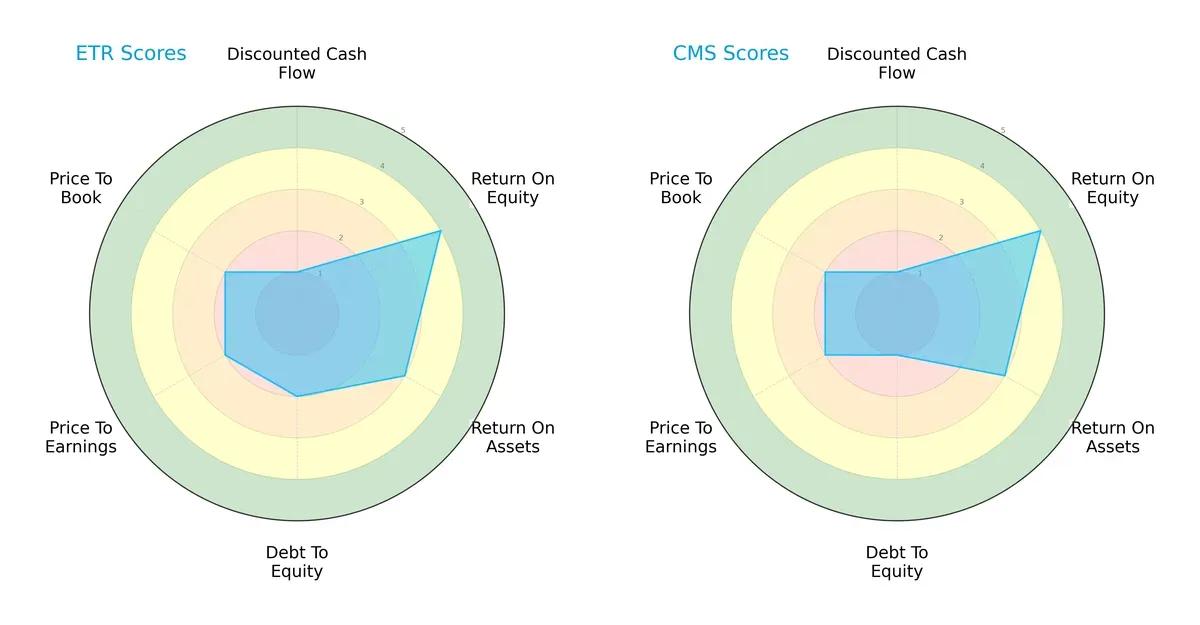
Both companies share similar overall scores, with moderate efficiency in ROE (4) and ROA (3). Entergy shows a slight edge in debt management (Debt/Equity score 2 vs. CMS’s 1), suggesting a more balanced risk profile. However, both struggle with valuation metrics (PE and PB scores of 2), indicating potential overvaluation or market skepticism. Entergy’s profile appears more balanced, while CMS relies heavily on operational returns despite higher leverage risks.
Bankruptcy Risk: Solvency Showdown
Entergy’s Altman Z-Score of 1.04 slightly outperforms CMS’s 0.85, but both reside in the distress zone, signaling heightened bankruptcy risk in this economic cycle:
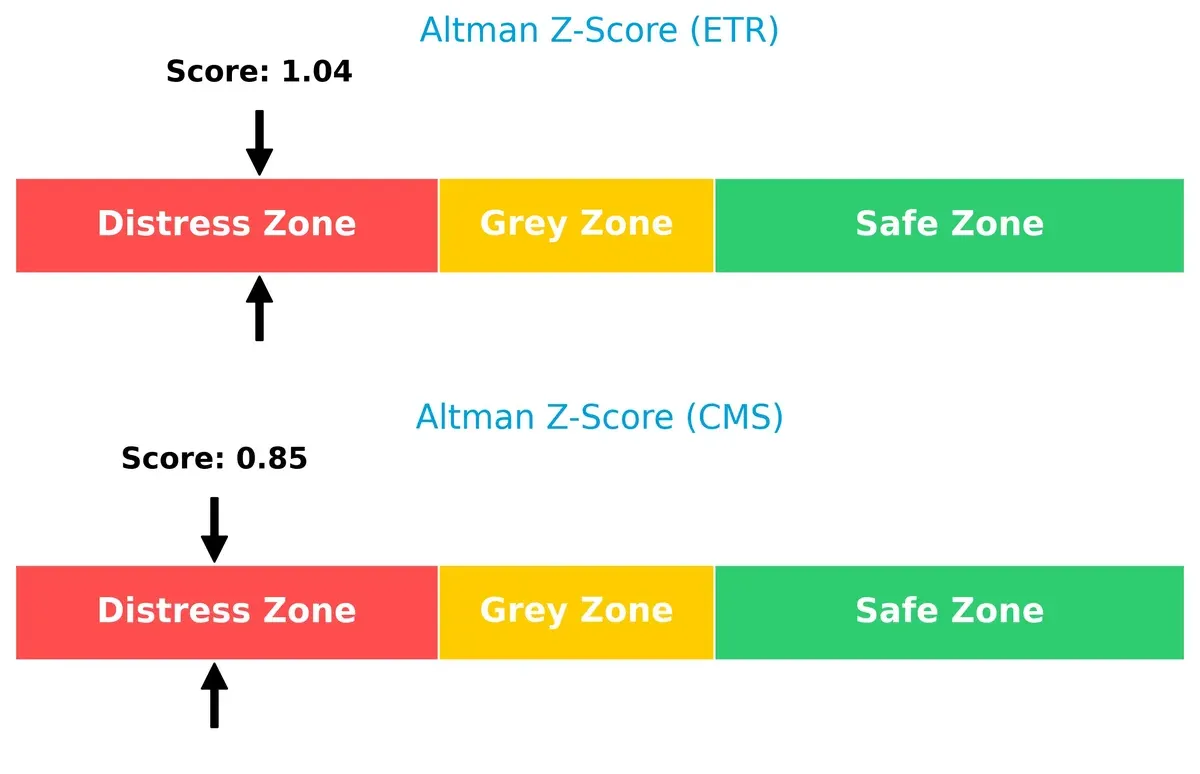
This proximity to distress highlights vulnerability for both firms, demanding caution. Entergy’s marginally better solvency suggests it manages financial stress slightly more effectively, though neither is currently in a safe zone.
Financial Health: Quality of Operations
CMS leads with a strong Piotroski F-Score of 7, reflecting superior financial health and operational quality compared to Entergy’s average score of 4:

CMS demonstrates robust internal metrics, signaling effective profitability, liquidity, and efficiency management. Entergy’s middling score raises red flags about its financial robustness, warranting investor vigilance amid economic uncertainties.
How are the two companies positioned?
This section dissects Entergy and CMS’s operational DNA by comparing their revenue distribution and internal dynamics. The goal is to confront their economic moats and identify which model offers the most resilient competitive advantage today.
Revenue Segmentation: The Strategic Mix
This comparison dissects how Entergy Corporation and CMS Energy Corporation diversify income streams and reveals each firm’s primary sector bets:
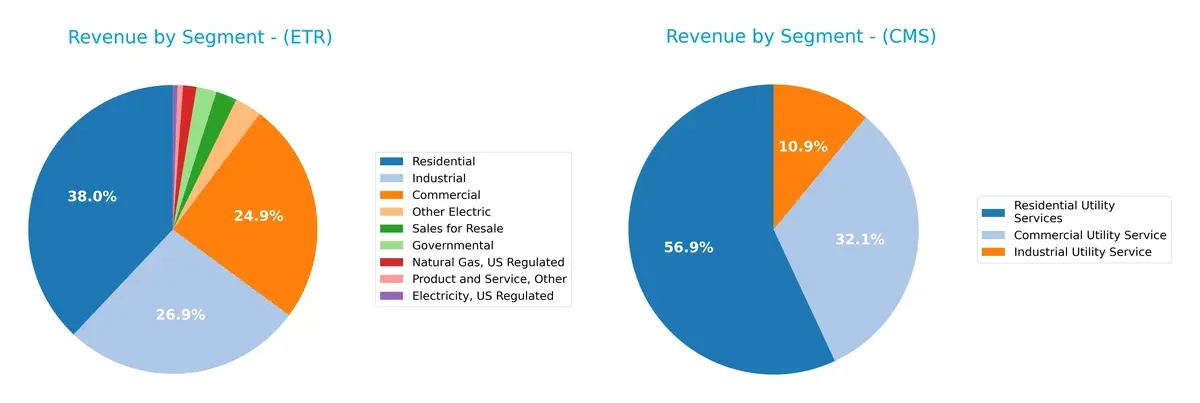
Entergy leans on a broader portfolio with Residential at $4.5B and Industrial near $3.2B, plus Commercial at $3B. CMS concentrates heavily on Residential at $3.7B, with Commercial and Industrial trailing at $2.1B and $720M. Entergy’s diversified mix reduces concentration risk, while CMS’s reliance on Residential signals sensitivity to consumer demand and regulatory shifts in utilities.
Strengths and Weaknesses Comparison
This table compares the strengths and weaknesses of Entergy Corporation and CMS Energy Corporation:
Entergy Corporation Strengths
- Diverse revenue streams including commercial, industrial, residential, and governmental segments
- Favorable weighted average cost of capital (5.52%)
- Dividend yield at 3.08% supports shareholder returns
CMS Energy Corporation Strengths
- Higher net margin of 12.54% indicating better profitability
- Favorable quick ratio at 1.34 reflects liquidity strength
- Dividend yield at 3.1% supports income investors
Entergy Corporation Weaknesses
- Unfavorable return on equity (6.93%) and ROIC (3.19%) below WACC
- Low current and quick ratios indicate liquidity concerns
- High debt-to-equity (1.92) may pressure financial stability
CMS Energy Corporation Weaknesses
- Return on invested capital (3.71%) is unfavorable relative to WACC
- Elevated debt-to-equity (2.12) signals leverage risks
- Asset turnover ratios remain weak, limiting efficiency
Both companies show strengths in shareholder yield and cost of capital management. However, liquidity and efficiency metrics remain key challenges. These factors will influence strategic decisions on capital allocation and operational improvements.
The Moat Duel: Analyzing Competitive Defensibility
A structural moat is the only safeguard preventing long-term profits from being eroded by relentless competition. Let’s dissect the moats of two utilities giants:
Entergy Corporation: Nuclear and Diversified Asset Base Moat
Entergy’s competitive edge lies in its diversified power generation, anchored by 6,000 MW of nuclear capacity. This supports stable margins but declining ROIC signals rising risks to its economic moat in 2026.
CMS Energy Corporation: Integrated Utility Network Moat
CMS leverages an extensive electric and gas infrastructure serving 3.7M customers, creating high switching costs. Despite a similar ROIC decline, CMS’s stronger revenue growth hints at better moat resilience and market expansion potential.
Nuclear Capacity vs. Infrastructure Lock-In: The Moat Showdown
Both companies face shrinking economic moats with ROIC below WACC. However, CMS’s integrated utility network delivers a wider moat, better revenue growth, and more robust margin stability. CMS stands better poised to defend market share amid regulatory and market shifts.
Which stock offers better returns?
Over the past 12 months, Entergy Corporation surged sharply with a strong price gain, while CMS Energy Corporation posted moderate gains amid decelerating momentum.
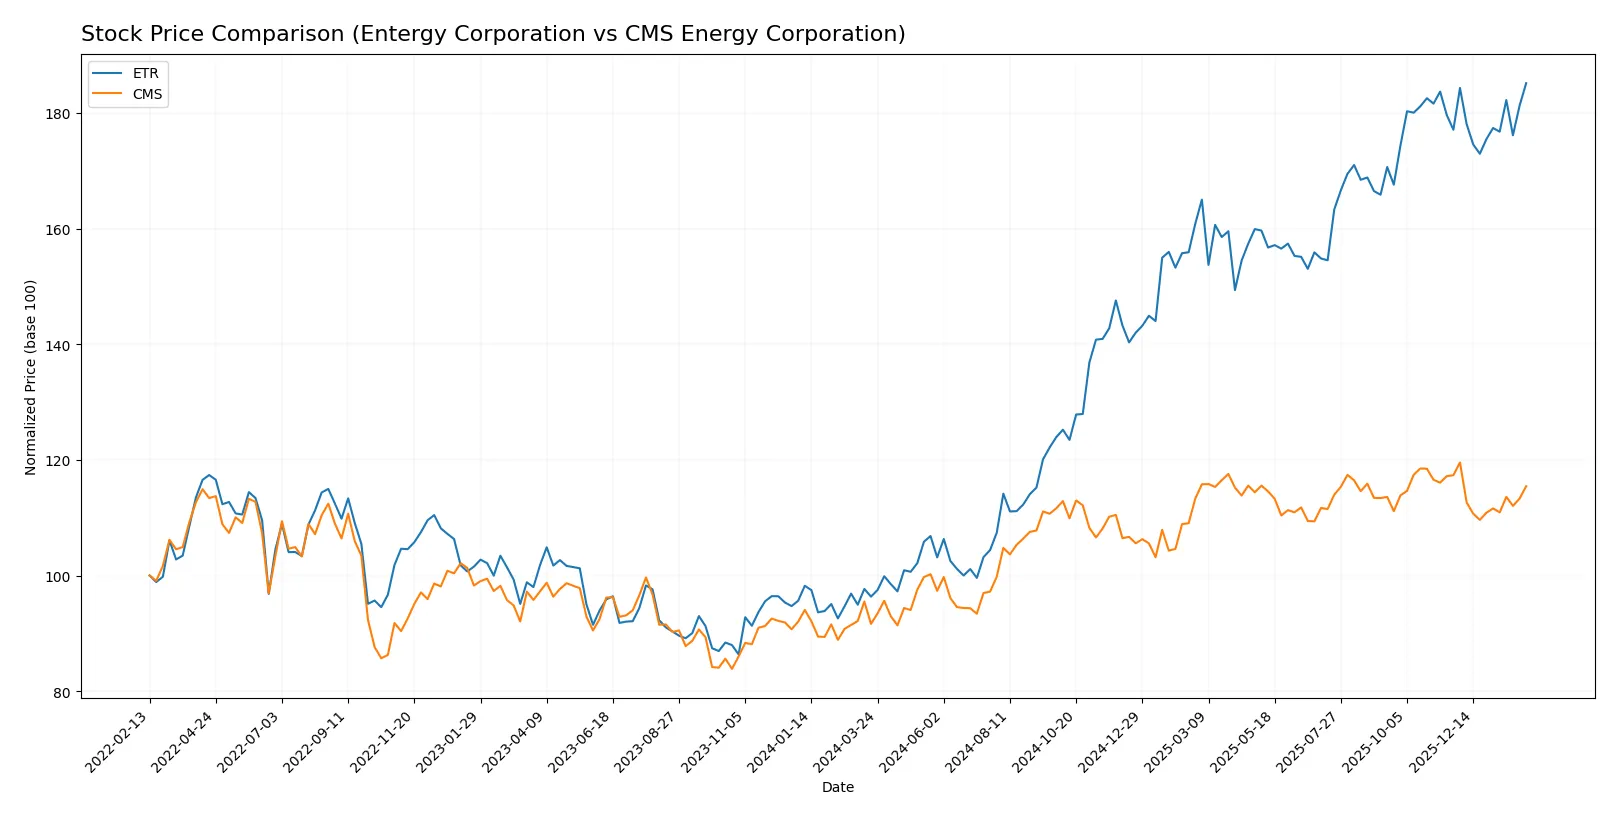
Trend Comparison
Entergy Corporation’s stock rose 92.15% over the past year, indicating a clear bullish trend with decelerating price acceleration and high volatility (14.93 std deviation). The price peaked at 97.96 and bottomed at 50.98.
CMS Energy Corporation gained 25.98% over the same period, also bullish but with decelerating momentum and lower volatility (4.7 std deviation). Its price ranged between 57.66 and 75.44.
Entergy’s performance significantly outpaced CMS, delivering nearly four times the total return over the past year despite decelerating price gains in the recent months.
Target Prices
Analysts present a cautiously optimistic outlook for these regulated electric utilities.
| Company | Target Low | Target High | Consensus |
|---|---|---|---|
| Entergy Corporation | 91 | 112 | 102.75 |
| CMS Energy Corporation | 74 | 82 | 78.14 |
Entergy’s consensus target exceeds its current price of 97.96 by 5%, signaling moderate upside potential. CMS trades below its 78.14 consensus, implying a possible rebound from 72.84.

Don’t Let Luck Decide Your Entry Point
Optimize your entry points with our advanced ProRealTime indicators. You’ll get efficient buy signals with precise price targets for maximum performance. Start outperforming now!
How do institutions grade them?
Here is a comparison of recent institutional grades for Entergy Corporation and CMS Energy Corporation:
Entergy Corporation Grades
The following table summarizes recent grades assigned by notable institutions to Entergy Corporation:
| Grading Company | Action | New Grade | Date |
|---|---|---|---|
| Wells Fargo | Maintain | Overweight | 2026-01-20 |
| Barclays | Maintain | Overweight | 2026-01-15 |
| Argus Research | Maintain | Buy | 2026-01-06 |
| UBS | Maintain | Buy | 2025-12-17 |
| Keybanc | Maintain | Overweight | 2025-12-12 |
| JP Morgan | Maintain | Overweight | 2025-12-11 |
| Citigroup | Maintain | Neutral | 2025-11-18 |
| Evercore ISI Group | Maintain | In Line | 2025-10-30 |
| Mizuho | Maintain | Outperform | 2025-10-27 |
| Morgan Stanley | Maintain | Equal Weight | 2025-10-22 |
CMS Energy Corporation Grades
Below is a summary of recent institutional grades for CMS Energy Corporation:
| Grading Company | Action | New Grade | Date |
|---|---|---|---|
| Mizuho | Maintain | Neutral | 2026-02-06 |
| Morgan Stanley | Maintain | Equal Weight | 2026-02-02 |
| Jefferies | Maintain | Buy | 2026-01-28 |
| Wells Fargo | Maintain | Equal Weight | 2026-01-20 |
| JP Morgan | Maintain | Overweight | 2026-01-15 |
| Jefferies | Maintain | Buy | 2026-01-15 |
| Barclays | Maintain | Overweight | 2026-01-15 |
| UBS | Maintain | Neutral | 2025-12-17 |
| JP Morgan | Maintain | Overweight | 2025-12-11 |
| Morgan Stanley | Maintain | Equal Weight | 2025-10-22 |
Which company has the best grades?
Entergy Corporation consistently receives strong buy and overweight ratings from top firms, signaling confidence. CMS Energy shows mixed ratings with more neutral and equal weight grades, indicating a more cautious outlook. These differences could affect investor sentiment and portfolio positioning.
Risks specific to each company
The following categories identify the critical pressure points and systemic threats facing both firms in the 2026 market environment:
1. Market & Competition
Entergy Corporation
- Operates in southern US with a diverse generation mix; faces competitive pressure from renewables and wholesale market volatility.
CMS Energy Corporation
- Focused in Michigan with integrated electric and gas utilities; competition mainly from regional energy providers and growing renewables.
2. Capital Structure & Debt
Entergy Corporation
- High debt-to-equity ratio (1.92) and low current ratio (0.7) increase financial risk; interest coverage is moderate (2.25x).
CMS Energy Corporation
- Even higher debt-to-equity (2.12) but better liquidity (current ratio 1.34); interest coverage slightly better at 2.58x.
3. Stock Volatility
Entergy Corporation
- Beta of 0.65 indicates moderate stock volatility relative to the market; range near all-time highs.
CMS Energy Corporation
- Lower beta of 0.48 suggests lower volatility; stock trades in a tighter range, reflecting stability.
4. Regulatory & Legal
Entergy Corporation
- Subject to multi-state regulatory frameworks with nuclear and fossil fuel compliance risks.
CMS Energy Corporation
- Regulated primarily in Michigan; faces evolving regulatory landscape on carbon emissions and gas utility oversight.
5. Supply Chain & Operations
Entergy Corporation
- Operates complex mix of nuclear, gas, coal, hydro, and solar plants; decommissioning nuclear assets poses operational risks.
CMS Energy Corporation
- Extensive electric and gas distribution network with renewable integration challenges; gas storage and compressor station operations add complexity.
6. ESG & Climate Transition
Entergy Corporation
- Nuclear capacity provides low-carbon edge; coal and gas expose to transition risks; increasing pressure on carbon footprint reduction.
CMS Energy Corporation
- Growing renewable portfolio and gas utility mix; better positioned for energy transition but must manage methane and emissions risks.
7. Geopolitical Exposure
Entergy Corporation
- Concentrated in southern US states; limited international geopolitical risk but vulnerable to regional policy shifts.
CMS Energy Corporation
- Operations confined to Michigan; geopolitical risk minimal but dependent on state energy policies and regulatory changes.
Which company shows a better risk-adjusted profile?
Entergy’s most impactful risk is its stretched liquidity and leverage, reflected in a distressed Altman Z-Score (1.04) and unfavorable financial ratios. CMS’s single biggest risk is its elevated debt load despite stronger liquidity and a better Piotroski score (7 vs. 4). CMS’s better liquidity and stronger operational scores give it a more resilient risk-adjusted profile in 2026, despite both firms facing structural sector headwinds.
Final Verdict: Which stock to choose?
Entergy Corporation (ETR) showcases a cash-generating prowess rooted in its ability to sustain solid gross and EBIT margins, despite a challenging environment. Its key point of vigilance is the declining profitability and unfavorable liquidity, signaling potential operational strains. ETR suits investors with an appetite for aggressive growth tempered by risk tolerance.
CMS Energy Corporation (CMS) stands out with a strategic moat in its stable recurring revenue and stronger balance sheet liquidity. Its income statement shows more consistent growth and a healthier free cash flow yield compared to ETR. CMS fits well within a GARP portfolio seeking steady income with moderate growth potential.
If you prioritize aggressive growth and are comfortable navigating operational headwinds, Entergy’s robust margin profile might be compelling. However, if you seek better financial stability and a strategic moat offering more predictable returns, CMS outshines as the safer choice with a steadier growth trajectory. Both companies carry risks, especially around declining ROIC trends, warranting close monitoring.
Disclaimer: Investment carries a risk of loss of initial capital. The past performance is not a reliable indicator of future results. Be sure to understand risks before making an investment decision.
Go Further
I encourage you to read the complete analyses of Entergy Corporation and CMS Energy Corporation to enhance your investment decisions: