Home > Comparison > Utilities > EIX vs CMS
The strategic rivalry between Edison International and CMS Energy Corporation shapes the utilities sector’s evolution. Edison International operates as a capital-intensive, California-focused regulated electric utility, while CMS Energy blends electric and gas utilities with diversified energy sources in Michigan. This head-to-head contrasts regional scale and operational diversity. I will analyze which company’s strategic path offers a superior risk-adjusted return for investors seeking reliable exposure to regulated utilities.
Table of contents
Companies Overview
Edison International and CMS Energy Corporation drive critical electric utility markets in California and Michigan, respectively.
Edison International: California’s Regulated Electric Power Leader
Edison International stands as a regulated electric utility serving 15M customers across California. Its core revenue comes from generating and distributing electricity via an extensive network of overhead and underground lines. In 2026, it emphasizes expanding energy solutions for commercial and industrial users to strengthen its competitive edge in a maturing market.
CMS Energy Corporation: Michigan’s Diversified Energy Provider
CMS Energy Corporation operates a diverse energy portfolio including electric, gas utilities, and renewable enterprises. It generates revenue through electricity and natural gas transmission and sales to 3.7M customers, leveraging multiple energy sources. The company’s 2026 focus centers on integrating renewables and enhancing infrastructure resilience amid evolving regulatory demands.
Strategic Collision: Similarities & Divergences
Both companies operate as regulated utilities with heavy infrastructure investments. Edison leans on a closed, state-specific ecosystem, while CMS adopts a broader multi-commodity model blending gas and renewables. Their primary battleground lies in infrastructure modernization and clean energy adoption. Investors face distinct profiles: Edison’s scale and market depth contrast with CMS’s diversification and innovation focus.
Income Statement Comparison
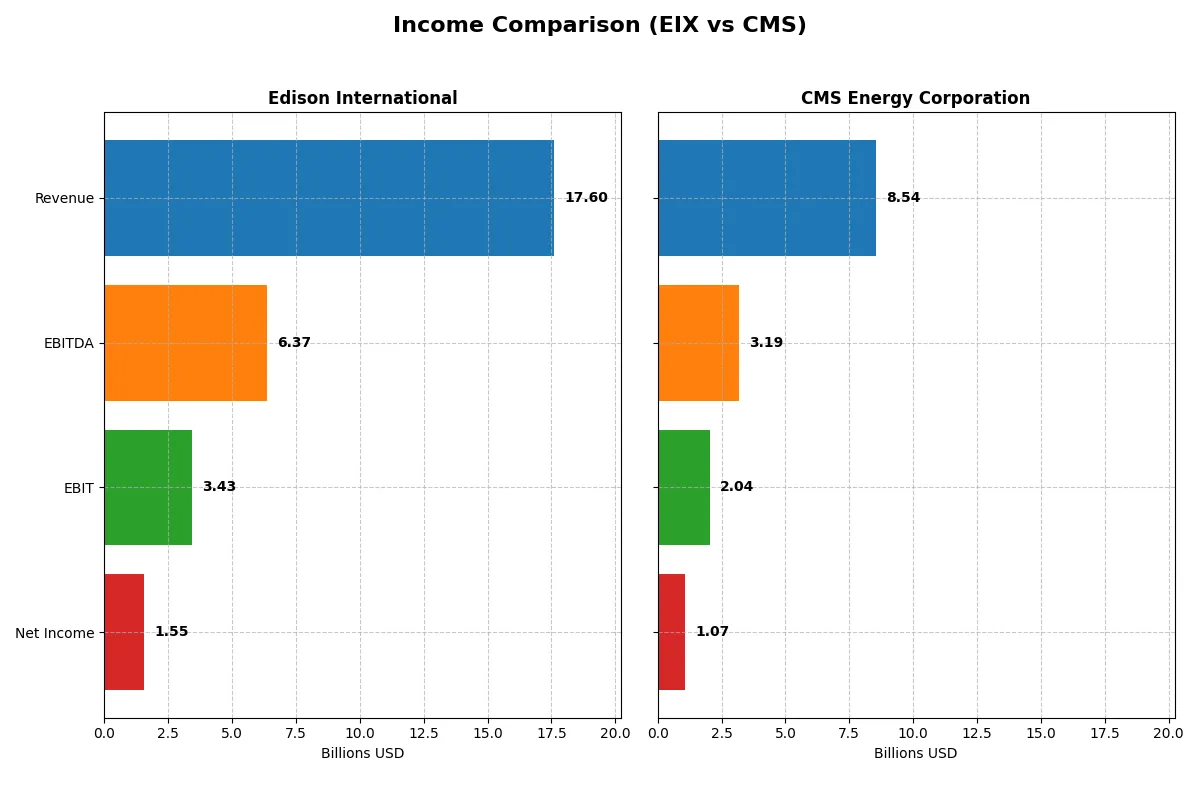
This data dissects the core profitability and scalability of both corporate engines to reveal who dominates the bottom line:
| Metric | Edison International (EIX) | CMS Energy Corporation (CMS) |
|---|---|---|
| Revenue | 17.6B | 8.5B |
| Cost of Revenue | 10.4B | 3.3B |
| Operating Expenses | 4.3B | 3.5B |
| Gross Profit | 7.2B | 5.2B |
| EBITDA | 6.4B | 3.2B |
| EBIT | 3.4B | 2.0B |
| Interest Expense | 1.9B | 789M |
| Net Income | 1.5B | 1.1B |
| EPS | 3.33 | 3.53 |
| Fiscal Year | 2024 | 2025 |
Income Statement Analysis: The Bottom-Line Duel
This income statement comparison reveals which company operates with superior efficiency and growth dynamics in their core business.
Edison International Analysis
Edison International’s revenue steadily climbed from 13.6B in 2020 to nearly 17.6B in 2024, with net income surging from 871M to 1.55B. Its gross margin held strong above 41%, and net margin improved to 8.78%. The company demonstrated solid momentum in 2024, growing EBIT by 9.75% and EPS by 6.43%, reflecting disciplined cost control despite elevated interest expenses.
CMS Energy Corporation Analysis
CMS’s revenue showed moderate growth, reaching 8.5B in 2025 from 7.3B in 2021, while net income fluctuated, ending at 1.07B in 2025, below its 2021 peak. CMS boasts a robust gross margin near 61% and a superior net margin of 12.54% in 2025. However, recent net margin contraction and a 21% net income decline over five years signal challenges in sustaining profitability momentum.
Margin Strength vs. Growth Sustainability
Edison International leads in revenue and net income growth, reflecting steady operational improvements and margin expansion. CMS maintains higher margins but struggles with net income volatility and margin compression. For investors prioritizing growth and consistent margin gains, Edison’s profile appears more compelling, while CMS’s strength lies in margin efficiency amid uneven growth.
Financial Ratios Comparison
These vital ratios act as a diagnostic tool to expose the underlying fiscal health, valuation premiums, and capital efficiency of each company:
| Ratios | Edison International (EIX) | CMS Energy Corporation (CMS) |
|---|---|---|
| ROE | 9.93% | 12.01% |
| ROIC | 3.61% | 3.71% |
| P/E | 19.93 | 19.49 |
| P/B | 1.98 | 2.34 |
| Current Ratio | 0.85 | 1.34 |
| Quick Ratio | 0.78 | 1.34 |
| D/E (Debt/Equity) | 2.43 | 2.12 |
| Debt-to-Assets | 44.12% | 47.31% |
| Interest Coverage | 1.57 | 2.19 |
| Asset Turnover | 0.21 | 0.21 |
| Fixed Asset Turnover | 0.29 | 0.28 |
| Payout ratio | 83.18% | 60.48% |
| Dividend yield | 4.17% | 3.10% |
| Fiscal Year | 2024 | 2025 |
Efficiency & Valuation Duel: The Vital Signs
Financial ratios act as a company’s DNA, uncovering operational strengths and hidden risks that influence investment decisions profoundly.
Edison International
Edison International posts a modest ROE of 9.93% and a neutral net margin at 8.78%, indicating moderate profitability. The stock trades at a neutral P/E of 19.93 and P/B of 1.98, neither cheap nor stretched. A 4.17% dividend yield rewards shareholders, reflecting a stable income focus amid reinvestment limits.
CMS Energy Corporation
CMS Energy delivers stronger profitability with a 12.01% ROE and a favorable net margin of 12.54%. Its valuation is neutral, with a P/E near 19.49 and P/B at 2.34, showing balanced pricing. The company maintains a 3.1% dividend yield and healthier liquidity, signaling prudent shareholder returns and operational efficiency.
Balanced Profitability vs. Dividend Stability
CMS exhibits superior profitability and liquidity, offering a more balanced risk-return profile. Edison International provides higher dividend income but faces operational challenges and weaker liquidity. Investors seeking growth and efficiency may prefer CMS; those prioritizing income might lean toward Edison.
Which one offers the Superior Shareholder Reward?
I compare Edison International (EIX) and CMS Energy Corporation (CMS) on distribution strategies, dividend yields, payout ratios, and buybacks. EIX yields ~4.2% with a high payout ratio near 83%, but negative free cash flow (-1.8B) signals strain on sustainability. CMS yields a lower 3.1% but maintains a moderate payout ratio (~60%) and positive free cash flow (+7.5B), supporting dividends and buybacks. CMS shows stronger operating cash flow coverage and consistently funds buybacks, enhancing total return. I believe CMS offers a more durable shareholder reward in 2026 due to healthier cash flow and balanced capital allocation.
Comparative Score Analysis: The Strategic Profile
The radar chart reveals the fundamental DNA and trade-offs of Edison International and CMS Energy Corporation, highlighting their financial strengths and weaknesses:
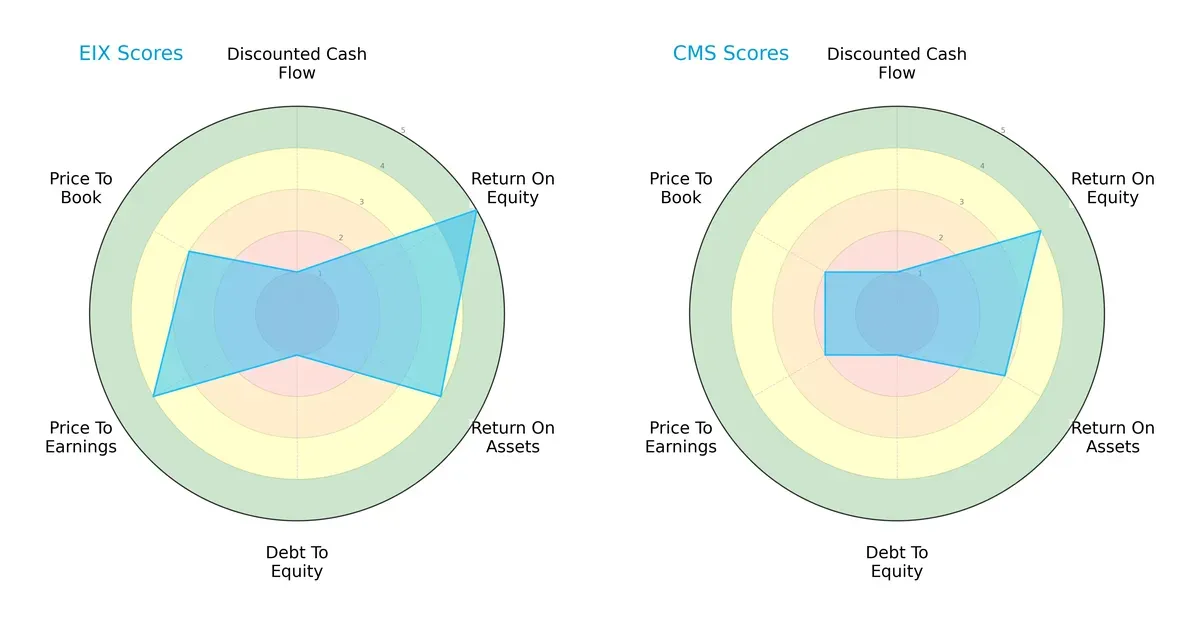
Edison International shows a more balanced profile with superior ROE (5 vs. 4) and ROA (4 vs. 3) scores, signaling efficient asset use and profitability. Both firms struggle with debt (1 score each), but Edison excels in valuation metrics (PE: 4 vs. 2; PB: 3 vs. 2). CMS relies more on specific valuation edges but lags overall with a weaker rating (C+ vs. B+).
Bankruptcy Risk: Solvency Showdown
Both Edison International and CMS Energy score in the distress zone on the Altman Z-Score scale, indicating elevated bankruptcy risk in this cycle:
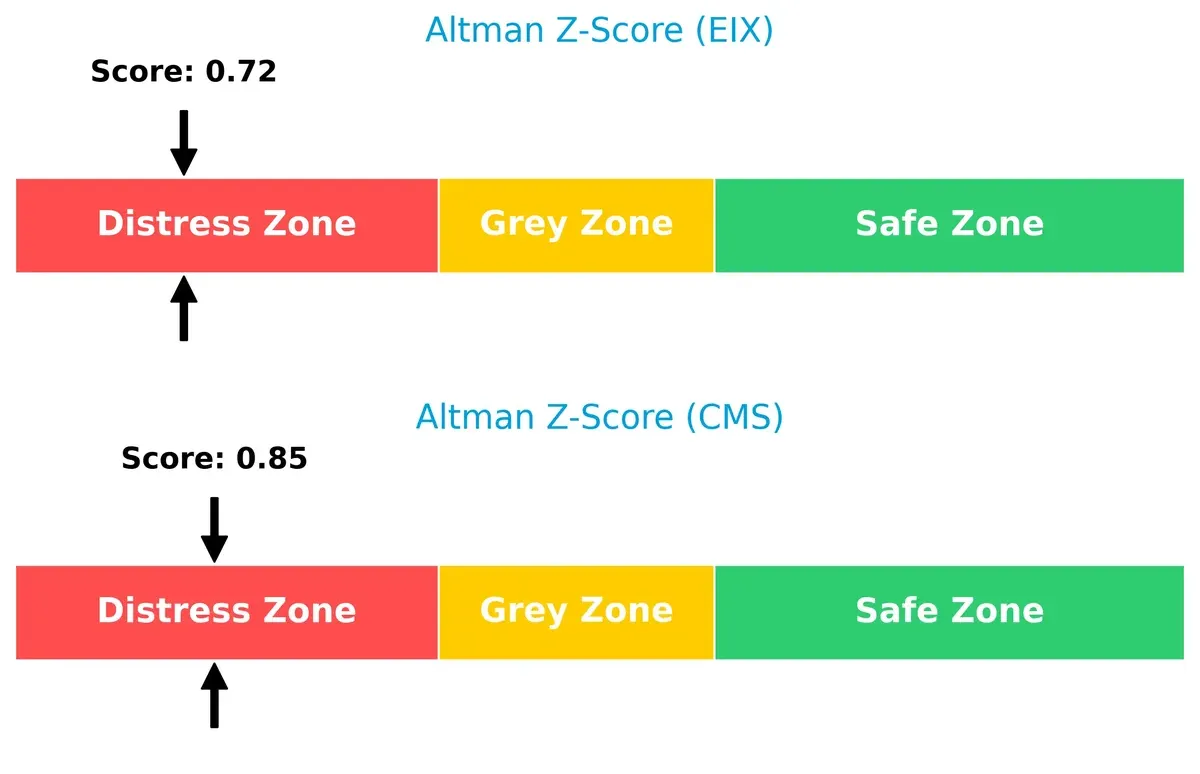
Edison’s score of 0.72 and CMS’s 0.85 reflect significant financial distress. Neither company currently demonstrates strong solvency, warranting cautious risk management for long-term investors.
Financial Health: Quality of Operations
CMS Energy edges out Edison International in financial health, with a Piotroski F-Score of 7 (strong) compared to Edison’s 6 (average):
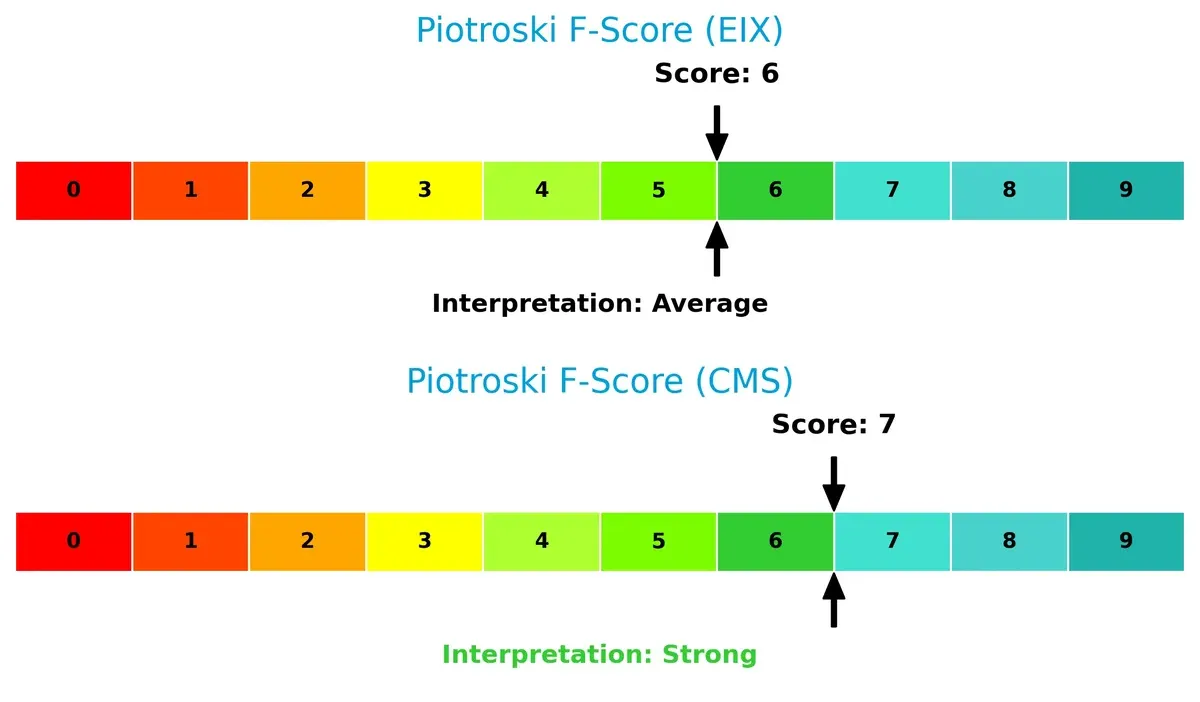
CMS shows more robust internal metrics, suggesting better operational quality and fewer red flags. Edison’s average score indicates room for improvement in profitability and efficiency measures.
How are the two companies positioned?
This section dissects Edison International and CMS Energy’s operational DNA by comparing their revenue distribution and internal dynamics. The goal is to confront their economic moats to reveal which model offers the most resilient, sustainable competitive advantage today.
Revenue Segmentation: The Strategic Mix
This visual comparison dissects how Edison International and CMS Energy diversify their income streams and where their primary sector bets lie:
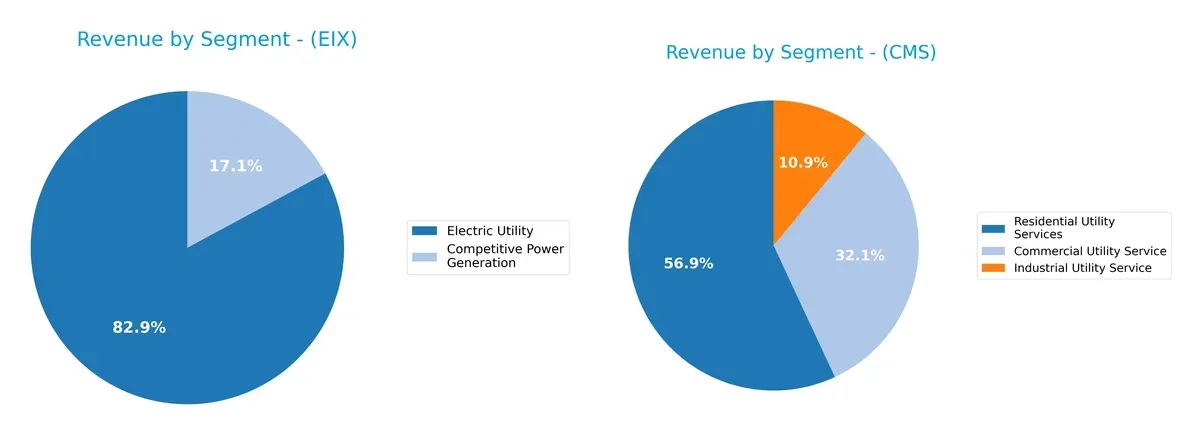
Edison International anchors its revenue in Electric Utility at $10.6B, dwarfing Competitive Power Generation’s $2.2B. CMS Energy shows a more balanced mix, with Residential Utility Services around $3.7B and Commercial Utility Service near $2.1B. Edison’s reliance on a single dominant segment signals infrastructure dominance but raises concentration risk. CMS’s diversification reduces risk and suggests a strategic focus on broad customer bases across residential and commercial sectors.
Strengths and Weaknesses Comparison
This table compares the Strengths and Weaknesses of Edison International and CMS Energy Corporation:
Edison International Strengths
- Stable electric utility revenue base
- Favorable WACC at 5.98% supports cost of capital
- Dividend yield of 4.17% is attractive
- Neutral net margin of 8.78% signals steady profitability
CMS Energy Corporation Strengths
- Higher net margin at 12.54% reflects strong profitability
- Favorable quick ratio at 1.34 indicates liquidity strength
- Dividend yield of 3.1% supports income generation
- Neutral PE at 19.49 suggests fair valuation
Edison International Weaknesses
- Unfavorable ROE at 9.93% points to weak equity returns
- Low current (0.85) and quick ratios (0.78) raise liquidity concerns
- High debt to equity of 2.43 increases leverage risk
- Low asset and fixed asset turnover reflect inefficiency
CMS Energy Corporation Weaknesses
- Unfavorable ROIC at 3.71% indicates suboptimal capital returns
- Debt to equity at 2.12 still high
- Asset turnover and fixed asset turnover also low
- Interest coverage at 2.58 is only neutral, limiting buffer
Edison International’s strengths lie in its steady utility revenue and cost of capital advantages but face liquidity and efficiency challenges. CMS Energy shows stronger profitability and liquidity but shares capital efficiency and leverage concerns. These factors influence how each company might prioritize operational improvements and capital management.
The Moat Duel: Analyzing Competitive Defensibility
A structural moat is the only reliable shield protecting long-term profits from relentless competition erosion. Let’s dissect the core moats of two utilities giants:
Edison International: Regulated Infrastructure & Growing Profitability
Edison International leverages regulated electric infrastructure as its moat, reflected in stable margins and improving ROIC despite currently shedding value. New energy solutions in California could deepen this advantage by 2026.
CMS Energy Corporation: Diversified Utility Portfolio & Cost Efficiency
CMS Energy’s moat stems from a diversified electric and gas utility portfolio, offering higher margins than Edison but facing declining ROIC trends. Its broad fuel mix supports growth, yet margin pressures threaten sustainability.
Infrastructure Stability vs. Portfolio Diversification
Edison’s slightly unfavorable but improving moat outpaces CMS’s very unfavorable and declining profitability trend. Edison is better positioned to defend market share through focused infrastructure and innovation.
Which stock offers better returns?
Stock prices for Edison International and CMS Energy Corporation reveal contrasting trends over the past year, with CMS showing robust gains while Edison International faced a significant decline before recent recovery.
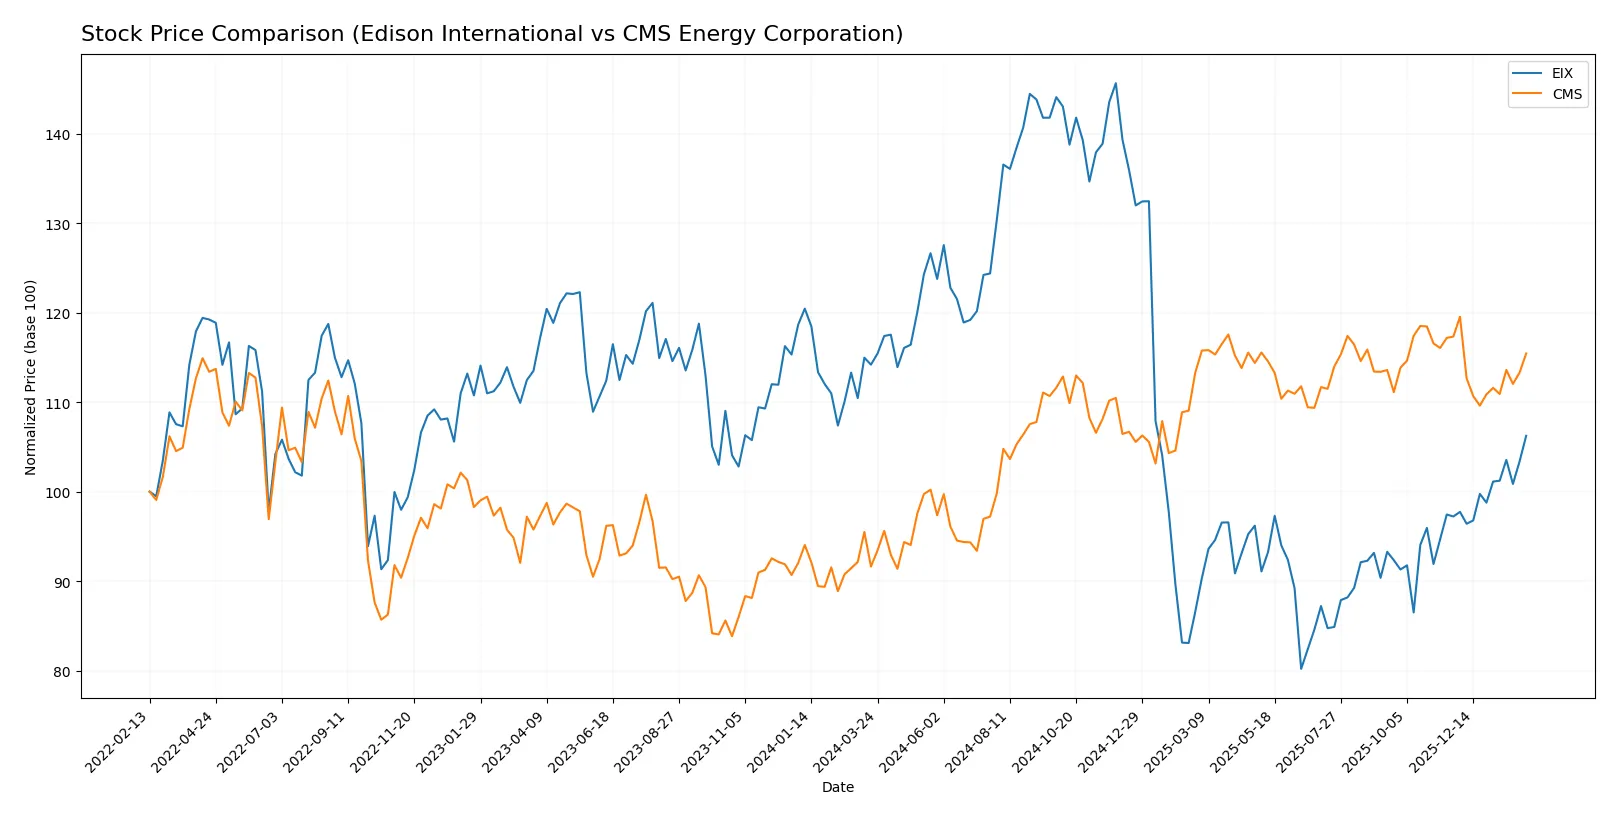
Trend Comparison
Edison International’s stock declined by 6.96% over the past 12 months, marking a bearish trend with accelerating downward momentum. It hit a low of 48.32 and a high of 87.75, showing high volatility with a 12.12 standard deviation.
CMS Energy Corporation’s stock rose 25.98% over the same 12-month period, reflecting a bullish trend despite a recent slight dip of 1.62%. The price fluctuated between 57.66 and 75.44, with moderate volatility at 4.7 standard deviation and decelerating trend momentum.
CMS Energy delivered the highest market performance, outperforming Edison International significantly with sustained gains versus a mostly negative yearly return.
Target Prices
Analysts present a clear consensus on Edison International and CMS Energy Corporation targets.
| Company | Target Low | Target High | Consensus |
|---|---|---|---|
| Edison International | 57 | 70 | 62.6 |
| CMS Energy Corporation | 74 | 82 | 78.14 |
The consensus target for Edison International slightly undercuts its current price of 64.01, signaling modest upside risk. CMS Energy’s target range sits well above its current 72.84 price, suggesting stronger analyst confidence in future gains.

Don’t Let Luck Decide Your Entry Point
Optimize your entry points with our advanced ProRealTime indicators. You’ll get efficient buy signals with precise price targets for maximum performance. Start outperforming now!
How do institutions grade them?
The following tables summarize the recent institutional grades for Edison International and CMS Energy Corporation:
Edison International Grades
Here are the latest grades given by reputable financial institutions for Edison International:
| Grading Company | Action | New Grade | Date |
|---|---|---|---|
| JP Morgan | Maintain | Neutral | 2026-01-28 |
| Jefferies | Maintain | Hold | 2026-01-28 |
| Barclays | Maintain | Overweight | 2026-01-22 |
| Wells Fargo | Downgrade | Underweight | 2026-01-20 |
| Morgan Stanley | Maintain | Underweight | 2025-12-17 |
| JP Morgan | Maintain | Neutral | 2025-12-12 |
| UBS | Maintain | Buy | 2025-12-02 |
| Ladenburg Thalmann | Maintain | Neutral | 2025-10-30 |
| Barclays | Maintain | Overweight | 2025-10-29 |
| Morgan Stanley | Maintain | Underweight | 2025-10-22 |
CMS Energy Corporation Grades
Below are the most recent grades from established grading firms for CMS Energy Corporation:
| Grading Company | Action | New Grade | Date |
|---|---|---|---|
| Mizuho | Maintain | Neutral | 2026-02-06 |
| Morgan Stanley | Maintain | Equal Weight | 2026-02-02 |
| Jefferies | Maintain | Buy | 2026-01-28 |
| Wells Fargo | Maintain | Equal Weight | 2026-01-20 |
| JP Morgan | Maintain | Overweight | 2026-01-15 |
| Jefferies | Maintain | Buy | 2026-01-15 |
| Barclays | Maintain | Overweight | 2026-01-15 |
| UBS | Maintain | Neutral | 2025-12-17 |
| JP Morgan | Maintain | Overweight | 2025-12-11 |
| Morgan Stanley | Maintain | Equal Weight | 2025-10-22 |
Which company has the best grades?
CMS Energy Corporation consistently receives higher grades, including multiple Buy and Overweight ratings. Edison International’s ratings lean more neutral and underweight, indicating comparatively less institutional confidence. Investors may interpret CMS’s stronger grades as a signal of better market sentiment.
Risks specific to each company
The following categories identify critical pressure points and systemic threats facing Edison International and CMS Energy Corporation in the 2026 market environment:
1. Market & Competition
Edison International
- Operates in highly regulated California market; faces competition from renewables and distributed generation.
CMS Energy Corporation
- Primarily in Michigan with diversified energy sources; faces regional competition and regulatory shifts.
2. Capital Structure & Debt
Edison International
- High debt-to-equity ratio of 2.43 signals financial leverage risk; interest coverage weak at 1.84x.
CMS Energy Corporation
- Slightly lower debt-to-equity at 2.12 but still elevated; interest coverage moderate at 2.58x.
3. Stock Volatility
Edison International
- Beta of 0.83 indicates moderate sensitivity to market swings; stable trading range near $64.
CMS Energy Corporation
- Lower beta at 0.48 reflects defensive profile; tighter trading range around $72.
4. Regulatory & Legal
Edison International
- Exposure to California’s stringent environmental and energy policies; potential litigation risks.
CMS Energy Corporation
- Regulatory risks in Michigan include shifting energy mandates and gas utility oversight.
5. Supply Chain & Operations
Edison International
- Complex transmission and distribution with aging infrastructure; potential operational disruptions.
CMS Energy Corporation
- Extensive electric and gas infrastructure; diversified generation mix reduces single-source risk.
6. ESG & Climate Transition
Edison International
- Transition to renewables pressured by regulatory targets; climate risks in wildfire-prone areas.
CMS Energy Corporation
- Active renewable development; climate transition embedded in strategy but reliant on fossil fuels too.
7. Geopolitical Exposure
Edison International
- Primarily domestic operations limit geopolitical risk but subject to U.S. policy changes.
CMS Energy Corporation
- Operations confined to Michigan; minimal direct geopolitical exposure but vulnerable to national energy policy shifts.
Which company shows a better risk-adjusted profile?
CMS Energy’s diversified energy mix, stronger liquidity ratios, and lower stock volatility create a more balanced risk profile. Edison International’s elevated leverage and operational risks in a challenging regulatory environment raise caution. CMS’s stronger Piotroski score (7 vs. 6) and neutral global financial ratio evaluation contrast Edison’s distress-zone Altman Z-score and unfavorable ratio profile. The most impactful risk for Edison is its strained capital structure and weak interest coverage. For CMS, regulatory and operational complexity pose significant challenges. CMS’s stable beta and better liquidity metrics justify my preference for its risk-adjusted profile in 2026.
Final Verdict: Which stock to choose?
Edison International’s superpower lies in its steadily improving profitability and strong dividend yield, signaling growing shareholder value. However, its high leverage and weak liquidity ratios remain points of vigilance. It fits an aggressive growth portfolio willing to endure balance sheet risks for rising earnings momentum.
CMS Energy commands a strategic moat through superior gross margins and a healthier liquidity profile. Its consistent free cash flow yield offers relative safety compared to Edison. CMS suits investors focused on growth at a reasonable price, balancing solid operational margins with moderate financial risk.
If you prioritize accelerating earnings growth and dividend income, Edison International is the compelling choice due to its improving profitability and shareholder returns despite financial constraints. However, if you seek better stability and operational cash flow strength, CMS Energy offers a more balanced risk profile and efficient capital use. Both present contrasting analytical scenarios depending on risk appetite and portfolio goals.
Disclaimer: Investment carries a risk of loss of initial capital. The past performance is not a reliable indicator of future results. Be sure to understand risks before making an investment decision.
Go Further
I encourage you to read the complete analyses of Edison International and CMS Energy Corporation to enhance your investment decisions: