Home > Comparison > Utilities > DUK vs CMS
The strategic rivalry between Duke Energy Corporation and CMS Energy Corporation shapes the dynamics of the U.S. regulated electric sector. Duke operates as a diversified energy giant with broad geographic reach and a strong renewables push. CMS Energy focuses on integrated electric and gas utilities concentrated in Michigan, balancing scale with regional expertise. This analysis will reveal which company’s business model delivers superior risk-adjusted returns for a diversified portfolio in today’s evolving energy landscape.

Table of contents
Companies Overview
Duke Energy and CMS Energy stand as key players shaping the U.S. regulated electric utility landscape.
Duke Energy Corporation: A Powerhouse in Diverse Energy Generation
Duke Energy dominates with a market cap near 100B and serves 8.2M customers across six states. Its core revenue stems from extensive electric and gas utilities plus commercial renewables. In 2026, Duke emphasizes expanding its renewable portfolio, operating 178 solar, 23 wind, and multiple battery storage facilities, reinforcing its competitive edge in clean energy transition.
CMS Energy Corporation: Michigan’s Integrated Utility Leader
CMS Energy commands a market cap of 23.5B and services about 3.7M combined electric and gas customers mainly in Michigan. Its revenue base blends electric and gas utility operations with independent power production. The company focuses on modernizing infrastructure and enhancing renewable energy capacity, aiming to balance reliability and sustainability within its regional footprint.
Strategic Collision: Utilities with Contrasting Scale and Scope
Duke Energy pursues a broad, multi-state diversified energy model while CMS Energy concentrates on deep regional penetration in Michigan. Both invest heavily in renewables but Duke’s scale and asset diversity create a wider moat. Their battleground is the transition to cleaner energy amid regulatory pressures. Investors face distinct profiles: Duke offers scale-driven resilience; CMS presents focused regional growth with infrastructure modernization risks.
Income Statement Comparison
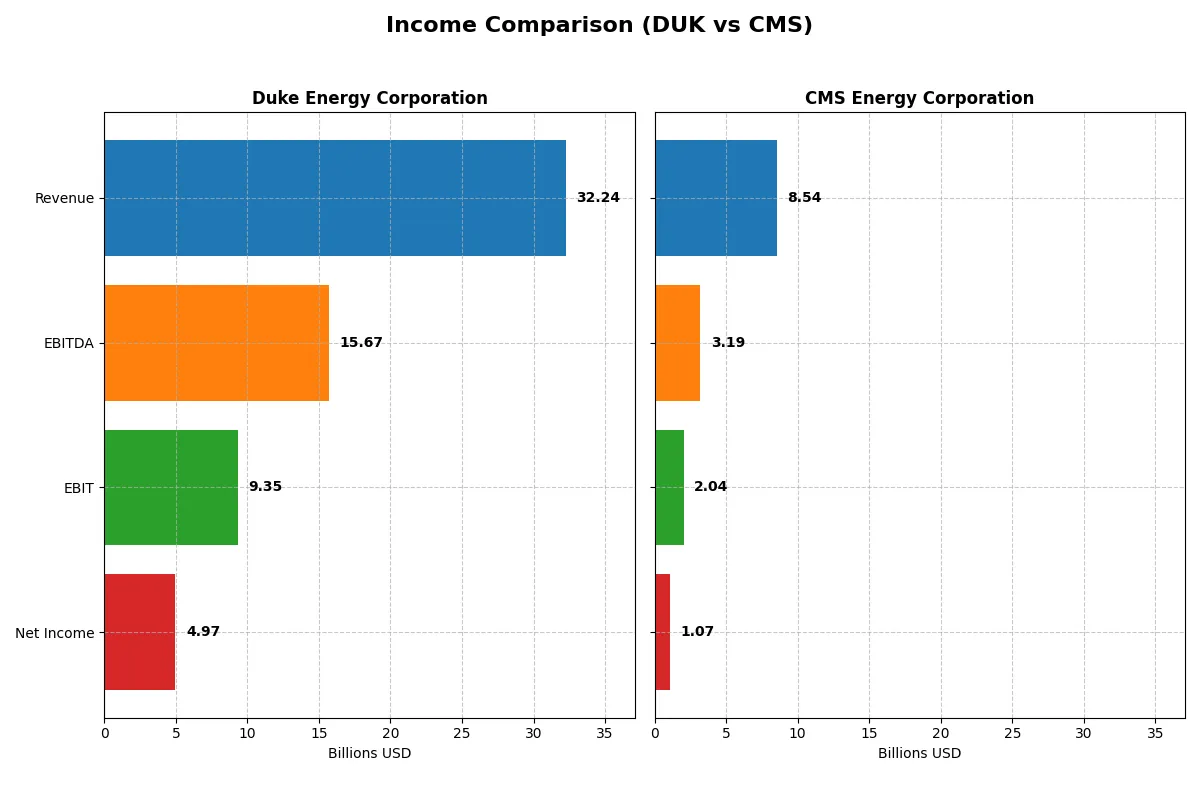
This data dissects the core profitability and scalability of both corporate engines to reveal who dominates the bottom line:
| Metric | Duke Energy Corporation (DUK) | CMS Energy Corporation (CMS) |
|---|---|---|
| Revenue | 32.2B | 8.5B |
| Cost of Revenue | 22.1B | 3.3B |
| Operating Expenses | 1.6B | 3.5B |
| Gross Profit | 10.2B | 5.2B |
| EBITDA | 15.7B | 3.2B |
| EBIT | 9.3B | 2.0B |
| Interest Expense | 3.6B | 0.8B |
| Net Income | 5.0B | 1.1B |
| EPS | 6.31 | 3.53 |
| Fiscal Year | 2025 | 2025 |
Income Statement Analysis: The Bottom-Line Duel
The following income statement comparison uncovers which company operates with greater profitability and operational efficiency in recent years.
Duke Energy Corporation Analysis
Duke Energy’s revenue climbed steadily from $24.6B in 2021 to $32.2B in 2025, marking a solid 31% growth over five years. Net income followed suit, rising from $3.9B to $4.97B, showing robust bottom-line expansion. Despite a one-year dip in gross profit, Duke maintains healthy gross and net margins around 31.6% and 15.4%, signaling efficient cost control and stable profitability in 2025.
CMS Energy Corporation Analysis
CMS Energy’s revenue increased from $7.3B in 2021 to $8.54B in 2025, reflecting a moderate 16.5% growth. Net income, however, declined from $1.35B to $1.07B, indicating weakening profitability despite revenue gains. CMS boasts a strong gross margin of 60.9% but operates with a thinner net margin of 12.5%. The company showed impressive one-year gross profit growth but struggled with margin compression overall.
Margin Strength vs. Revenue Growth
Duke Energy leads with superior revenue scale and consistent net income growth, highlighting operational resilience. CMS excels in gross margin but faces challenges translating top-line gains into net profits, as net income and margins shrink. Investors seeking steady earnings growth and margin stability will find Duke’s profile more attractive given its proven efficiency and expanding bottom line.
Financial Ratios Comparison
These vital ratios act as a diagnostic tool to expose the underlying fiscal health, valuation premiums, and capital efficiency of Duke Energy Corporation (DUK) and CMS Energy Corporation (CMS):
| Ratios | Duke Energy (DUK) | CMS Energy (CMS) |
|---|---|---|
| ROE | 9.6% | 11.7% |
| ROIC | 4.1% | 3.7% |
| P/E | 18.3 | 19.6 |
| P/B | 1.76 | 2.30 |
| Current Ratio | 0.55 | 0.98 |
| Quick Ratio | 0.33 | 0.76 |
| D/E | 1.75 | 2.07 |
| Debt-to-Assets | 46.4% | 46.9% |
| Interest Coverage | 2.36 | 2.19 |
| Asset Turnover | 0.16 | 0.21 |
| Fixed Asset Turnover | 0.25 | 0.28 |
| Payout Ratio | 66.0% | 60.9% |
| Dividend Yield | 3.6% | 3.1% |
| Fiscal Year | 2025 | 2025 |
Efficiency & Valuation Duel: The Vital Signs
Financial ratios act as the company’s DNA, exposing hidden risks and revealing operational excellence through profitability, valuation, and liquidity metrics.
Duke Energy Corporation
Duke Energy posts a moderate ROE of 9.58%, signaling below-average profitability relative to peers. Its net margin of 15.41% is favorable, yet ROIC at 4.13% lags behind the WACC of 4.77%, indicating limited value creation. The P/E of 18.33 and P/B of 1.76 depict a fairly valued stock. A 3.6% dividend yield underlines steady shareholder returns amid weak liquidity ratios.
CMS Energy Corporation
CMS Energy shows a stronger ROE at 11.71%, with a solid net margin of 12.54%. However, its ROIC at 3.67% remains below WACC of 4.96%, suggesting constrained capital efficiency. Valuation multiples are slightly higher than Duke’s, with a P/E of 19.63 and P/B of 2.3, marking a stretched but neutral stance. Dividend yield stands at 3.1%, complementing a nearly 1.0 current ratio, reflecting better short-term liquidity.
Balanced Profitability vs. Valuation Discipline
Both companies exhibit slightly unfavorable ratio profiles, yet CMS offers superior ROE and liquidity, while Duke maintains a marginally better dividend yield and valuation discipline. Investors seeking stable income with moderate risk may prefer Duke’s profile, whereas those favoring operational efficiency and liquidity might lean toward CMS.
Which one offers the Superior Shareholder Reward?
I compare Duke Energy (DUK) and CMS Energy (CMS) by examining dividends, payout ratios, and buybacks. Duke yields 3.6–4.3% with a high payout ratio near 70–75%, supported by modest free cash flow coverage. CMS yields slightly lower at 3.1–3.4%, with a safer 60–65% payout ratio and full free cash flow coverage. Duke’s capex-heavy model squeezes free cash flow, limiting buybacks. CMS maintains consistent buybacks funded by stronger free cash flows. CMS’s balanced dividend and aggressive buybacks create a more sustainable, attractive total return in 2026. I favor CMS for superior shareholder reward given its healthier cash flow and prudent capital allocation.
Comparative Score Analysis: The Strategic Profile
The radar chart reveals the fundamental DNA and trade-offs of Duke Energy Corporation and CMS Energy Corporation, highlighting their core financial strengths and vulnerabilities:
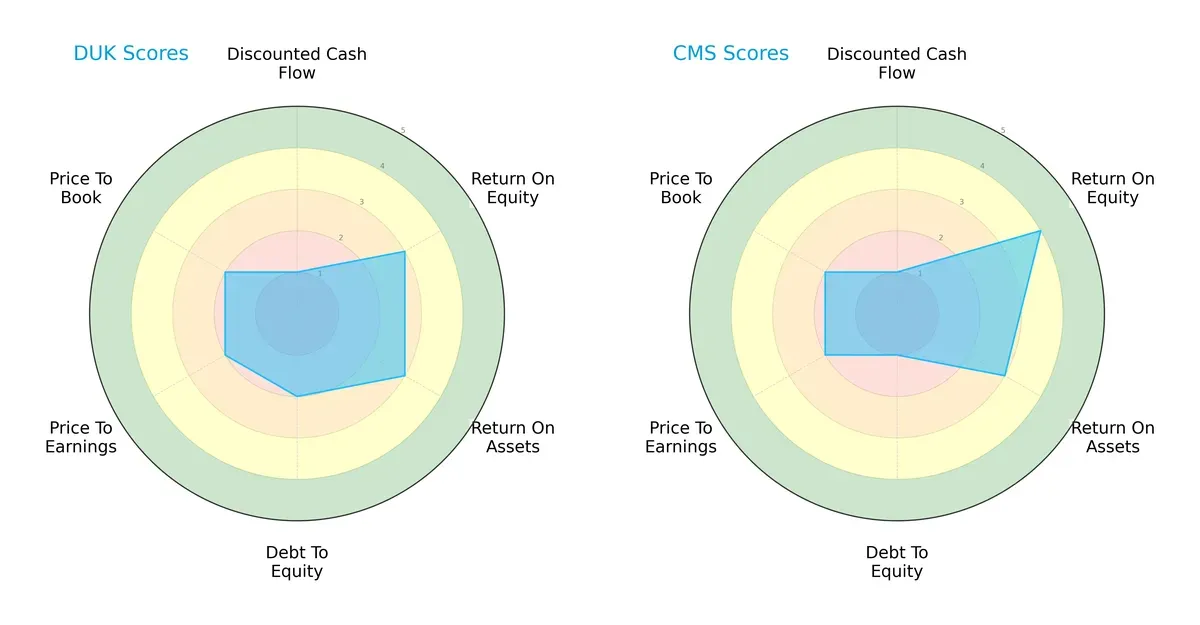
Duke Energy shows moderate efficiency in return metrics (ROE and ROA) but carries higher leverage risk with a debt-to-equity score of 2. CMS excels in ROE (score 4) but suffers from a weaker balance sheet (debt-to-equity score 1). Both struggle on valuation metrics (PE/PB scores at 2). CMS relies more on profitability, while Duke has a more balanced but cautious profile overall.
Bankruptcy Risk: Solvency Showdown
Both Duke Energy and CMS Energy fall within the distress zone on the Altman Z-Score scale, signaling elevated bankruptcy risk in this economic cycle:
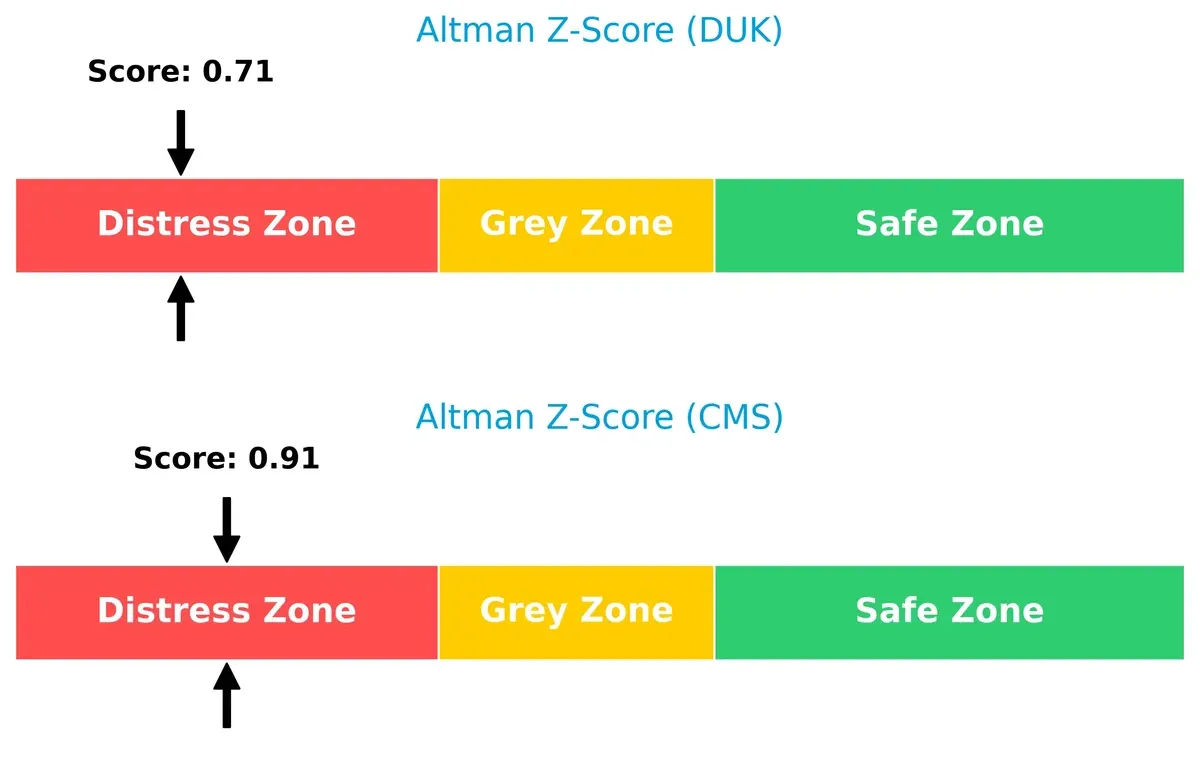
Duke’s Z-Score at 0.71 trails CMS’s 0.91, indicating a marginally higher risk of financial distress. Neither company currently demonstrates strong long-term solvency, demanding vigilance from investors.
Financial Health: Quality of Operations
CMS Energy leads with a stronger Piotroski F-Score of 7, reflecting solid operational health, while Duke scores 6, indicating average financial quality but some internal warning signs:
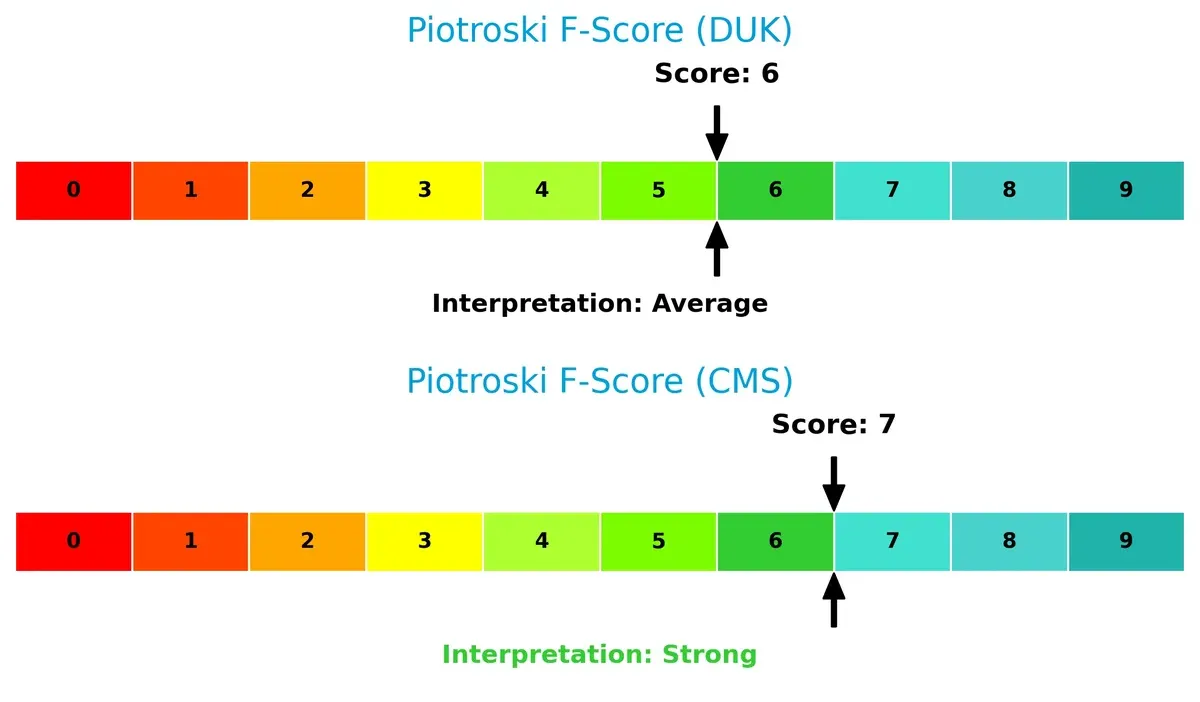
CMS’s higher score suggests better profitability and efficiency metrics. Duke’s score, though respectable, hints at areas needing improvement to reach peak financial condition.
How are the two companies positioned?
This section dissects Duke Energy and CMS Energy’s operational DNA by comparing their revenue distribution and internal dynamics. The goal is to confront their economic moats to reveal which model offers the most resilient and sustainable competitive advantage today.
Revenue Segmentation: The Strategic Mix
This comparison dissects how Duke Energy Corporation and CMS Energy Corporation diversify their income streams and where their primary sector bets lie:
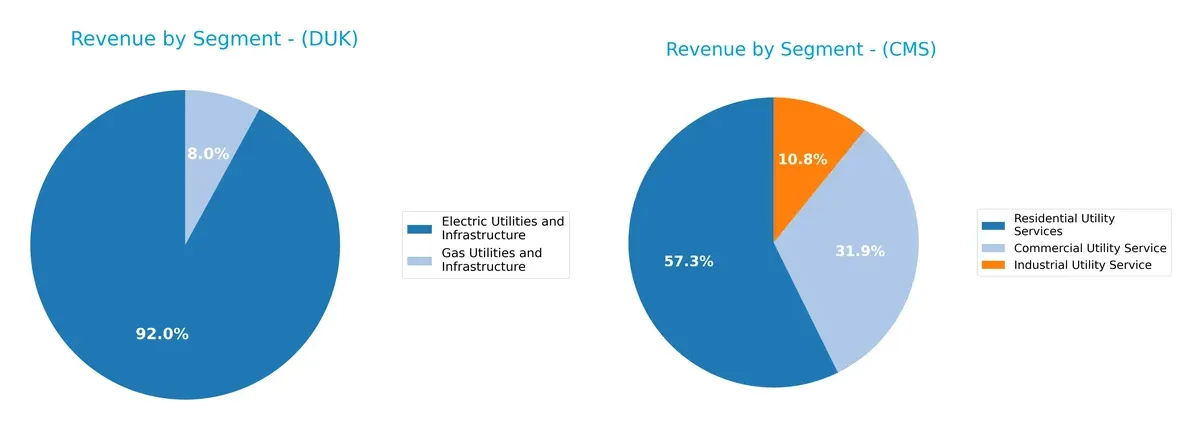
Duke Energy anchors its revenue heavily in Electric Utilities and Infrastructure, generating $26.8B in 2024, dwarfing its Gas Utilities at $2.3B. This concentration signals infrastructure dominance but also concentration risk. CMS Energy presents a more balanced mix across Residential ($4.4B), Commercial ($2.1B), and Industrial Utility Services ($720M), reflecting diversified customer exposure and lower segment dependency. Duke’s focus builds ecosystem lock-in, while CMS spreads risk across end markets.
Strengths and Weaknesses Comparison
This table compares the strengths and weaknesses of Duke Energy Corporation and CMS Energy Corporation:
Duke Energy Corporation Strengths
- Strong net margin at 15.41%
- Favorable WACC at 4.77%
- Higher dividend yield of 3.6%
- Large electric utilities revenue of 26.8B USD
- Established U.S. market presence with 29.1B USD revenue
CMS Energy Corporation Strengths
- Favorable net margin at 12.54%
- Neutral ROE at 11.71%
- Favorable WACC at 4.96%
- Consistent revenue streams from residential and commercial utility services
- Neutral valuation multiples (PE 19.63, PB 2.3)
Duke Energy Corporation Weaknesses
- Unfavorable ROE (9.58%) and ROIC (4.13%) below WACC
- Low current (0.55) and quick ratios (0.33) indicate liquidity concerns
- High debt-to-equity ratio at 1.75
- Low asset turnover (0.16) and fixed asset turnover (0.25) reflect operational inefficiency
CMS Energy Corporation Weaknesses
- Unfavorable ROIC (3.67%) below WACC
- Low current (0.98) and quick ratios (0.76) suggest liquidity stress
- Higher debt-to-equity ratio at 2.07
- Unfavorable asset turnover (0.21) and fixed asset turnover (0.28) showing operational constraints
Duke Energy demonstrates a stronger profitability profile and a dominant U.S. footprint but faces liquidity and operational efficiency challenges. CMS holds steadier profitability ratios and stable revenue segmentation but contends with higher leverage and similar operational inefficiencies. Both companies must balance growth with prudent financial management.
The Moat Duel: Analyzing Competitive Defensibility
A structural moat protects long-term profits from competition erosion. Without it, profits quickly vanish. Let’s dissect the moats of two regulated utilities:
Duke Energy Corporation: Infrastructure Scale & Market Reach
Duke’s primary moat stems from its vast infrastructure and entrenched service territories covering 6 states. This manifests in stable margins (28.99% EBIT) and a growing ROIC trend, despite currently shedding value versus WACC. New renewables projects could deepen its moat in 2026.
CMS Energy Corporation: Regional Concentration & Operational Efficiency
CMS relies on regional dominance in Michigan and efficient asset utilization. Compared to Duke, its higher gross margin (60.91%) signals operational strength but a declining ROIC trend weakens its moat. Expansion beyond Michigan or innovation in energy storage may reverse this.
Verdict: Scale & Growth vs. Efficiency & Concentration
Duke boasts a wider moat through scale and expanding renewables. CMS’s efficiency is notable but hampered by shrinking profitability and narrowing capital returns. Duke stands better poised to defend market share in a competitive landscape.
Which stock offers better returns?
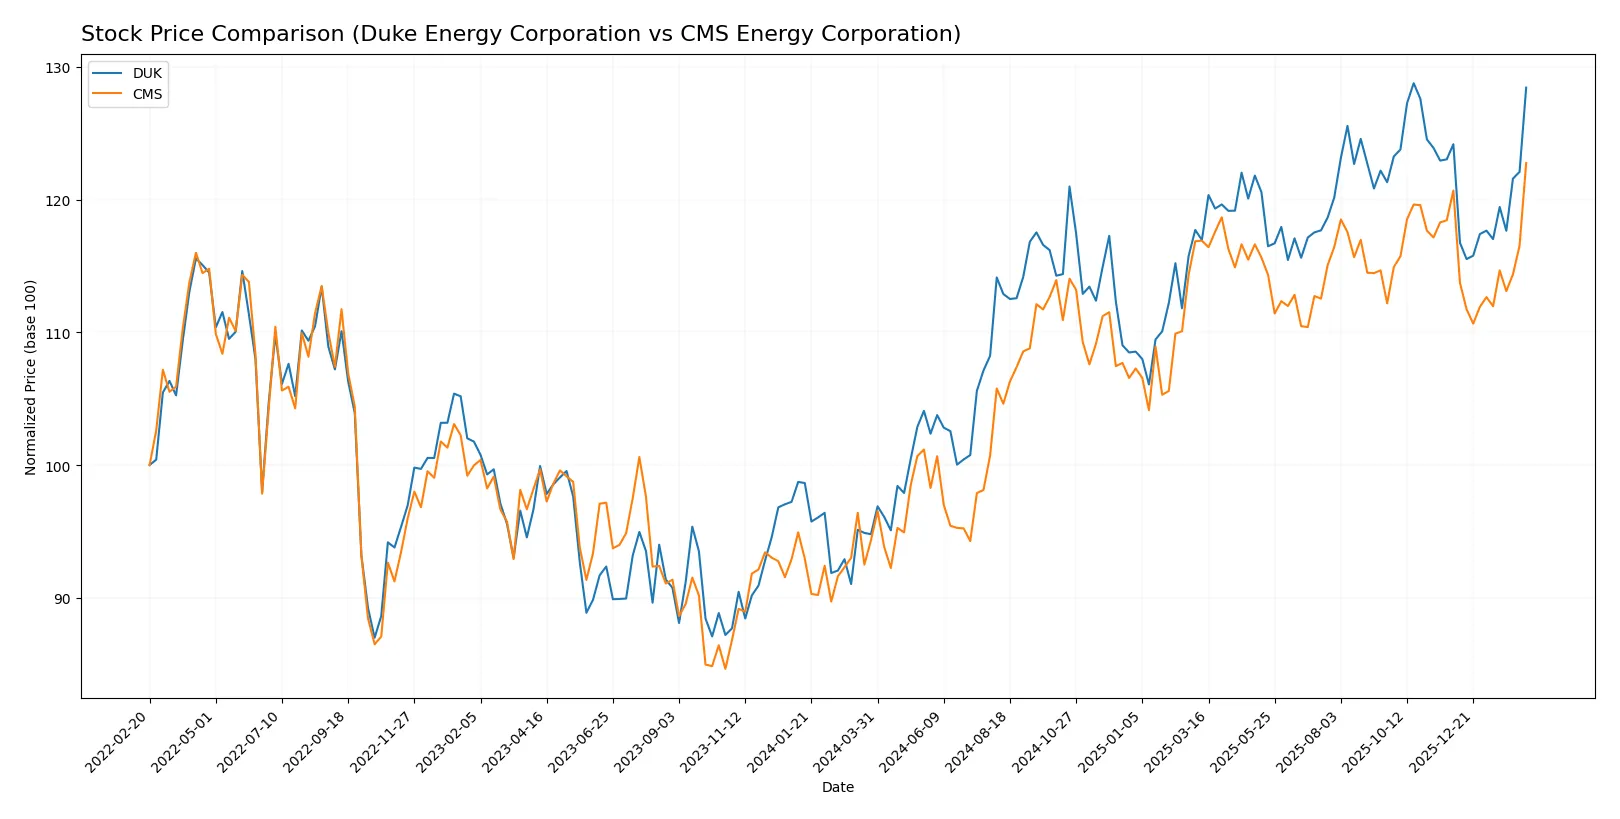
The past year saw Duke Energy and CMS Energy both gain ground, with Duke showing stronger price acceleration and higher volatility, reflecting more dynamic trading activity.
Trend Comparison
Duke Energy’s stock rose 35.5% over the last 12 months, marking a bullish trend with accelerating momentum and notable volatility (8.1% std deviation). Its price ranged between 94.61 and 128.53.
CMS Energy’s stock advanced 30.13% in the same period, also bullish with acceleration, but exhibited lower volatility at 4.65%. The price fluctuated from 57.66 to 76.74.
Duke Energy outperformed CMS Energy by a 5.37 percentage point margin, delivering the highest market return with stronger recent gains and buyer dominance.
Target Prices
Analysts present a moderately optimistic consensus on Duke Energy Corporation and CMS Energy Corporation.
| Company | Target Low | Target High | Consensus |
|---|---|---|---|
| Duke Energy Corporation | 115 | 143 | 132.64 |
| CMS Energy Corporation | 74 | 82 | 78.38 |
The target consensus for Duke Energy slightly exceeds its current price of 128.2, suggesting modest upside potential. CMS Energy’s consensus also sits above its current 76.74, reflecting cautious analyst confidence.

Don’t Let Luck Decide Your Entry Point
Optimize your entry points with our advanced ProRealTime indicators. You’ll get efficient buy signals with precise price targets for maximum performance. Start outperforming now!
How do institutions grade them?
The following tables summarize recent institutional grades for Duke Energy Corporation and CMS Energy Corporation:
Duke Energy Corporation Grades
This table shows recent grades and actions from major financial institutions for Duke Energy Corporation.
| Grading Company | Action | New Grade | Date |
|---|---|---|---|
| Wells Fargo | Maintain | Equal Weight | 2026-01-20 |
| Barclays | Maintain | Overweight | 2026-01-15 |
| UBS | Maintain | Neutral | 2025-12-17 |
| JP Morgan | Maintain | Neutral | 2025-12-11 |
| Mizuho | Maintain | Outperform | 2025-10-27 |
| Morgan Stanley | Maintain | Equal Weight | 2025-10-22 |
| Barclays | Maintain | Overweight | 2025-10-14 |
| BMO Capital | Maintain | Outperform | 2025-10-10 |
| UBS | Maintain | Neutral | 2025-10-10 |
| Scotiabank | Upgrade | Sector Outperform | 2025-10-03 |
CMS Energy Corporation Grades
This table presents recent grades and actions from leading financial institutions for CMS Energy Corporation.
| Grading Company | Action | New Grade | Date |
|---|---|---|---|
| BMO Capital | Maintain | Outperform | 2026-02-09 |
| Mizuho | Maintain | Neutral | 2026-02-06 |
| Morgan Stanley | Maintain | Equal Weight | 2026-02-02 |
| Jefferies | Maintain | Buy | 2026-01-28 |
| Wells Fargo | Maintain | Equal Weight | 2026-01-20 |
| JP Morgan | Maintain | Overweight | 2026-01-15 |
| Jefferies | Maintain | Buy | 2026-01-15 |
| Barclays | Maintain | Overweight | 2026-01-15 |
| UBS | Maintain | Neutral | 2025-12-17 |
| JP Morgan | Maintain | Overweight | 2025-12-11 |
Which company has the best grades?
CMS Energy Corporation generally receives higher and more consistent grades such as “Outperform,” “Buy,” and multiple “Overweight” ratings. Duke Energy shows a mix of “Equal Weight,” “Neutral,” and fewer “Outperform” ratings. Higher grades for CMS may indicate stronger analyst confidence, potentially influencing investor interest positively.
Risks specific to each company
The following categories identify the critical pressure points and systemic threats facing both firms in the 2026 market environment:
1. Market & Competition
Duke Energy Corporation
- Large scale and diverse generation assets provide competitive strength but face pressure from renewable shifts.
CMS Energy Corporation
- More regionally focused in Michigan, limiting scale but benefiting from local market familiarity.
2. Capital Structure & Debt
Duke Energy Corporation
- Debt-to-equity ratio high at 1.75, signaling elevated leverage risk.
CMS Energy Corporation
- Even higher leverage at 2.07, increasing financial vulnerability.
3. Stock Volatility
Duke Energy Corporation
- Beta of 0.51 indicates low volatility relative to the market.
CMS Energy Corporation
- Slightly lower beta of 0.48, showing marginally less stock price fluctuation.
4. Regulatory & Legal
Duke Energy Corporation
- Operates in multiple states with varied regulatory regimes, increasing compliance complexity.
CMS Energy Corporation
- Primarily Michigan-based, regulatory risk concentrated but potentially easier to manage.
5. Supply Chain & Operations
Duke Energy Corporation
- Extensive infrastructure spanning multiple energy sources; operational complexity adds risk.
CMS Energy Corporation
- Smaller footprint with a focus on electric and gas utilities; simpler operational scope.
6. ESG & Climate Transition
Duke Energy Corporation
- Investing in commercial renewables but legacy coal and nuclear assets pose transition risk.
CMS Energy Corporation
- Active in renewables but still reliant on fossil fuels; moderate ESG challenges.
7. Geopolitical Exposure
Duke Energy Corporation
- Primarily US-focused with minimal international geopolitical risk.
CMS Energy Corporation
- Also US-centric, limiting exposure to global geopolitical tensions.
Which company shows a better risk-adjusted profile?
Duke Energy faces its largest risk from high leverage combined with operational complexity across multiple jurisdictions. CMS’s greatest risk stems from even higher debt levels and regional concentration. Both are in financial distress zones by Altman Z-Score, but CMS scores stronger on financial health metrics. CMS’s lower beta and simpler operations suggest a marginally better risk-adjusted profile, despite its leverage. The recent data shows Duke’s weaker liquidity ratios and broader asset base heighten vulnerability in volatile markets.
Final Verdict: Which stock to choose?
Duke Energy Corporation’s superpower lies in its growing profitability amid challenging capital efficiency. Its rising ROIC trend signals improving operational strength. However, its stretched liquidity demands caution, marking a critical point of vigilance. Duke fits best in an Aggressive Growth portfolio seeking value turnaround potential.
CMS Energy Corporation benefits from a clear strategic moat rooted in steady returns on equity and solid operating margins. It offers a more conservative safety profile than Duke, with comparatively stable liquidity metrics. CMS suits a GARP (Growth at a Reasonable Price) portfolio focused on income and moderate growth.
If you prioritize an improving profitability trajectory and can tolerate liquidity risks, Duke Energy outshines as a value creator with growth momentum. However, if you seek better financial stability combined with a durable equity return, CMS Energy offers superior safety and consistent income potential. Both present slightly unfavorable moat scenarios, warranting careful risk assessment.
Disclaimer: Investment carries a risk of loss of initial capital. The past performance is not a reliable indicator of future results. Be sure to understand risks before making an investment decision.
Go Further
I encourage you to read the complete analyses of Duke Energy Corporation and CMS Energy Corporation to enhance your investment decisions: