Home > Comparison > Utilities > DTE vs CMS
The strategic rivalry between DTE Energy Company and CMS Energy Corporation shapes Michigan’s regulated electric utility sector. DTE operates a diversified utility model spanning electric generation, gas distribution, and industrial services. CMS, meanwhile, blends electric and gas utilities with a significant independent renewable power segment. This analysis will weigh their operational distinctions and capital allocation strategies to identify which company offers the superior risk-adjusted return for a diversified portfolio in a mature, regulated industry.

Table of contents
Companies Overview
DTE Energy Company and CMS Energy Corporation are key players in Michigan’s regulated electric market, shaping regional energy dynamics.
DTE Energy Company: Integrated Utility Powerhouse
DTE Energy Company stands as a regulated electric utility serving 2.3M customers in southeastern Michigan. It generates revenue through electricity sales from fossil-fuel, nuclear, hydroelectric, and renewable plants. In 2026, DTE prioritizes operational efficiency across its Electric and Gas segments, leveraging its extensive infrastructure of substations and pipelines to optimize energy delivery and trading.
CMS Energy Corporation: Diversified Energy Provider
CMS Energy Corporation operates as a multi-segment energy company serving 1.9M electric and 1.8M gas customers primarily in Michigan. Its revenue stems from electric and gas utility operations, supplemented by an enterprise segment focusing on renewable generation and independent power production. CMS’s 2026 strategy emphasizes expanding renewable assets and enhancing transmission and distribution networks for sustainable growth.
Strategic Collision: Similarities & Divergences
Both companies rely on regulated utility models with a strong emphasis on electric and gas services in Michigan. DTE leans into optimizing generation and energy trading, while CMS focuses more on renewable investments and diversified segments. Their battleground centers on customer base expansion and infrastructure modernization. Investors face contrasting profiles: DTE offers operational scale and energy trading sophistication; CMS presents growth through renewables and broader service diversification.
Income Statement Comparison
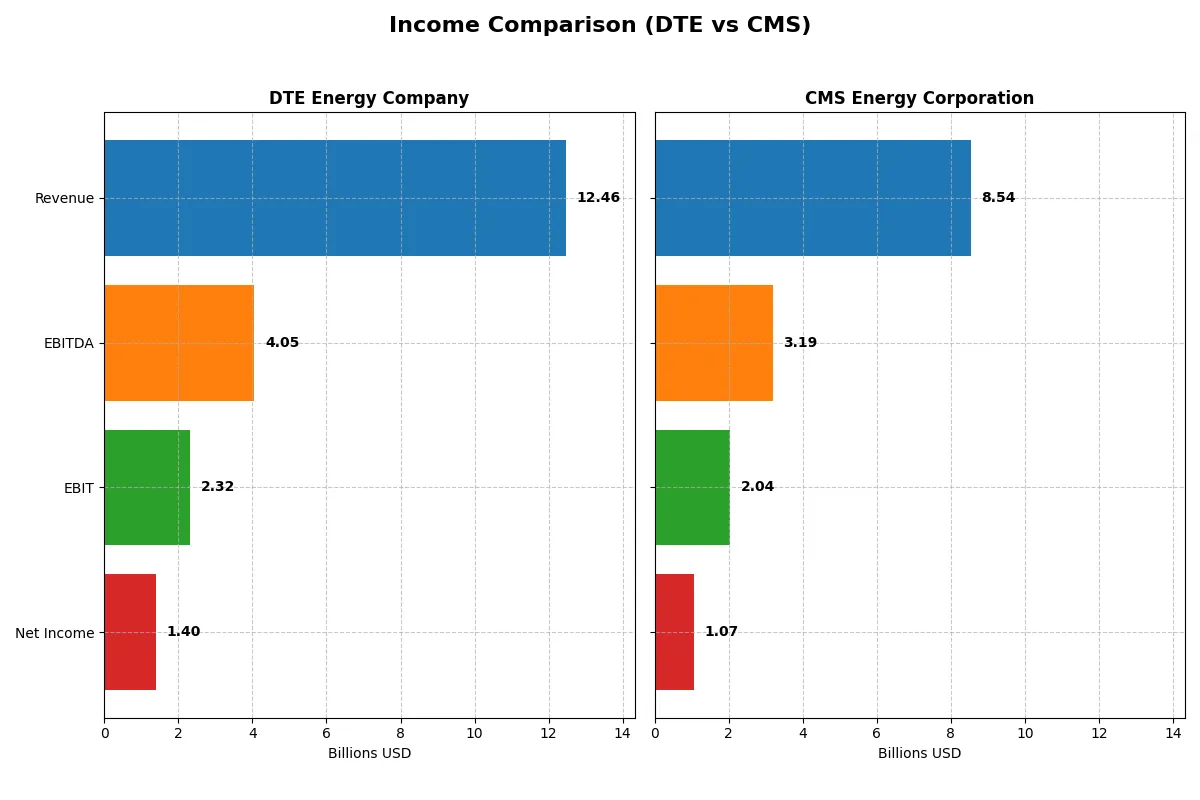
The following data dissects the core profitability and scalability of both corporate engines to reveal who dominates the bottom line:
| Metric | DTE Energy Company (DTE) | CMS Energy Corporation (CMS) |
|---|---|---|
| Revenue | 12.46B | 7.52B |
| Cost of Revenue | 8.12B | 4.31B |
| Operating Expenses | 2.25B | 1.72B |
| Gross Profit | 4.34B | 3.21B |
| EBITDA | 4.05B | 3.07B |
| EBIT | 2.32B | 1.83B |
| Interest Expense | 951M | 708M |
| Net Income | 1.40B | 1.00B |
| EPS | 6.78 | 3.34 |
| Fiscal Year | 2024 | 2024 |
Income Statement Analysis: The Bottom-Line Duel
This income statement comparison reveals the true operational efficiency and profitability trends of two major energy companies.
DTE Energy Company Analysis
DTE’s revenue shows a modest 9% rise over five years but dips slightly by 2.3% in 2024. Net income grows steadily, reaching $1.4B in 2024. Gross margin holds firm at 34.8%, while net margin remains healthy at 11.3%. Recent slight declines in revenue and EBIT suggest a mature, stable business with consistent profitability.
CMS Energy Corporation Analysis
CMS reports stronger recent momentum, with 13.6% revenue growth in 2025, reaching $8.5B. Gross margin impresses at 60.9%, and net margin improves to 12.5%. Despite a 20.8% net income decline over five years, CMS’s 2025 earnings hit $1.07B with solid EBIT growth, reflecting efficiency gains amid rising operating expenses.
Margin Strength vs. Growth Momentum
DTE delivers steady profitability with stable margins and modest growth, while CMS combines high margins with recent strong revenue and EBIT jumps. CMS edges out in operational efficiency and short-term growth, despite longer-term net income pressure. Investors favoring margin expansion and growth momentum may find CMS’s profile more compelling.
Financial Ratios Comparison
These vital ratios act as a diagnostic tool to expose the underlying fiscal health, valuation premiums, and capital efficiency of the companies compared below:
| Ratios | DTE Energy Company (DTE) | CMS Energy Corporation (CMS) |
|---|---|---|
| ROE | 12.0% | 12.0% |
| ROIC | 4.5% | 3.7% |
| P/E | 17.8 | 19.5 |
| P/B | 2.14 | 2.34 |
| Current Ratio | 0.71 | 1.34 |
| Quick Ratio | 0.46 | 1.34 |
| D/E (Debt-to-Equity) | 1.99 | 2.12 |
| Debt-to-Assets | 47.6% | 47.3% |
| Interest Coverage | 2.20 | 2.19 |
| Asset Turnover | 0.26 | 0.21 |
| Fixed Asset Turnover | 0.40 | 0.28 |
| Payout ratio | 57.8% | 60.5% |
| Dividend yield | 3.24% | 3.10% |
| Fiscal Year | 2024 | 2025 |
Efficiency & Valuation Duel: The Vital Signs
Financial ratios serve as a company’s DNA, exposing hidden risks and operational strengths vital for investment decisions.
DTE Energy Company
DTE displays a decent net margin at 11.25% and a neutral ROE near 12%, reflecting stable profitability. Its P/E of 17.8 signals a fairly priced stock, neither cheap nor stretched. The firm supports shareholders with a 3.24% dividend yield, emphasizing income over aggressive reinvestment in R&D or growth.
CMS Energy Corporation
CMS posts a slightly higher net margin of 12.54% with a neutral ROE of 12%. Its P/E ratio is 19.5, indicating a marginally pricier valuation versus DTE. CMS offers a 3.1% dividend yield and maintains healthy liquidity, suggesting balanced capital return without heavy reliance on growth investments.
Dividend Yield and Valuation Balance
CMS offers a marginally better margin and liquidity profile but trades at a premium compared to DTE. DTE’s stable dividend and fair valuation present a slightly more conservative risk-reward balance. Investors prioritizing income with moderate valuation might prefer DTE, while those favoring stronger margins and liquidity may lean toward CMS.
Which one offers the Superior Shareholder Reward?
I see DTE Energy and CMS Energy both focus on dividends and buybacks but with distinct strategies. DTE yields around 3.2%, with a payout ratio near 58%, showing solid free cash flow coverage despite negative FCF per share. It aggressively returns capital via steady dividends and buybacks, though its high leverage (debt-to-equity ~2) raises caution. CMS yields about 3.1%, with a 60% payout ratio and positive free cash flow per share, signaling a healthier cash return. CMS also maintains a robust buyback program fueled by positive FCF, supporting sustainable shareholder distributions. Given CMS’s stronger FCF and more balanced coverage metrics, I favor CMS Energy for delivering a more sustainable and attractive total shareholder return in 2026.
Comparative Score Analysis: The Strategic Profile
The radar chart reveals the fundamental DNA and trade-offs of DTE Energy Company and CMS Energy Corporation side by side:
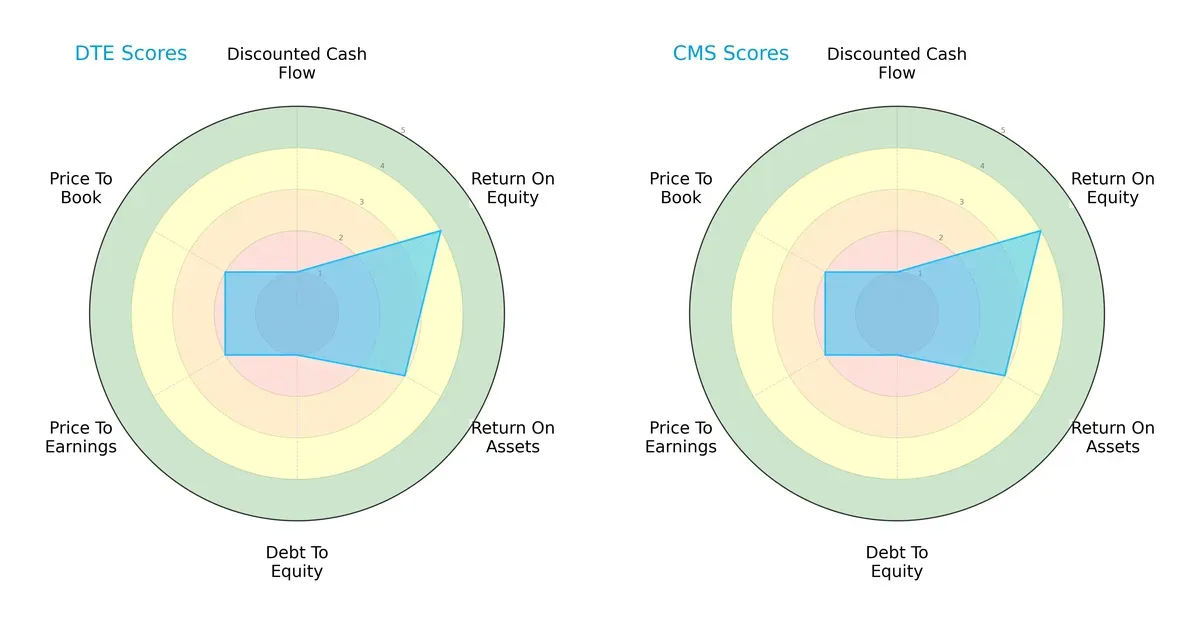
Both firms share identical score patterns, showing strength in Return on Equity (4) and moderate asset efficiency (ROA 3). However, both face significant balance sheet risk, reflected in very unfavorable Debt-to-Equity scores (1). Their valuations also appear stretched, with Price-to-Earnings and Price-to-Book scores at 2, considered unfavorable. Neither company offers a clearly more balanced profile; each depends on operational efficiency rather than financial leverage or valuation advantages.
Bankruptcy Risk: Solvency Showdown
DTE Energy posts a slightly higher Altman Z-Score (1.02) than CMS Energy (0.85), yet both remain in the distress zone:
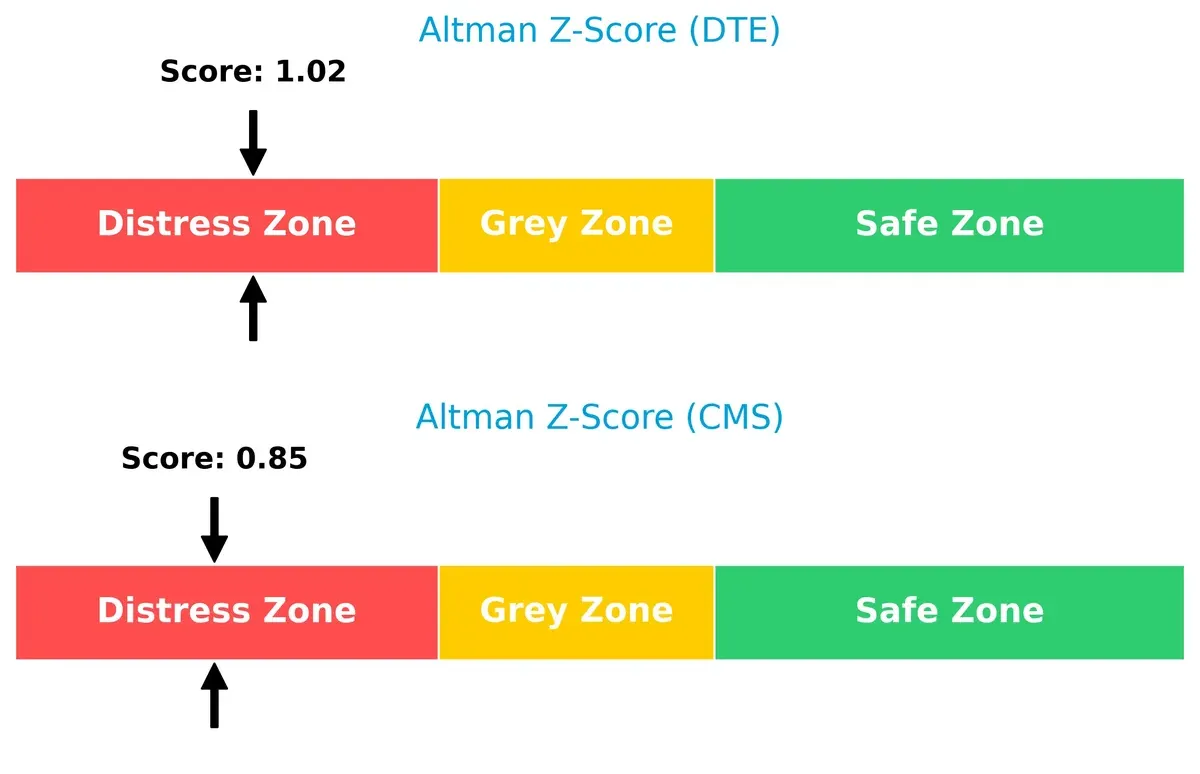
This signals elevated bankruptcy risk for both firms in this cycle. Historically, utility companies maintain stable cash flows, but these scores warn investors to exercise caution due to weak solvency metrics.
Financial Health: Quality of Operations
Both DTE and CMS score 7 on the Piotroski F-Score, indicating strong internal financial health:
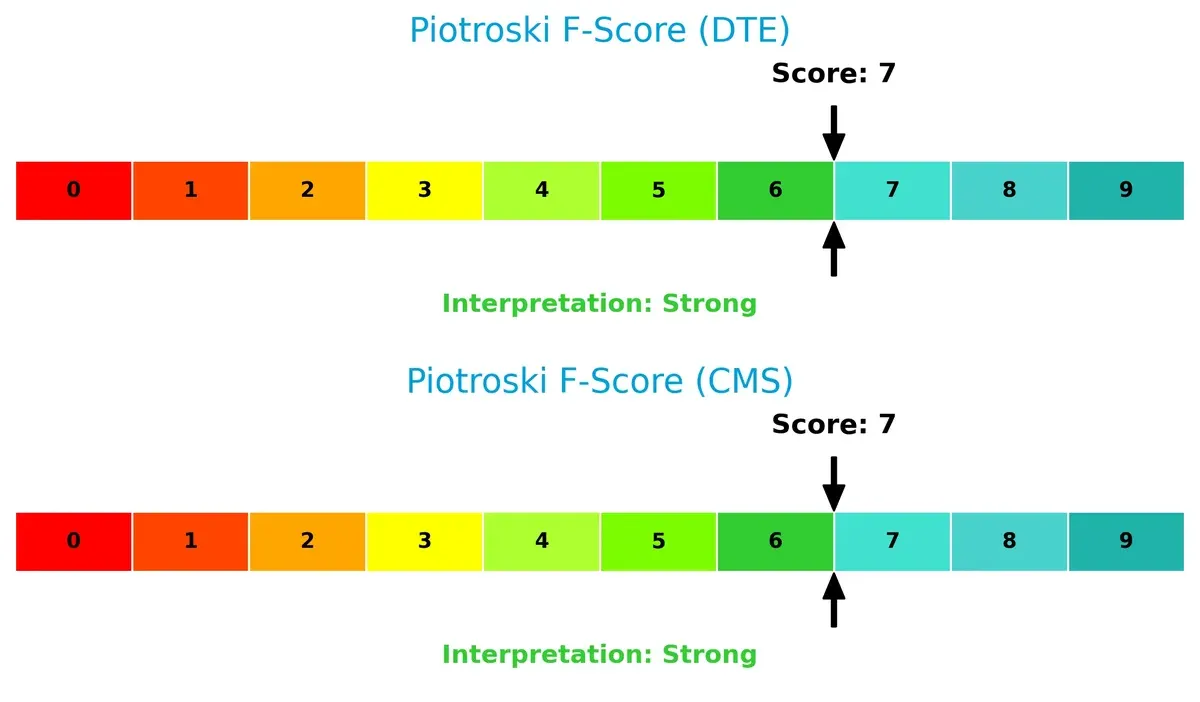
This suggests both companies maintain solid profitability, liquidity, and operational efficiency. Despite their solvency concerns, internal metrics do not flag immediate red flags, supporting a cautiously optimistic operational outlook.
How are the two companies positioned?
This section dissects the operational DNA of DTE and CMS by comparing their revenue distribution by segment alongside their internal strengths and weaknesses. The goal is to confront their economic moats and identify which model delivers the most resilient, sustainable competitive advantage today.
Revenue Segmentation: The Strategic Mix
This visual comparison dissects how DTE Energy Company and CMS Energy Corporation diversify their income streams and where their primary sector bets lie:
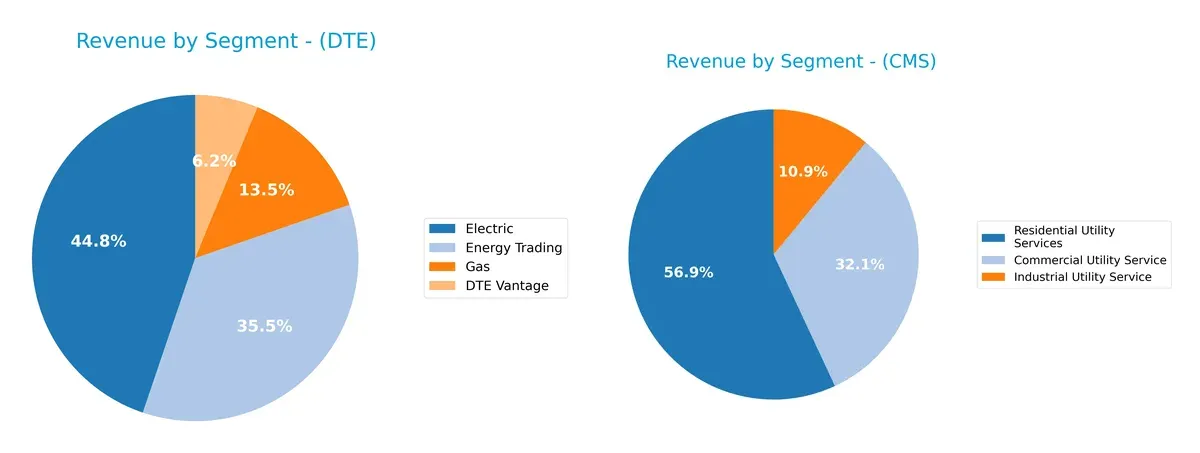
DTE Energy anchors its revenue in Electric ($5.8B) and Energy Trading ($4.6B), with notable Gas and DTE Vantage contributions, showcasing a balanced yet concentrated portfolio. CMS leans heavily on Residential Utility Services ($3.7B) complemented by Commercial ($2.1B) and Industrial ($720M) segments, revealing a classic utility mix. DTE’s diversity in energy trading suggests infrastructure dominance, while CMS’s focus signals steady regulated cash flows but concentration risk in residential demand.
Strengths and Weaknesses Comparison
This table compares the strengths and weaknesses of DTE Energy Company and CMS Energy Corporation:
DTE Strengths
- Diversified revenue streams including Electric, Gas, Energy Trading, and DTE Vantage
- Favorable net margin at 11.25%
- Favorable WACC at 5.11%
- Dividend yield of 3.24% supports shareholder returns
CMS Strengths
- Balanced utility service segments: Commercial, Industrial, Residential
- Highest net margin of 12.54% among peers
- Favorable WACC at 5.02%
- Strong liquidity with current and quick ratios around 1.34
- Dividend yield at 3.1%
DTE Weaknesses
- Low current and quick ratios below 1 signal liquidity concerns
- ROIC at 4.53% below WACC of 5.11% indicates capital inefficiency
- High debt-to-equity ratio near 2.0
- Asset turnover metrics unfavorable, suggesting low asset utilization
CMS Weaknesses
- ROIC of 3.71% below WACC of 5.02% reflects poor capital returns
- Debt-to-equity ratio above 2.1 raises leverage risks
- Unfavorable asset turnover ratios indicate suboptimal asset use
DTE shows strength in diversified revenue and favorable profitability but faces liquidity and capital efficiency challenges. CMS benefits from stronger liquidity and a more balanced revenue mix but contends with weaker returns on invested capital and leverage risks. Both firms must address asset utilization to enhance operational efficiency.
The Moat Duel: Analyzing Competitive Defensibility
A structural moat protects long-term profits from competition’s relentless erosion. Without it, market share and margins quickly deteriorate:
DTE Energy Company: Infrastructure-Backed Switching Costs
DTE’s moat hinges on extensive utility infrastructure creating high switching costs. Its stable margins and improving ROIC reflect efficient capital use. Expanding renewables in 2026 could strengthen this advantage.
CMS Energy Corporation: Scale-Driven Cost Advantage
CMS leverages scale and a diverse energy mix to drive cost advantages, but its declining ROIC signals weakening efficiency. Growth in renewables and gas markets may offer upside if operational efficiency improves.
Infrastructure Resilience vs. Scale Efficiency: The Moat Face-Off
DTE’s growing ROIC and margin stability suggest a deeper moat despite value destruction. CMS faces a steeper decline in profitability, indicating a weaker competitive shield. DTE is better positioned to defend market share long term.
Which stock offers better returns?
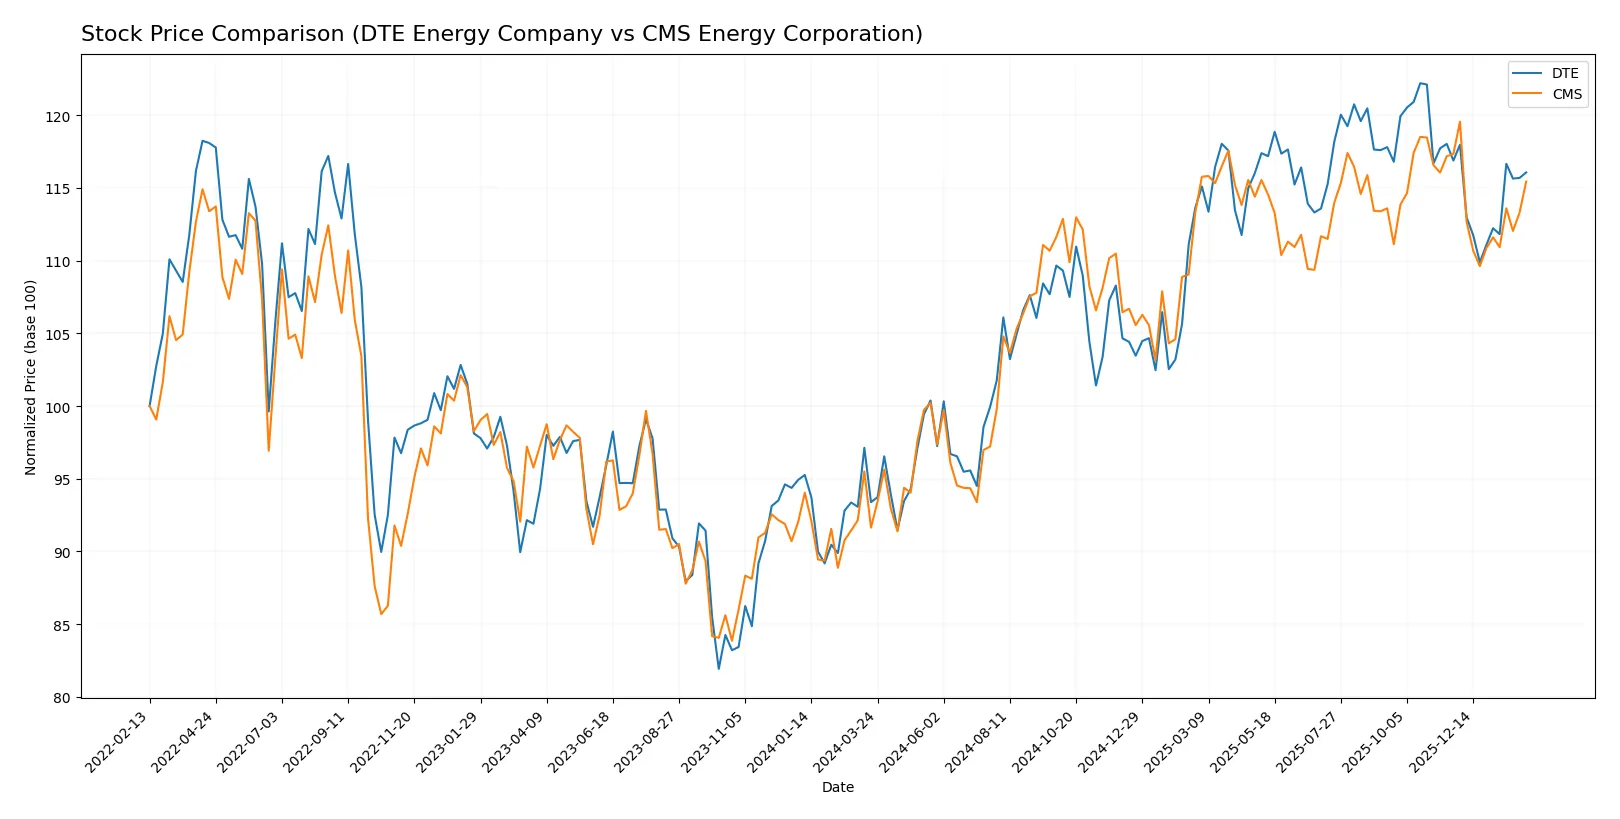
Over the past 12 months, both stocks showed strong price gains before recent mild declines, reflecting decelerating momentum and shifting trading dynamics.
Trend Comparison
DTE Energy Company’s stock increased 24.28% over the past year, marking a bullish trend with decelerating momentum. It recorded a high of 141.95 and a low of 106.25.
CMS Energy Corporation’s stock rose 25.98% over the same period, also bullish but with deceleration. Its price ranged between 57.66 and 75.44, showing lower volatility than DTE.
CMS slightly outperformed DTE in total return over the year, despite both showing recent mild downward corrections and decelerating trend slopes.
Target Prices
Analysts present a moderately bullish consensus for DTE Energy Company and CMS Energy Corporation.
| Company | Target Low | Target High | Consensus |
|---|---|---|---|
| DTE Energy Company | 141 | 152 | 146.75 |
| CMS Energy Corporation | 74 | 82 | 78.14 |
The target consensus for DTE at 146.75 exceeds its current price of 134.82, signaling potential upside. CMS’s consensus of 78.14 also surpasses its 72.84 price, indicating positive analyst expectations.

Don’t Let Luck Decide Your Entry Point
Optimize your entry points with our advanced ProRealTime indicators. You’ll get efficient buy signals with precise price targets for maximum performance. Start outperforming now!
How do institutions grade them?
The following tables summarize recent institutional grades for DTE Energy Company and CMS Energy Corporation:
DTE Energy Company Grades
This table presents recent grade actions issued by major financial institutions for DTE Energy Company.
| Grading Company | Action | New Grade | Date |
|---|---|---|---|
| Morgan Stanley | Maintain | Overweight | 2026-02-02 |
| Jefferies | Maintain | Buy | 2026-01-28 |
| Mizuho | Maintain | Outperform | 2026-01-26 |
| Wells Fargo | Maintain | Overweight | 2026-01-20 |
| Barclays | Maintain | Equal Weight | 2026-01-15 |
| BMO Capital | Maintain | Market Perform | 2025-12-24 |
| UBS | Maintain | Buy | 2025-12-17 |
| Jefferies | Upgrade | Buy | 2025-12-11 |
| JP Morgan | Maintain | Neutral | 2025-12-11 |
| B of A Securities | Maintain | Buy | 2025-11-05 |
CMS Energy Corporation Grades
This table summarizes recent institutional ratings and changes for CMS Energy Corporation.
| Grading Company | Action | New Grade | Date |
|---|---|---|---|
| Mizuho | Maintain | Neutral | 2026-02-06 |
| Morgan Stanley | Maintain | Equal Weight | 2026-02-02 |
| Jefferies | Maintain | Buy | 2026-01-28 |
| Wells Fargo | Maintain | Equal Weight | 2026-01-20 |
| JP Morgan | Maintain | Overweight | 2026-01-15 |
| Jefferies | Maintain | Buy | 2026-01-15 |
| Barclays | Maintain | Overweight | 2026-01-15 |
| UBS | Maintain | Neutral | 2025-12-17 |
| JP Morgan | Maintain | Overweight | 2025-12-11 |
| Morgan Stanley | Maintain | Equal Weight | 2025-10-22 |
Which company has the best grades?
DTE Energy consistently receives stronger ratings, including multiple “Buy” and “Outperform” grades. CMS Energy mostly earns “Neutral” to “Overweight” ratings. Investors might interpret DTE’s higher grades as greater confidence from analysts.
Risks specific to each company
The following categories identify the critical pressure points and systemic threats facing both firms in the 2026 market environment:
1. Market & Competition
DTE Energy Company
- Operates in a highly regulated electric utility sector with fossil fuel and renewables mix; faces competition from alternative energy sources.
CMS Energy Corporation
- Similar regulated electric and gas utility model with growing renewable assets; competition from emerging green energy providers.
2. Capital Structure & Debt
DTE Energy Company
- High debt-to-equity ratio at 1.99 signals leverage risk; interest coverage moderate at 2.44 times.
CMS Energy Corporation
- Slightly higher debt-to-equity at 2.12; interest coverage slightly better at 2.58; both carry notable leverage risks.
3. Stock Volatility
DTE Energy Company
- Low beta of 0.484 indicates lower stock volatility, offering relative stability versus broader market swings.
CMS Energy Corporation
- Very similar low beta at 0.481, reflecting comparable stock price stability in turbulent markets.
4. Regulatory & Legal
DTE Energy Company
- Subject to evolving environmental regulations impacting fossil fuel operations; compliance costs could pressure margins.
CMS Energy Corporation
- Faces similar regulatory landscape with increasing emphasis on clean energy transitions and compliance expenditures.
5. Supply Chain & Operations
DTE Energy Company
- Operates extensive infrastructure including 698 substations and 449,800 transformers; operational complexity is high.
CMS Energy Corporation
- Larger employee base and extensive distribution lines increase operational risks but also scale efficiencies.
6. ESG & Climate Transition
DTE Energy Company
- Invests in wind and other renewables but still reliant on fossil fuels; climate transition risk remains material.
CMS Energy Corporation
- Accelerating renewable energy projects, yet coal and gas remain significant; ESG pressures growing from stakeholders.
7. Geopolitical Exposure
DTE Energy Company
- Primarily US-focused with limited direct geopolitical risk; domestic policy changes pose more impact.
CMS Energy Corporation
- Similarly US-centric operations limit international geopolitical risks but remain sensitive to federal energy policy shifts.
Which company shows a better risk-adjusted profile?
DTE’s most impactful risk lies in its high leverage and weak liquidity ratios, signaling financial strain despite stable operations. CMS faces similar leverage challenges but benefits from stronger liquidity and slightly better operational scale. Both firms have low stock volatility, indicating market confidence. However, CMS’s more balanced liquidity metrics and neutral overall financial ratios suggest a stronger risk-adjusted profile. Notably, both companies fall in the Altman Z-Score distress zone, which raises concerns about financial stability, but CMS’s marginally better interest coverage and current ratios justify a cautiously more favorable stance.
Final Verdict: Which stock to choose?
DTE Energy Company stands out for its growing profitability despite facing challenges in capital efficiency. Its superpower lies in steadily improving returns on assets and equity, signaling management’s ability to enhance value over time. A point of vigilance remains its stretched liquidity and leverage, which could pressure financial flexibility. This stock suits an aggressive growth portfolio willing to tolerate balance sheet risks for upside potential.
CMS Energy Corporation’s strategic moat is its superior gross and EBIT margins, reflecting strong operational control and pricing power. It offers a more stable liquidity profile and slightly better free cash flow yield than DTE, providing a cushion against market volatility. CMS fits a GARP (Growth at a Reasonable Price) portfolio, appealing to investors seeking quality growth with moderate risk exposure.
If you prioritize growth driven by improving profitability and can navigate financial leverage, DTE outshines as the compelling choice with its upward trajectory. However, if you seek better stability and operational efficiency combined with a cleaner balance sheet, CMS offers superior safety and margin resilience. Both companies shed value relative to their cost of capital, so cautious allocation aligned with your risk tolerance is essential.
Disclaimer: Investment carries a risk of loss of initial capital. The past performance is not a reliable indicator of future results. Be sure to understand risks before making an investment decision.
Go Further
I encourage you to read the complete analyses of DTE Energy Company and CMS Energy Corporation to enhance your investment decisions: