Home > Comparison > Utilities > D vs CMS
The strategic rivalry between Dominion Energy, Inc. and CMS Energy Corporation shapes the future of the regulated electric utility sector. Dominion operates a vast, capital-intensive network across multiple states, while CMS focuses on integrated electric and gas utilities primarily in Michigan. This analysis pits Dominion’s expansive asset base against CMS’s diversified energy mix to identify which offers superior risk-adjusted returns. I will determine the better fit for a balanced, long-term portfolio.

Table of contents
Companies Overview
Dominion Energy and CMS Energy stand as key players in the regulated electric utilities market, each with distinct regional footprints and strategies.
Dominion Energy: Integrated Energy Giant
Dominion Energy dominates the U.S. regulated electric sector with a diversified portfolio spanning electricity and natural gas. Its core revenue derives from regulated electricity generation, transmission, and distribution across multiple states, serving millions of customers. In 2021, it emphasized expanding renewable assets and contracted long-term power agreements, reinforcing its competitive advantage in sustainable energy infrastructure.
CMS Energy: Michigan’s Utility Powerhouse
CMS Energy primarily serves Michigan, focusing on electric and gas utility operations. It generates revenue through electricity generation from diverse sources including coal, gas, nuclear, and renewables, alongside natural gas sales and distribution. The company’s 2021 strategy centered on enhancing renewable generation and modernizing its extensive distribution network, maintaining a strong market position in regional energy delivery.
Strategic Collision: Similarities & Divergences
Both companies rely on regulated utilities but differ in scale and geographic focus—Dominion spans multiple states while CMS concentrates on Michigan. Their business philosophies contrast with Dominion pursuing a broad asset mix and contracted renewables, whereas CMS prioritizes grid modernization and diversified generation sources. Their battleground lies in balancing growth via renewables against regulated stability. These differences shape distinct investment profiles marked by scale versus regional specialization.
Income Statement Comparison
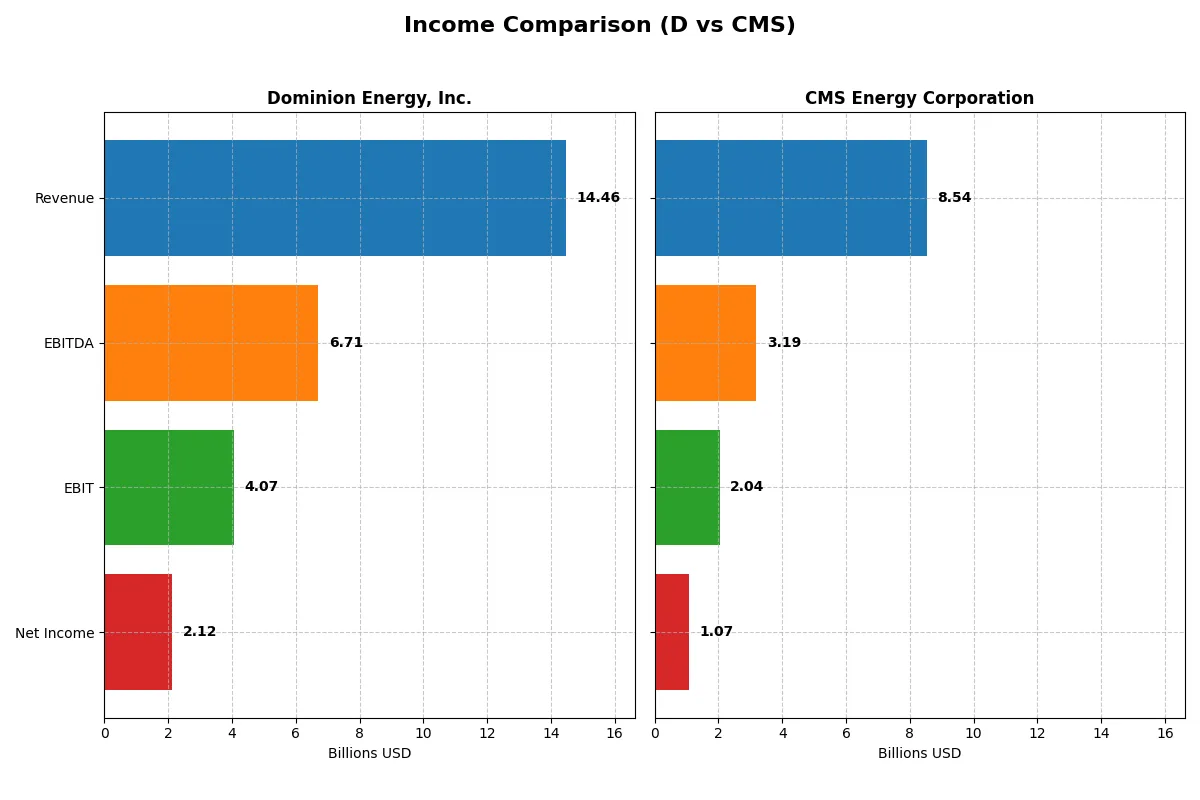
This data dissects the core profitability and scalability of both corporate engines to reveal who dominates the bottom line:
| Metric | Dominion Energy, Inc. (D) | CMS Energy Corporation (CMS) |
|---|---|---|
| Revenue | 14.5B | 7.5B |
| Cost of Revenue | 7.5B | 4.3B |
| Operating Expenses | 3.7B | 1.7B |
| Gross Profit | 6.9B | 3.2B |
| EBITDA | 6.7B | 3.1B |
| EBIT | 4.1B | 1.8B |
| Interest Expense | 1.9B | 0.7B |
| Net Income | 2.1B | 1.0B |
| EPS | 2.44 | 3.34 |
| Fiscal Year | 2024 | 2024 |
Income Statement Analysis: The Bottom-Line Duel
This income statement comparison reveals which company drives superior operational efficiency and bottom-line growth in their sector.
Dominion Energy, Inc. Analysis
Dominion Energy’s revenue grew modestly to $14.5B in 2024, with net income rising to $2.12B. The company maintains strong gross (47.9%) and net margins (14.7%), reflecting solid cost control despite rising interest expenses. Its 10% EBIT growth and 6.5% EPS increase highlight improving profitability momentum amid a stable revenue base.
CMS Energy Corporation Analysis
CMS Energy expanded revenue by 13.6% to $8.5B in 2025, with net income at $1.07B. It boasts superior gross margin at 60.9%, though net margin trails at 12.5%, partly due to higher operating expenses growing alongside revenue. CMS’s 11.3% EBIT growth and 6% EPS rise show operational gains, but a slight net margin contraction signals pressure on bottom-line efficiency.
Margin Strength vs. Revenue Growth Momentum
Dominion Energy outperforms with higher net margin and sustained bottom-line expansion over time. CMS leads in revenue growth and gross profitability but faces margin compression. For investors prioritizing durable profit gains and margin discipline, Dominion offers a more resilient profile, while CMS appeals to those valuing top-line acceleration despite cost challenges.
Financial Ratios Comparison
These vital ratios act as a diagnostic tool to expose the underlying fiscal health, valuation premiums, and capital efficiency of the companies analyzed:
| Ratios | Dominion Energy, Inc. (D) | CMS Energy Corporation (CMS) |
|---|---|---|
| ROE | 7.79% | 12.01% |
| ROIC | 2.86% | 3.71% |
| P/E | 21.3 | 19.5 |
| P/B | 1.66 | 2.34 |
| Current Ratio | 0.71 | 1.34 |
| Quick Ratio | 0.52 | 1.34 |
| D/E | 1.53 | 2.12 |
| Debt-to-Assets | 40.8% | 47.3% |
| Interest Coverage | 1.72 | 2.19 |
| Asset Turnover | 0.14 | 0.21 |
| Fixed Asset Turnover | 0.21 | 0.28 |
| Payout ratio | 105% | 60% |
| Dividend yield | 4.95% | 3.10% |
| Fiscal Year | 2024 | 2025 |
Efficiency & Valuation Duel: The Vital Signs
Ratios act as the company’s DNA, revealing hidden risks and operational excellence critical for understanding true investment potential.
Dominion Energy, Inc.
Dominion Energy exhibits a moderate ROE of 7.79%, below the WACC of 5.43%, indicating limited value creation. Its net margin of 14.69% is favorable, but the P/E of 21.28 suggests a fairly priced stock. Dividend yield at 4.95% rewards shareholders amid an unfavorable liquidity profile and high leverage.
CMS Energy Corporation
CMS posts a stronger ROE at 12.01%, slightly exceeding the WACC of 5.02%, reflecting better capital efficiency. The net margin of 12.54% is solid, while a P/E of 19.49 points to a neutral valuation. Dividend yield stands at 3.1%, supported by healthier liquidity ratios despite higher debt-to-equity.
Balanced Stability vs. Operational Efficiency
CMS balances a stronger ROE and better liquidity against Dominion’s higher dividend yield and slightly stretched valuation. CMS offers a more favorable operational profile with moderate risk, fitting investors prioritizing capital efficiency. Dominion suits those valuing income with caution on financial health.
Which one offers the Superior Shareholder Reward?
Dominion Energy (D) offers a higher dividend yield near 5% but with payout ratios exceeding free cash flow, signaling sustainability risks. CMS Energy (CMS) yields about 3.1%, with a conservative payout ratio around 60% and positive free cash flow supporting dividends. Both deploy buybacks, but CMS’s stronger free cash flow and healthier coverage ratios suggest a more sustainable, balanced return strategy. I see CMS providing a superior total shareholder reward in 2026, balancing income with capital preservation and growth potential.
Comparative Score Analysis: The Strategic Profile
The radar chart reveals the fundamental DNA and trade-offs of Dominion Energy, Inc. and CMS Energy Corporation across key financial metrics:
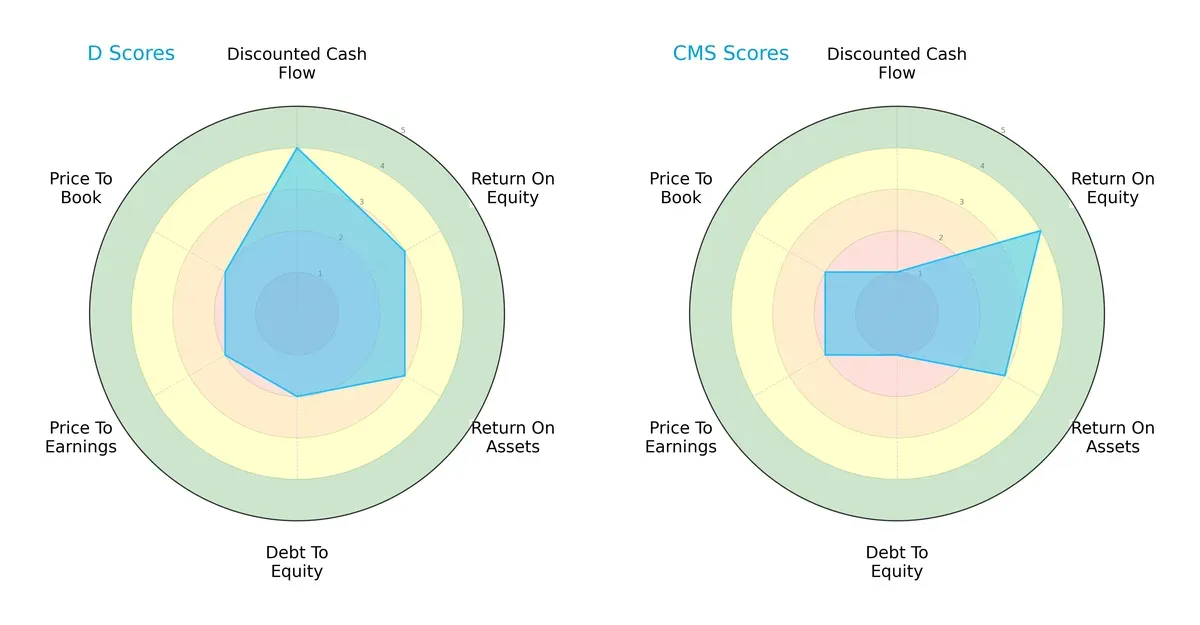
Dominion Energy scores higher in discounted cash flow (4 vs. 1), indicating better future cash flow prospects. CMS excels in return on equity (4 vs. 3) but lags in debt-to-equity (1 vs. 2), signaling heavier leverage risk. Dominion offers a more balanced profile, while CMS relies on superior equity returns amid financial risk. Both show weaknesses in valuation metrics (PE/PB at 2).
Bankruptcy Risk: Solvency Showdown
Dominion and CMS both fall into the distress zone with Altman Z-scores below 1.8, signaling elevated bankruptcy risk in this economic cycle:
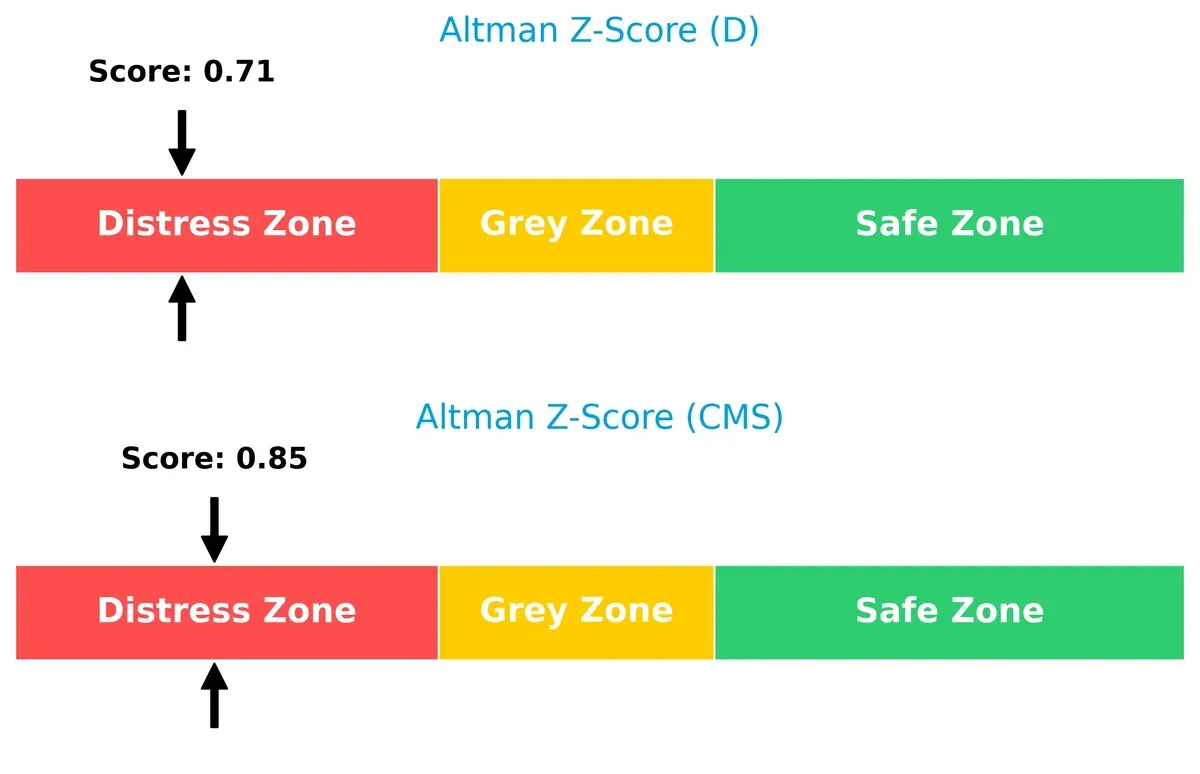
Dominion’s score of 0.71 slightly trails CMS’s 0.85, but both indicate urgent caution for long-term survival amid tightening credit conditions.
Financial Health: Quality of Operations
Both firms share a Piotroski F-Score of 7, indicating strong financial health and operational quality with no immediate red flags compared to peers:
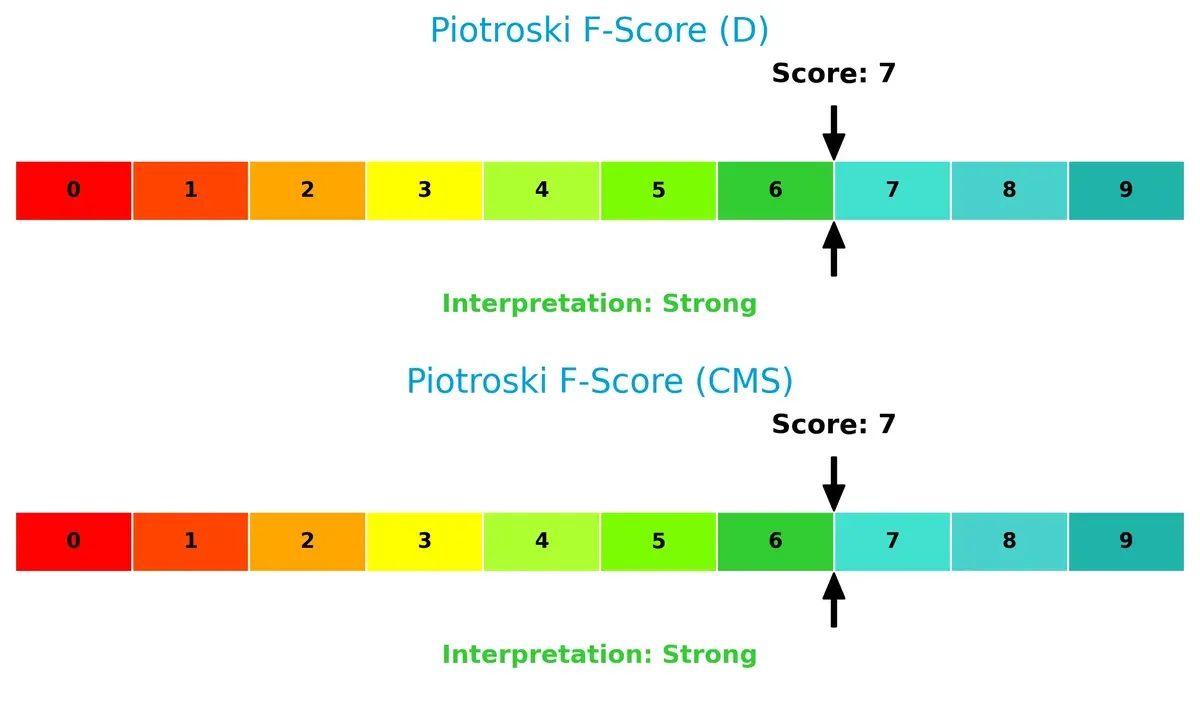
This score reflects solid profitability, efficiency, and liquidity, providing a foundation of resilience despite solvency concerns.
How are the two companies positioned?
This section dissects Dominion Energy and CMS Energy’s operational DNA by comparing revenue distribution and internal dynamics. The goal is to confront their economic moats and identify the most resilient competitive advantage in today’s market.
Revenue Segmentation: The Strategic Mix
This comparison dissects how Dominion Energy and CMS Energy diversify their income streams and reveals where each company places its primary sector bets:
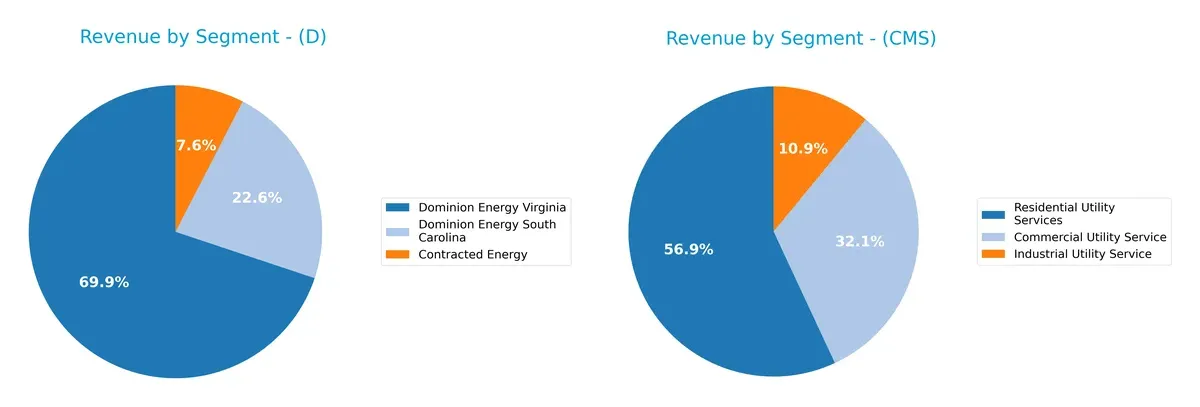
Dominion Energy anchors revenue predominantly in its Virginia segment with $10.2B in 2024, dwarfing other streams like South Carolina at $3.3B and Contracted Energy at $1.1B. This concentration signals regional infrastructure dominance but raises concentration risk. CMS Energy shows a more balanced mix, with Residential Utility Services leading at $3.7B, Commercial Utility Service at $2.1B, and Industrial Utility Service at $720M. CMS pivots on diversified utility customer bases, reducing dependence on a single segment.
Strengths and Weaknesses Comparison
This table compares the strengths and weaknesses of Dominion Energy, Inc. and CMS Energy Corporation based on key financial and operational factors:
Dominion Energy Strengths
- Higher net margin at 14.69%
- Favorable dividend yield of 4.95%
- Lower WACC at 5.43% indicating cheaper capital
- More diversified revenue streams across regions and services
CMS Energy Strengths
- Favorable net margin at 12.54%
- Stronger current and quick ratios suggesting better liquidity
- Neutral ROE at 12.01%, indicating decent profitability
- Lower WACC at 5.02% supports efficient capital allocation
Dominion Energy Weaknesses
- Unfavorable ROE at 7.79% and ROIC at 2.86% below WACC
- Poor liquidity ratios with current ratio 0.71 and quick ratio 0.52
- High debt-to-equity at 1.53 and low asset turnover
- Neutral interest coverage at 2.16 limits financial flexibility
CMS Energy Weaknesses
- Unfavorable ROIC at 3.71% below WACC
- Higher debt-to-equity at 2.12 raises financial risk
- Unfavorable asset turnover and fixed asset turnover
- Neutral interest coverage at 2.58 limits cushioning in downturns
Dominion Energy shows stronger profitability and dividend yield but struggles with liquidity and returns on capital. CMS has more balanced liquidity and profitability metrics but carries higher leverage and efficiency concerns. Both face challenges in optimizing asset utilization and capital returns.
The Moat Duel: Analyzing Competitive Defensibility
A structural moat is the only reliable shield protecting long-term profits from relentless competitive erosion:
Dominion Energy, Inc.: Infrastructure Scale and Contractual Barriers
Dominion’s moat stems from extensive regulated utility assets and long-term contracts, driving stable margins and improving ROIC despite value destruction. Expansion into renewables could strengthen this in 2026.
CMS Energy Corporation: Regional Focus and Operational Efficiency
CMS relies on a tightly integrated regional utility network with cost controls. However, declining ROIC signals weakening efficiency. Growth in renewables offers upside but may pressure margins further.
Infrastructure Footprint vs. Regional Efficiency: Dominion’s Scale Edges Out CMS
Dominion’s growing ROIC trend, despite current value shedding, indicates a deeper moat than CMS’s declining profitability. Dominion stands better poised to defend market share through asset scale and contract longevity.
Which stock offers better returns?
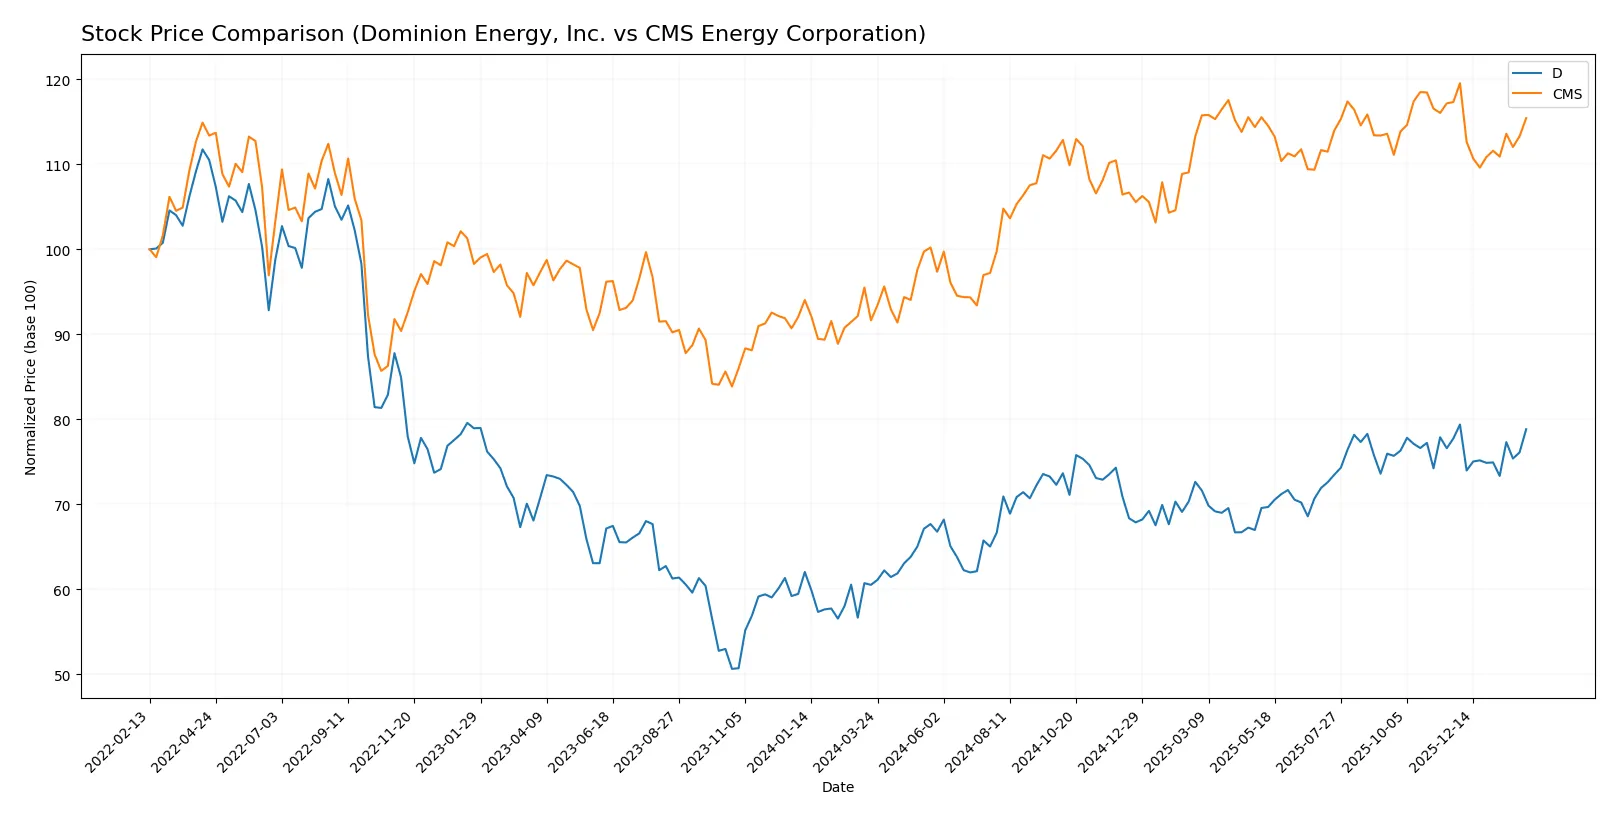
Over the past year, both Dominion Energy, Inc. and CMS Energy Corporation showed strong price appreciation with decelerating bullish momentum and rising trading volumes.
Trend Comparison
Dominion Energy, Inc. posted a 30.29% price increase over 12 months, indicating a bullish trend with decelerating momentum and a price range between 47.84 and 62.77.
CMS Energy Corporation gained 25.98% in the same period, also bullish but decelerating, with a wider price range from 57.66 to 75.44 and higher volatility.
Dominion Energy’s higher return outperformed CMS Energy despite slightly lower volatility, suggesting stronger market performance over the analyzed year.
Target Prices
Analysts show a moderately bullish outlook on Dominion Energy and CMS Energy, with target prices above current market levels.
| Company | Target Low | Target High | Consensus |
|---|---|---|---|
| Dominion Energy, Inc. | 63 | 69 | 65.86 |
| CMS Energy Corporation | 74 | 82 | 78.14 |
Both stocks trade below their consensus targets, suggesting room for upside. Dominion Energy’s consensus target is just 5.6% above its current price, while CMS Energy’s target implies a more significant 7.3% potential gain.

Don’t Let Luck Decide Your Entry Point
Optimize your entry points with our advanced ProRealTime indicators. You’ll get efficient buy signals with precise price targets for maximum performance. Start outperforming now!
How do institutions grade them?
The following tables summarize recent institutional grades for Dominion Energy, Inc. and CMS Energy Corporation:
Dominion Energy, Inc. Grades
This table lists recent grades from major financial institutions for Dominion Energy, Inc.
| Grading Company | Action | New Grade | Date |
|---|---|---|---|
| Barclays | Maintain | Overweight | 2026-01-22 |
| Wells Fargo | Maintain | Overweight | 2026-01-20 |
| Barclays | Maintain | Overweight | 2025-12-17 |
| JP Morgan | Maintain | Underweight | 2025-12-11 |
| BMO Capital | Maintain | Market Perform | 2025-11-03 |
| Morgan Stanley | Maintain | Equal Weight | 2025-10-22 |
| Barclays | Maintain | Overweight | 2025-10-07 |
| Morgan Stanley | Maintain | Equal Weight | 2025-09-25 |
| JP Morgan | Maintain | Underweight | 2025-08-21 |
| JP Morgan | Maintain | Underweight | 2025-07-15 |
CMS Energy Corporation Grades
This table presents recent grades from respected financial firms for CMS Energy Corporation.
| Grading Company | Action | New Grade | Date |
|---|---|---|---|
| Mizuho | Maintain | Neutral | 2026-02-06 |
| Morgan Stanley | Maintain | Equal Weight | 2026-02-02 |
| Jefferies | Maintain | Buy | 2026-01-28 |
| Wells Fargo | Maintain | Equal Weight | 2026-01-20 |
| JP Morgan | Maintain | Overweight | 2026-01-15 |
| Jefferies | Maintain | Buy | 2026-01-15 |
| Barclays | Maintain | Overweight | 2026-01-15 |
| UBS | Maintain | Neutral | 2025-12-17 |
| JP Morgan | Maintain | Overweight | 2025-12-11 |
| Morgan Stanley | Maintain | Equal Weight | 2025-10-22 |
Which company has the best grades?
CMS Energy Corporation generally receives higher and more positive grades, including multiple Buy and Overweight ratings. Dominion Energy shows mixed grades with several Underweight ratings. CMS’s stronger institutional support may influence investor sentiment more favorably.
Risks specific to each company
The following categories identify the critical pressure points and systemic threats facing both firms in the 2026 market environment:
1. Market & Competition
Dominion Energy, Inc.
- Faces stiff competition from renewable energy providers; regulated market limits pricing power.
CMS Energy Corporation
- Competes in a smaller regional market with diversified generation sources, but faces intense regulatory scrutiny.
2. Capital Structure & Debt
Dominion Energy, Inc.
- High debt-to-equity of 1.53 signals elevated financial risk; interest coverage moderate at 2.16x.
CMS Energy Corporation
- Even higher debt-to-equity at 2.12 raises solvency concerns; interest coverage slightly better at 2.58x.
3. Stock Volatility
Dominion Energy, Inc.
- Beta of 0.71 indicates moderate volatility, less sensitive to market swings.
CMS Energy Corporation
- Lower beta of 0.48 suggests greater stability but possible underperformance in bull markets.
4. Regulatory & Legal
Dominion Energy, Inc.
- Exposure to multi-state regulatory regimes increases compliance complexity and risk of adverse rulings.
CMS Energy Corporation
- Concentrated in Michigan, regulatory risk is regionally focused but significant given state policies on energy.
5. Supply Chain & Operations
Dominion Energy, Inc.
- Extensive infrastructure with 30.2 GW capacity and large transmission network; operational risks from aging assets.
CMS Energy Corporation
- Wide distribution network with diverse energy sources; supply chain risks mitigated by regional scale.
6. ESG & Climate Transition
Dominion Energy, Inc.
- Facing pressure to accelerate renewable investments; legacy fossil assets pose transition risk.
CMS Energy Corporation
- More advanced renewable portfolio but must navigate regulatory incentives and carbon reduction targets.
7. Geopolitical Exposure
Dominion Energy, Inc.
- Primarily domestic US operations limit geopolitical risk but vulnerable to national policy shifts.
CMS Energy Corporation
- Similarly limited geopolitical exposure, yet Michigan’s industrial base could be sensitive to trade policies.
Which company shows a better risk-adjusted profile?
Dominion Energy’s dominant risk is its heavy debt load combined with distress-level Altman Z-Score, signaling potential financial distress. CMS Energy’s greatest risk lies in its even higher leverage and very unfavorable debt-to-equity rating. However, CMS exhibits a stronger Piotroski score and better liquidity ratios. Overall, CMS’s risk-adjusted profile appears more balanced due to superior short-term liquidity and operational stability. The recent data reveal both firms operate in distress zones per Altman Z-Scores, underscoring caution, but CMS’s stronger liquidity cushions against immediate solvency threats.
Final Verdict: Which stock to choose?
Dominion Energy’s superpower lies in its resilience and steady income generation, anchored by a robust dividend yield near 5%. However, its heavy debt load and stretched liquidity ratios signal a point of vigilance. This stock might fit investors seeking income with a tolerance for financial leverage risks.
CMS Energy commands a strategic moat through its consistent operating efficiency and healthier liquidity profile, offering a safer balance sheet compared to Dominion. Its recurring revenue and strong cash flow generation position it well for growth at a reasonable price, appealing to more risk-averse growth investors.
If you prioritize income stability and are comfortable with elevated financial leverage, Dominion Energy offers a compelling scenario due to its strong dividend and improving profitability. However, if you seek better balance sheet safety and a steadier growth outlook, CMS Energy outshines with superior liquidity and operational discipline. Both stocks carry risks, but align differently with investor risk tolerance and portfolio goals.
Disclaimer: Investment carries a risk of loss of initial capital. The past performance is not a reliable indicator of future results. Be sure to understand risks before making an investment decision.
Go Further
I encourage you to read the complete analyses of Dominion Energy, Inc. and CMS Energy Corporation to enhance your investment decisions: