Home > Comparison > Utilities > ED vs CMS
The strategic rivalry between Consolidated Edison, Inc. and CMS Energy Corporation shapes the Utilities sector’s landscape. Consolidated Edison operates as a capital-intensive regulated electric utility with a strong presence in New York’s urban market. CMS Energy combines electric and gas utilities with diversified energy generation across Michigan. This head-to-head contrasts legacy infrastructure strength against integrated utility growth. This analysis aims to identify which company delivers superior risk-adjusted returns for a balanced portfolio in today’s energy transition environment.
Table of contents
Companies Overview
Consolidated Edison and CMS Energy play pivotal roles in the regulated electric utility sector, powering millions of customers in distinct U.S. regions.
Consolidated Edison, Inc.: New York’s Energy Backbone
Consolidated Edison dominates the regulated electric, gas, and steam delivery market in New York. Its core revenue engine lies in serving 3.5M electric, 1.1M gas, and steam customers. In 2026, the company emphasizes expanding renewable energy projects and transmission investments, strengthening its infrastructure to support New York’s evolving energy needs.
CMS Energy Corporation: Michigan’s Integrated Utility Leader
CMS Energy operates a diversified utility platform in Michigan, combining electric and gas services. Its revenue stems from generating and distributing electricity and natural gas to 1.9M electric and 1.8M gas customers. The company’s 2026 strategy focuses on balancing traditional energy sources with renewable generation and enhancing grid reliability through infrastructure upgrades.
Strategic Collision: Similarities & Divergences
Both companies pursue regulated utility models but diverge in geographic focus and energy mix. Consolidated Edison prioritizes urban infrastructure and renewable projects in New York, while CMS Energy blends coal, nuclear, and renewables in a more diversified Michigan market. Their competition centers on infrastructure modernization and clean energy adoption. These differences shape distinct risk and growth profiles for investors tracking utility sector resilience.
Income Statement Comparison
This data dissects the core profitability and scalability of both corporate engines to reveal who dominates the bottom line:
| Metric | Consolidated Edison, Inc. (ED) | CMS Energy Corporation (CMS) |
|---|---|---|
| Revenue | 15.3B | 7.5B |
| Cost of Revenue | 5.5B | 4.3B |
| Operating Expenses | 7.0B | 1.7B |
| Gross Profit | 9.8B | 3.2B |
| EBITDA | 5.5B | 3.1B |
| EBIT | 3.3B | 1.8B |
| Interest Expense | 1.2B | 708M |
| Net Income | 1.8B | 1.0B |
| EPS | 5.26 | 3.34 |
| Fiscal Year | 2024 | 2024 |
Income Statement Analysis: The Bottom-Line Duel
This income statement comparison reveals which company runs a more efficient and profitable business engine in the current market environment.
Consolidated Edison, Inc. Analysis
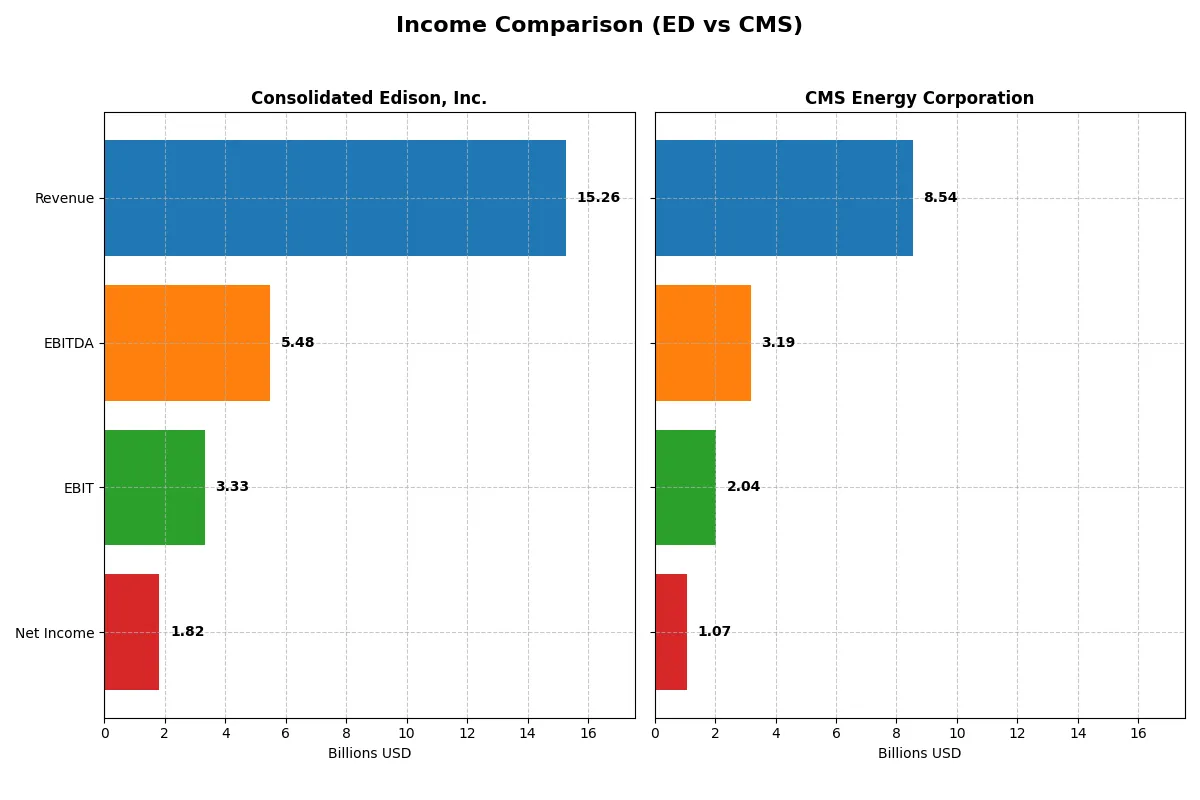
Consolidated Edison’s revenue grew steadily to $15.3B in 2024, with net income reaching $1.82B despite a recent dip from $2.52B in 2023. The company maintains a strong gross margin near 64% and a solid net margin of 11.9%, showcasing resilient profitability. However, a 17.5% EBIT decline in 2024 signals some operational headwinds.
CMS Energy Corporation Analysis
CMS Energy posted a revenue increase to $8.5B in 2025 with net income at $1.07B, improving from $1.0B in 2024. Its gross margin stands favorably at 60.9%, and net margin slightly outperforms Consolidated Edison at 12.5%. CMS shows positive momentum with 11.3% EBIT growth and a 13.6% revenue jump in the latest year, reflecting operational efficiency gains.
Margin Stability vs. Growth Momentum
Consolidated Edison delivers higher absolute net income and superior margin stability over five years, despite recent earnings softness. CMS Energy, while smaller, demonstrates stronger recent growth in revenue and EBIT, though net income declined overall. Investors seeking steady margin reliability may prefer Consolidated Edison; those favoring growth momentum might lean toward CMS Energy’s improving operational trends.
Financial Ratios Comparison
These vital ratios act as a diagnostic tool to expose the underlying fiscal health, valuation premiums, and capital efficiency of the companies compared below:
| Ratios | Consolidated Edison, Inc. (ED) | CMS Energy Corporation (CMS) |
|---|---|---|
| ROE | 8.3% | 12.0% |
| ROIC | 3.5% | 3.7% |
| P/E | 17.0 | 19.5 |
| P/B | 1.41 | 2.34 |
| Current Ratio | 1.04 | 1.34 |
| Quick Ratio | 0.96 | 1.34 |
| D/E (Debt-to-Equity) | 1.27 | 2.12 |
| Debt-to-Assets | 39.4% | 47.3% |
| Interest Coverage | 2.30 | 2.19 |
| Asset Turnover | 0.22 | 0.21 |
| Fixed Asset Turnover | 0.29 | 0.28 |
| Payout ratio | 60.4% | 60.5% |
| Dividend yield | 3.56% | 3.10% |
| Fiscal Year | 2024 | 2025 |
Efficiency & Valuation Duel: The Vital Signs
Financial ratios serve as a company’s DNA, uncovering hidden risks and operational strengths that numbers alone can’t reveal.
Consolidated Edison, Inc.
Consolidated Edison posts a modest 8.3% ROE and a net margin near 12%, signaling moderate profitability. The P/E ratio at 17 appears fairly valued, neither cheap nor stretched. The firm rewards shareholders with a 3.56% dividend yield, reflecting a stable income focus rather than aggressive growth reinvestment.
CMS Energy Corporation
CMS Energy delivers a stronger 12% ROE and a slightly higher net margin of 12.5%, indicating better core profitability. Its P/E ratio of 19.5 suggests a premium valuation. The company maintains a 3.1% dividend yield, balancing shareholder payouts with prudent financial management amid elevated debt levels.
Premium Valuation vs. Operational Stability
CMS shows higher profitability and a firmer market premium, while Consolidated Edison offers steadier dividend income with more conservative valuation metrics. Investors seeking growth with some yield may prefer CMS. Those prioritizing income and risk mitigation might find Consolidated Edison more fitting.
Which one offers the Superior Shareholder Reward?
I compare Consolidated Edison (ED) and CMS Energy (CMS) on dividends, payout ratios, and buybacks to identify the better shareholder return in 2026. ED yields 3.56% with a high payout ratio near 60%, but free cash flow per share remains negative, signaling sustainability risks. CMS yields slightly lower at 3.10%, with a similar payout ratio but positive free cash flow of 7.5/share, supporting dividends and buybacks. ED’s buyback intensity appears limited given weak free cash flow, whereas CMS’s robust operating cash flow backs stronger buybacks. I see CMS’s distribution model as more sustainable and better aligned with long-term value. For 2026, CMS offers the superior total return profile, balancing yield and capital return with healthier cash flow coverage.
Comparative Score Analysis: The Strategic Profile
The radar chart reveals the fundamental DNA and trade-offs of Consolidated Edison and CMS Energy Corporation, highlighting their financial strengths and vulnerabilities:
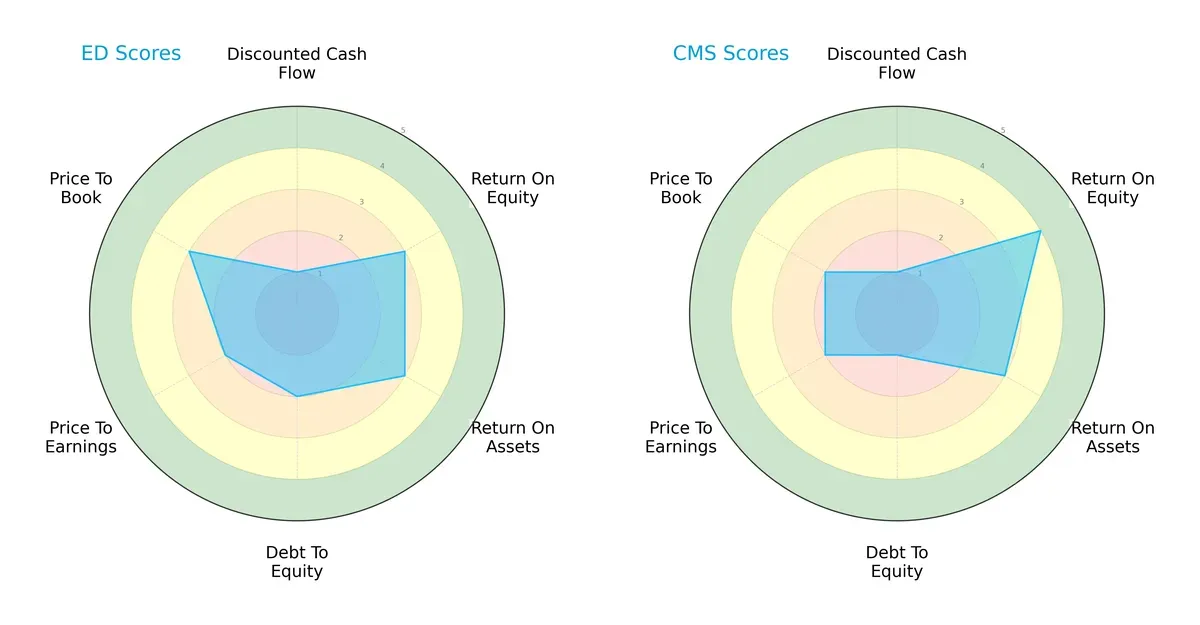
Consolidated Edison (ED) shows a more balanced profile, with moderate ROE (3) and ROA (3) scores and moderate price-to-book valuation (3). CMS Energy (CMS) excels in ROE (4) but suffers from a weaker debt-to-equity score (1), indicating higher financial risk. Both firms struggle with discounted cash flow (1) and price-to-earnings (2), but ED maintains a slightly stronger debt profile than CMS.
Bankruptcy Risk: Solvency Showdown
The Altman Z-Scores place both companies in the distress zone, signaling elevated bankruptcy risk in this cycle:
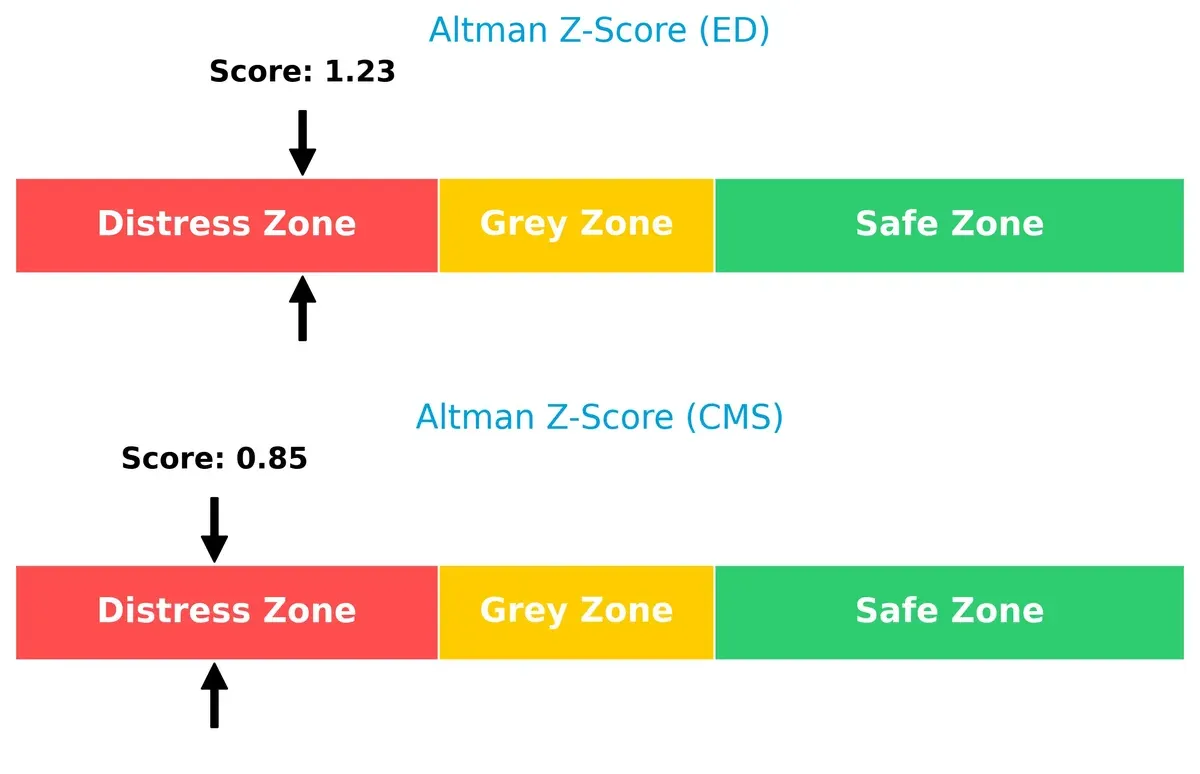
Consolidated Edison scores 1.23 while CMS scores lower at 0.85, implying ED has a marginally better solvency cushion. Historically, firms in this zone demand caution, as financial stress can escalate quickly without robust capital buffers.
Financial Health: Quality of Operations
Both firms share a strong Piotroski F-Score of 7, indicating solid internal financial health and operational quality:
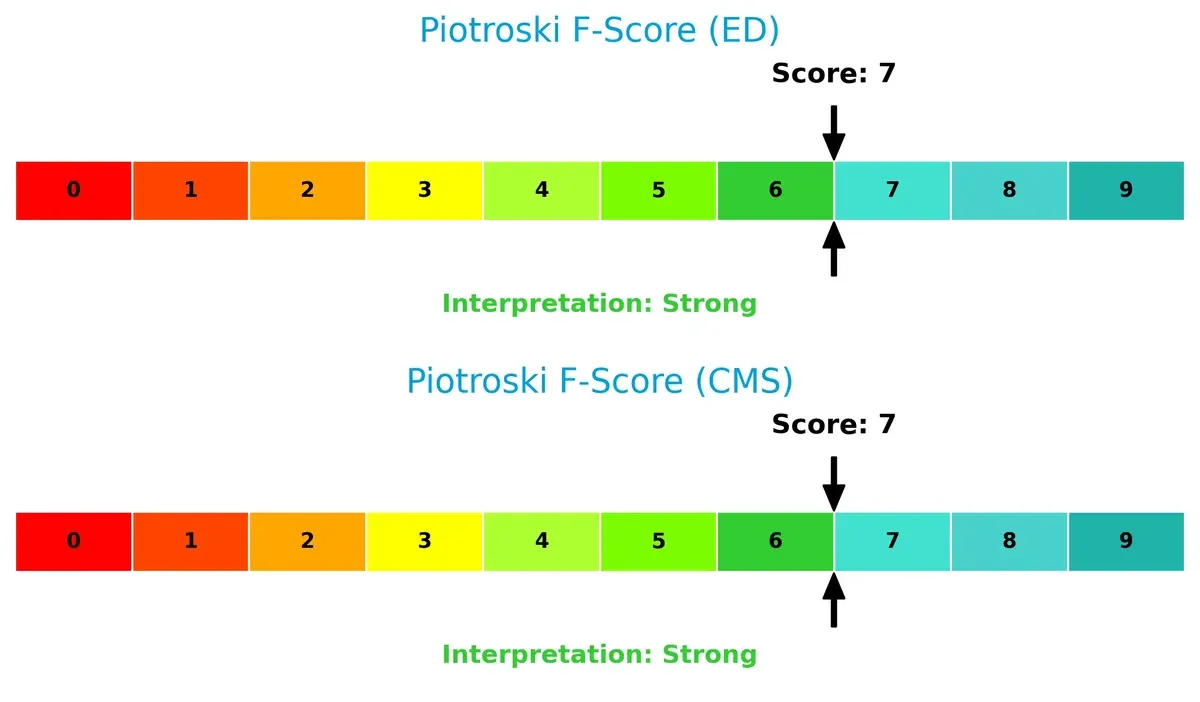
A score of 7 suggests both companies maintain effective profitability, leverage, and liquidity metrics. Neither shows immediate red flags internally, but with their Altman Z-Scores, investors must weigh operational strength against balance sheet risk carefully.
How are the two companies positioned?
This section dissects the operational DNA of ED and CMS by comparing their revenue distribution and internal dynamics. The ultimate goal is to confront their economic moats to identify the most resilient, sustainable competitive advantage today.
Revenue Segmentation: The Strategic Mix
The following visual comparison dissects how Consolidated Edison and CMS Energy diversify their income streams and where their primary sector bets lie:
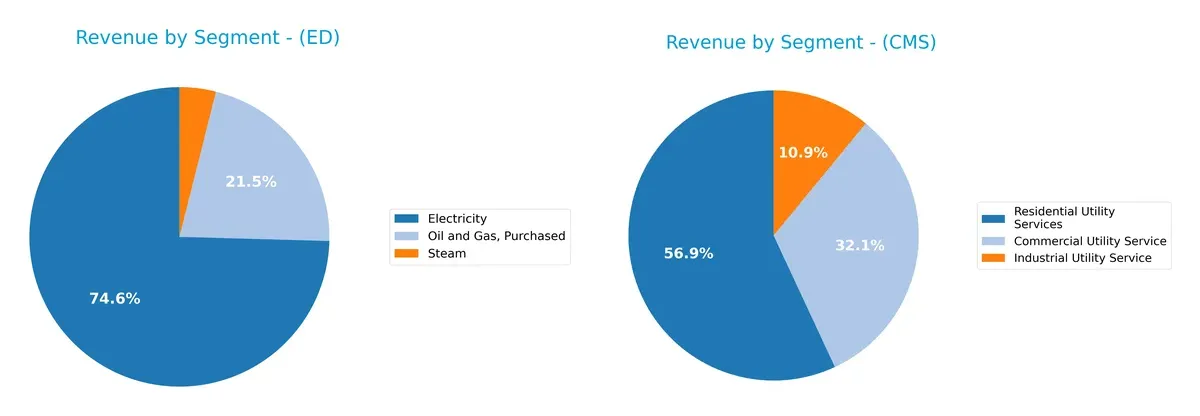
Consolidated Edison anchors its revenue with $10.8B from Electricity, complemented by $3.1B in Oil and Gas, Purchased, showing moderate diversification. CMS Energy pivots more heavily on Residential Utility Services at $3.7B, with Commercial and Industrial Utility Services adding $2.1B and $720M respectively. ED’s broader energy mix reduces concentration risk, while CMS’s residential focus suggests strength in consumer markets but higher exposure to that segment’s cyclical shifts.
Strengths and Weaknesses Comparison
This table compares the strengths and weaknesses of Consolidated Edison, Inc. and CMS Energy Corporation:
Consolidated Edison, Inc. Strengths
- Favorable net margin at 11.93%
- Favorable WACC at 4.79%
- Favorable PB ratio at 1.41
- Dividend yield of 3.56% supports income investors
CMS Energy Corporation Strengths
- Higher net margin at 12.54%
- Favorable WACC at 5.02%
- Favorable quick ratio at 1.34
- Dividend yield of 3.10% adds shareholder value
Consolidated Edison, Inc. Weaknesses
- Unfavorable ROE at 8.29%
- Unfavorable ROIC at 3.48% below WACC
- High debt-to-equity at 1.27
- Low asset and fixed asset turnover ratios
CMS Energy Corporation Weaknesses
- Unfavorable ROIC at 3.71% below WACC
- Even higher debt-to-equity at 2.12
- Low asset and fixed asset turnover ratios
- Neutral PB ratio at 2.34 limits valuation upside
Overall, both companies show solid profitability and cost of capital management but face challenges with capital efficiency and leverage. Consolidated Edison’s lower ROE and asset turnover indicate operational constraints compared to CMS. CMS carries heavier debt, which could pressure financial flexibility. Both must carefully manage capital to sustain competitive positioning.
The Moat Duel: Analyzing Competitive Defensibility
A structural moat alone protects long-term profits from competition’s relentless erosion. Let’s dissect how these utilities defend their turf:
Consolidated Edison, Inc.: Infrastructure Dominance with Regulatory Shelter
ConEd’s moat stems from its regulated electric and gas delivery monopoly in dense urban markets. This yields stable margins and cash flows, yet declining ROIC signals rising cost pressures. Expansion into renewable projects may bolster resilience but risks remain in regulatory shifts by 2026.
CMS Energy Corporation: Diversified Utility Footprint with Generation Assets
CMS leverages a broad energy mix and a large customer base in Michigan, contrasting with ConEd’s urban focus. Its slightly stronger EBIT margin and revenue growth reveal operational strides, but declining ROIC warns of margin compression. Growth in renewables and storage offers upside amid evolving market demands.
Infrastructure Control vs. Asset Diversification: Who Holds the Moat Edge?
Both firms face shrinking ROIC, signaling weakening moats. ConEd’s entrenched urban infrastructure offers a deeper moat but faces regulatory risks. CMS’s asset diversification provides flexibility but less urban monopoly power. I see ConEd better positioned to defend its market share despite challenges.
Which stock offers better returns?
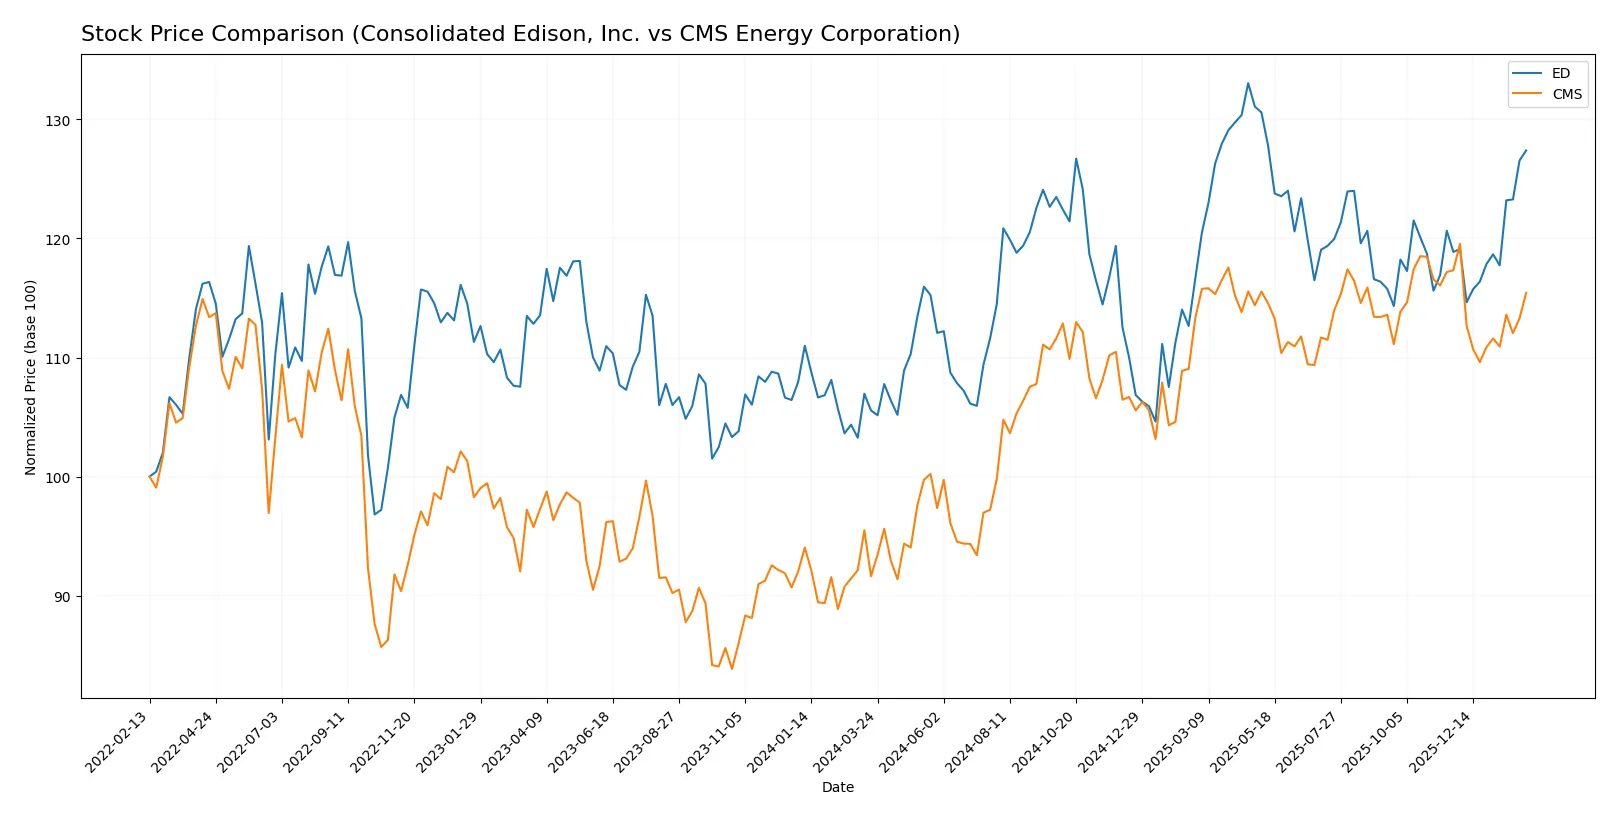
The past year shows distinct price shifts and trading dynamics for Consolidated Edison, Inc. and CMS Energy Corporation, with both exhibiting bullish trends but differing recent momentum profiles.
Trend Comparison
Consolidated Edison, Inc. (ED) posted a 20.69% price gain over 12 months, marked by bullish acceleration and a high-low range of 88.15 to 112.1. Recent months show continued upward momentum (+7.17%).
CMS Energy Corporation (CMS) achieved a 25.98% gain over the same period, also bullish but with decelerating growth. Its price ranged from 57.66 to 75.44, though recent weeks reflect a slight downward trend (-1.62%).
CMS outperformed ED in total yearly returns but shows weaker recent momentum. ED maintains accelerating bullish strength while CMS experiences a recent softening.
Target Prices
Analysts present a mixed but constructive target consensus for Consolidated Edison, Inc. and CMS Energy Corporation.
| Company | Target Low | Target High | Consensus |
|---|---|---|---|
| Consolidated Edison, Inc. | 86 | 166 | 110.63 |
| CMS Energy Corporation | 74 | 82 | 78.14 |
Consolidated Edison’s consensus target of 110.63 slightly exceeds its current price of 107.34, signaling moderate upside potential. CMS’s consensus target of 78.14 stands notably above its current price of 72.84, suggesting stronger analyst optimism.

Don’t Let Luck Decide Your Entry Point
Optimize your entry points with our advanced ProRealTime indicators. You’ll get efficient buy signals with precise price targets for maximum performance. Start outperforming now!
How do institutions grade them?
Consolidated Edison, Inc. Grades
The table below summarizes recent grades from major institutions for Consolidated Edison, Inc.
| Grading Company | Action | New Grade | Date |
|---|---|---|---|
| UBS | Maintain | Neutral | 2026-01-23 |
| Barclays | Maintain | Underweight | 2026-01-22 |
| Wells Fargo | Maintain | Equal Weight | 2026-01-20 |
| UBS | Maintain | Neutral | 2026-01-07 |
| UBS | Maintain | Neutral | 2025-12-17 |
| Keybanc | Maintain | Underweight | 2025-12-12 |
| JP Morgan | Maintain | Underweight | 2025-12-12 |
| Barclays | Maintain | Underweight | 2025-11-10 |
| Barclays | Maintain | Underweight | 2025-10-22 |
| Morgan Stanley | Maintain | Underweight | 2025-10-22 |
CMS Energy Corporation Grades
The following table shows recent grades from recognized institutions for CMS Energy Corporation.
| Grading Company | Action | New Grade | Date |
|---|---|---|---|
| Mizuho | Maintain | Neutral | 2026-02-06 |
| Morgan Stanley | Maintain | Equal Weight | 2026-02-02 |
| Jefferies | Maintain | Buy | 2026-01-28 |
| Wells Fargo | Maintain | Equal Weight | 2026-01-20 |
| JP Morgan | Maintain | Overweight | 2026-01-15 |
| Jefferies | Maintain | Buy | 2026-01-15 |
| Barclays | Maintain | Overweight | 2026-01-15 |
| UBS | Maintain | Neutral | 2025-12-17 |
| JP Morgan | Maintain | Overweight | 2025-12-11 |
| Morgan Stanley | Maintain | Equal Weight | 2025-10-22 |
Which company has the best grades?
CMS Energy Corporation consistently receives stronger grades, including multiple Buy and Overweight ratings. Consolidated Edison, Inc. mostly holds Neutral or Underweight grades. CMS’s favorable ratings could influence investor sentiment positively.
Risks specific to each company
In today’s volatile 2026 market environment, these risk categories reveal the critical pressure points and systemic threats facing Consolidated Edison, Inc. and CMS Energy Corporation:
1. Market & Competition
Consolidated Edison, Inc.
- Operates in a dense, mature NY metro market with limited expansion; faces competition from renewables and energy tech disruptors.
CMS Energy Corporation
- Serves Michigan with a diversified generation mix but faces pressure from regulatory shifts favoring renewables and energy efficiency.
2. Capital Structure & Debt
Consolidated Edison, Inc.
- Debt-to-equity ratio at 1.27 signals elevated leverage; interest coverage at 2.8 is adequate but not robust.
CMS Energy Corporation
- Higher leverage with debt-to-equity at 2.12; interest coverage tight at 2.58, raising concerns about financial flexibility.
3. Stock Volatility
Consolidated Edison, Inc.
- Low beta of 0.388 indicates defensive, stable stock behavior, typical of regulated utilities.
CMS Energy Corporation
- Slightly higher beta at 0.481 reflects moderate sensitivity to market swings, still relatively stable.
4. Regulatory & Legal
Consolidated Edison, Inc.
- Heavy reliance on New York regulatory environment risks policy shifts; infrastructure upgrades require regulatory approvals.
CMS Energy Corporation
- Michigan’s evolving energy policies create regulatory uncertainty; clean energy mandates increase compliance costs.
5. Supply Chain & Operations
Consolidated Edison, Inc.
- Extensive infrastructure in dense urban areas creates operational complexity and vulnerability to physical disruptions.
CMS Energy Corporation
- Broad geographic footprint with mixed energy sources demands complex supply chain management; risks from fuel price volatility.
6. ESG & Climate Transition
Consolidated Edison, Inc.
- Investing in renewables and transmission projects but must accelerate climate transition to meet NY targets.
CMS Energy Corporation
- Diverse generation mix includes coal and nuclear; transition to cleaner energy is slower, posing ESG risks.
7. Geopolitical Exposure
Consolidated Edison, Inc.
- Primarily domestic U.S. exposure limits geopolitical risks; local economic conditions impact demand.
CMS Energy Corporation
- Also domestic-focused; regional economic shifts and regulatory changes in Michigan pose main external risks.
Which company shows a better risk-adjusted profile?
Consolidated Edison’s most impactful risk lies in its elevated leverage and regulatory dependence in a high-cost metro market. CMS Energy faces greater financial risk due to heavier debt and slower energy transition but benefits from a more diversified generation portfolio. CMS’s higher leverage and distress-level Altman Z-score raise red flags. Both companies share distress zone bankruptcy risk, but Consolidated Edison’s lower debt load and more stable stock volatility give it a better risk-adjusted profile amid 2026 uncertainties.
Final Verdict: Which stock to choose?
Consolidated Edison, Inc. (ED) stands out for its resilient cash generation and steady dividend yield, making it a dependable income source. However, its declining ROIC versus WACC signals operational challenges ahead—a point of vigilance. ED suits investors seeking stable, income-oriented portfolios with a tolerance for moderate growth risks.
CMS Energy Corporation (CMS) leverages a strategic moat through robust operating margins and a healthier current ratio, offering greater liquidity safety than ED. Despite higher leverage, CMS delivers better recent earnings growth, fitting well within GARP portfolios aiming for balanced growth and reasonable valuation.
If you prioritize income stability and a tested cash machine, ED is the compelling choice due to its consistent dividends and market presence. However, if you seek growth with a margin of safety and stronger operating efficiency, CMS offers better stability and upside potential despite recent volatility. Both present value-destructive moats, so cautious monitoring is advised.
Disclaimer: Investment carries a risk of loss of initial capital. The past performance is not a reliable indicator of future results. Be sure to understand risks before making an investment decision.
Go Further
I encourage you to read the complete analyses of Consolidated Edison, Inc. and CMS Energy Corporation to enhance your investment decisions: