Home > Comparison > Financial Services > SPGI vs CME
The strategic rivalry between S&P Global Inc. and CME Group Inc. shapes the future of the global financial data and exchange landscape. S&P Global operates as a diversified analytics and credit ratings powerhouse, while CME Group focuses on futures and options trading with robust clearing services. This head-to-head frames a contest between comprehensive data solutions and specialized market infrastructure. This analysis will identify which trajectory offers superior risk-adjusted returns for a diversified portfolio.
Table of contents
Companies Overview
S&P Global Inc. and CME Group Inc. dominate critical niches within the financial data and exchange landscape.
S&P Global Inc.: Leading Provider of Credit Ratings and Analytics
S&P Global Inc. stands as a market leader in credit ratings, benchmarks, and analytics. Its core revenue derives from six divisions, including S&P Global Ratings and S&P Dow Jones Indices, which supply essential data and workflow solutions globally. In 2026, the company focuses on expanding its data-driven insights across commodities, mobility, and engineering sectors to deepen client engagement.
CME Group Inc.: Premier Futures and Options Exchange Operator
CME Group Inc. dominates the futures and options market through its global contract exchanges. Its business generates revenue by offering trading, clearing, and risk mitigation services across interest rates, commodities, and equity indexes. In 2026, CME emphasizes enhancing its market data services and clearinghouse capabilities to support institutional and retail traders worldwide.
Strategic Collision: Similarities & Divergences
Both firms operate in financial data and exchange services but diverge sharply: S&P Global offers diversified analytics and credit ratings, while CME focuses on derivatives trading and clearing. Their primary battleground is the provision of actionable market intelligence to institutional clients. Investors encounter distinct risk profiles—S&P Global’s broad data ecosystem contrasts with CME’s concentrated exposure to market volatility and trading volumes.
Income Statement Comparison
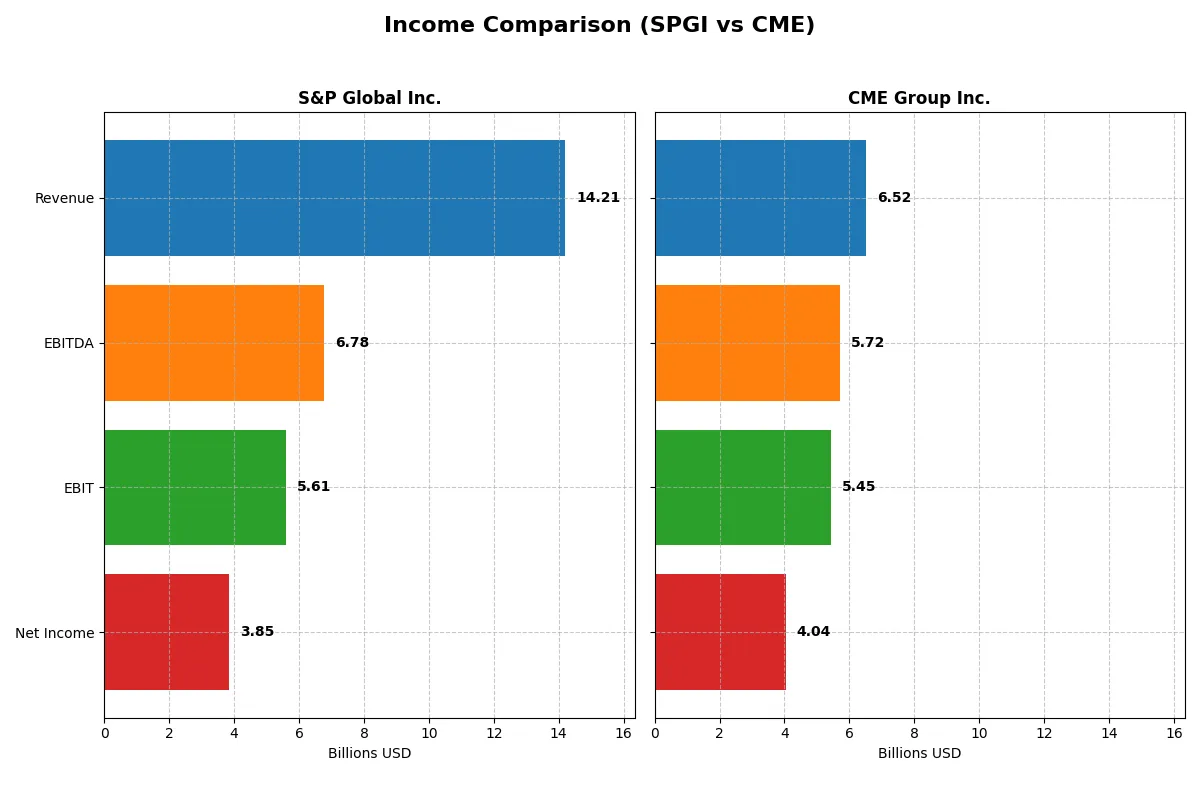
This comparison dissects the core profitability and scalability of both corporate engines to reveal who dominates the bottom line:
| Metric | S&P Global Inc. (SPGI) | CME Group Inc. (CME) |
|---|---|---|
| Revenue | 14.2B | 6.5B |
| Cost of Revenue | 4.4B | 907M |
| Operating Expenses | 4.2B | 1.4B |
| Gross Profit | 9.8B | 5.6B |
| EBITDA | 6.8B | 5.7B |
| EBIT | 5.6B | 5.4B |
| Interest Expense | 297M | 130M |
| Net Income | 3.9B | 4.0B |
| EPS | 12.36 | 11.18 |
| Fiscal Year | 2024 | 2025 |
Income Statement Analysis: The Bottom-Line Duel
This income statement comparison reveals the true operational efficiency and profitability traction of two major financial services firms.
S&P Global Inc. Analysis
S&P Global’s revenue surged from 7.4B in 2020 to 14.2B in 2024, nearly doubling in five years. Net income tracked upward from 2.3B to 3.9B, showing solid earnings growth. The firm sustains a strong gross margin near 69% and a net margin of 27%, reflecting healthy cost control and expanding profitability. Its latest year highlights a 14% revenue rise and a 29% net margin improvement, signaling momentum and operational leverage.
CME Group Inc. Analysis
CME’s revenue grew steadily from 4.7B in 2021 to 6.5B in 2025, a more moderate pace. Net income increased from 2.6B to 4.0B over five years, with a robust net margin jumping to 62% in 2025. The firm posts an exceptional gross margin above 86% and an EBIT margin exceeding 83%, demonstrating remarkable cost efficiency. The latest year shows moderate revenue growth but strong margin expansion, underscoring CME’s high profitability and capital-light model.
Margin Mastery vs. Revenue Momentum
S&P Global delivers faster revenue growth and solid earnings gains, driven by expanding scale and improving margins. CME Group commands superior profitability with best-in-class margins and steady net income advances. Based purely on efficiency and margin strength, CME leads as the fundamental winner. Investors prioritizing high margin resilience will find CME’s profile more attractive, while those valuing growth may lean toward S&P Global’s momentum.
Financial Ratios Comparison
These vital ratios act as a diagnostic tool to expose the underlying fiscal health, valuation premiums, and capital efficiency of the companies compared below:
| Ratios | S&P Global Inc. (SPGI) | CME Group Inc. (CME) |
|---|---|---|
| ROE | 11.6% (2024) | 14.1% (2025) |
| ROIC | 8.1% (2024) | -2.0% (2025) |
| P/E | 40.3 (2024) | 24.3 (2025) |
| P/B | 4.68 (2024) | 3.42 (2025) |
| Current Ratio | 0.85 (2024) | 0 (2025) |
| Quick Ratio | 0.85 (2024) | 0 (2025) |
| D/E | 0.36 (2024) | 0.12 (2025) |
| Debt-to-Assets | 19.8% (2024) | 1.7% (2025) |
| Interest Coverage | 18.8 (2024) | 32.6 (2025) |
| Asset Turnover | 0.24 (2024) | 0.03 (2025) |
| Fixed Asset Turnover | 21.0 (2024) | 18.0 (2025) |
| Payout ratio | 29.4% (2024) | 44.5% (2025) |
| Dividend yield | 0.73% (2024) | 1.83% (2025) |
| Fiscal Year | 2024 | 2025 |
Efficiency & Valuation Duel: The Vital Signs
Financial ratios act as a company’s DNA, exposing hidden risks and operational strengths crucial for investment decisions.
S&P Global Inc.
S&P Global shows solid profitability with a 27.11% net margin and 11.62% ROE, signaling operational strength. However, its valuation appears stretched, with a high P/E of 40.29 and P/B of 4.68. The company returns modest dividends at 0.73%, favoring reinvestment into growth areas over large payouts.
CME Group Inc.
CME Group delivers an impressive 62.02% net margin and a decent 14.08% ROE, combining efficiency with profitability. Its P/E ratio at 24.28 is more reasonable, though P/B at 3.42 flags some valuation caution. CME balances shareholder returns with a 1.83% dividend yield and maintains strong interest coverage and low debt levels.
Premium Valuation vs. Operational Safety
S&P Global trades at a premium with solid but moderate returns, while CME offers higher margins and safer debt metrics at a more attractive valuation. CME better balances risk and reward, suiting investors seeking income and operational resilience over growth-focused premium pricing.
Which one offers the Superior Shareholder Reward?
I compare S&P Global Inc. (SPGI) and CME Group Inc. (CME) by their distribution philosophies and shareholder returns in 2026. SPGI pays a modest dividend yield of 0.73% with a sustainable payout ratio near 29%. It backs dividends with strong free cash flow coverage at 4.5x. Its buyback program is active, enhancing capital return. CME offers a higher dividend yield of 1.83%, but with a payout ratio exceeding 100% in recent years, signaling potential risk. CME’s buybacks are less transparent but dividends remain a core return driver. Historically, SPGI’s balanced mix of dividends and disciplined buybacks, underpinned by robust cash flow margins, offers a more sustainable total return profile. I favor SPGI for superior long-term shareholder reward in 2026.
Comparative Score Analysis: The Strategic Profile
The radar chart reveals the fundamental DNA and trade-offs of S&P Global Inc. and CME Group Inc., highlighting their strengths and weaknesses across key financial metrics:
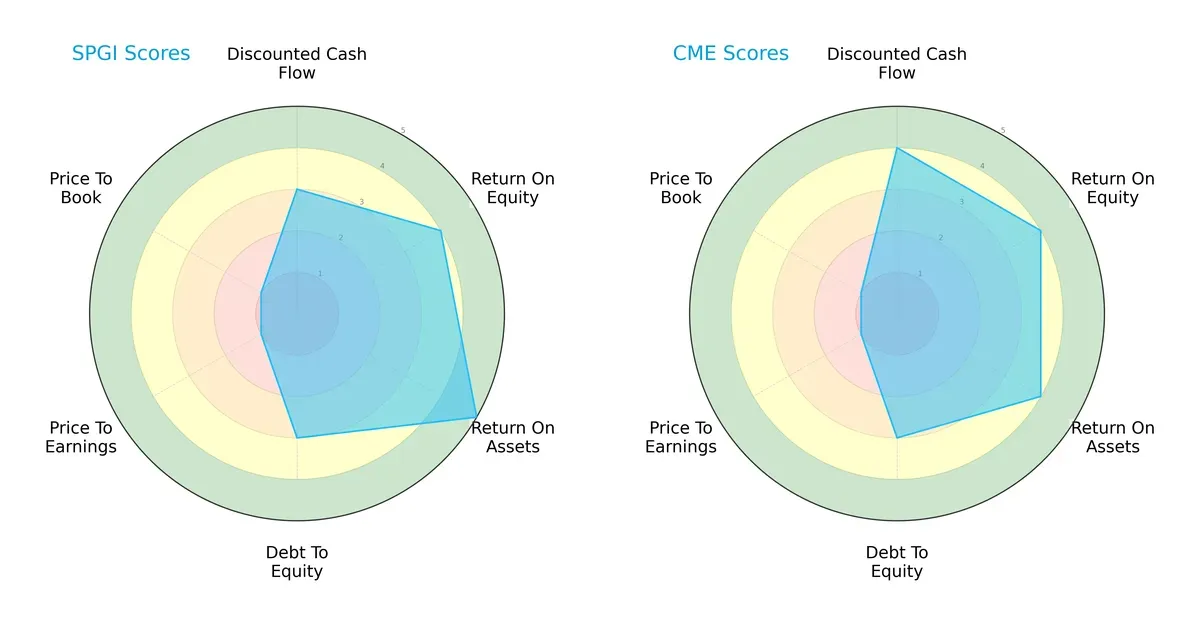
S&P Global shows superior asset efficiency with a ROA score of 5, whereas CME delivers a stronger discounted cash flow score at 4. Both firms share solid ROE scores at 4 and moderate debt management with a 3 in debt-to-equity. However, both struggle with valuation, scoring a low 1 in P/E and P/B, indicating potential overvaluation risks. S&P Global’s profile is more asset-driven, while CME leans on cash flow strength, making S&P more balanced in operational efficiency.
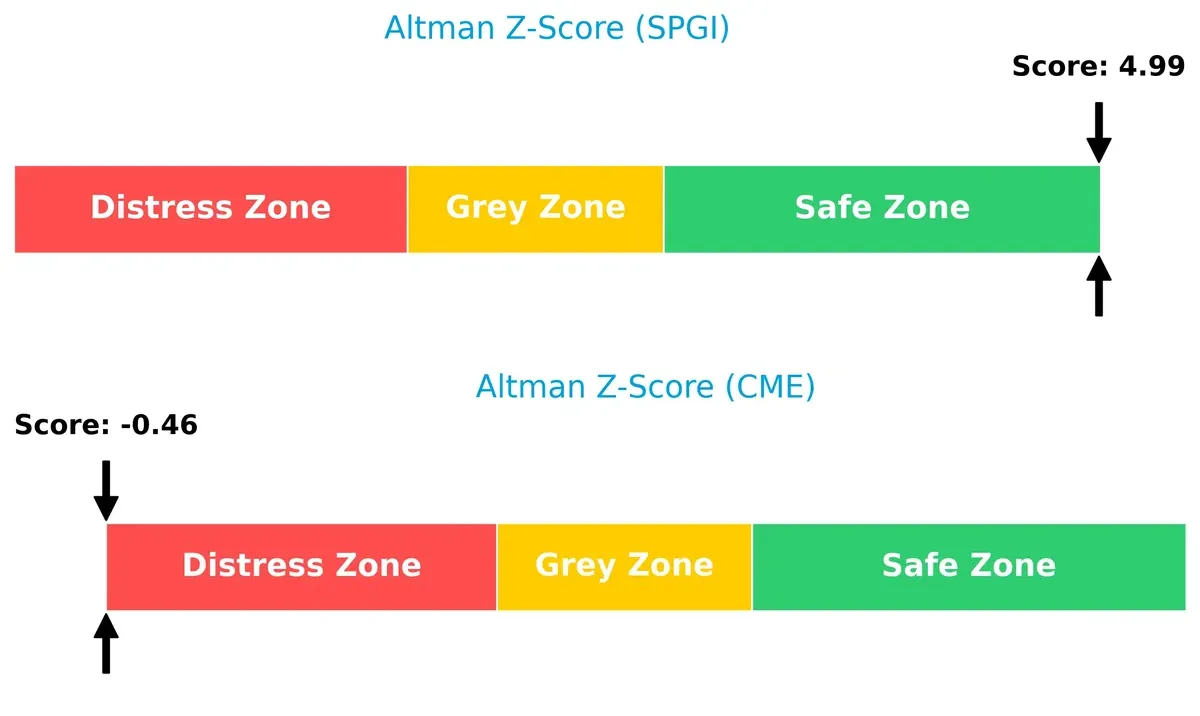
Bankruptcy Risk: Solvency Showdown
S&P Global’s Altman Z-Score of 4.99 places it firmly in the safe zone, signaling robust long-term survival prospects. CME’s negative score of -0.46 signals distress and heightened bankruptcy risk in this economic cycle:
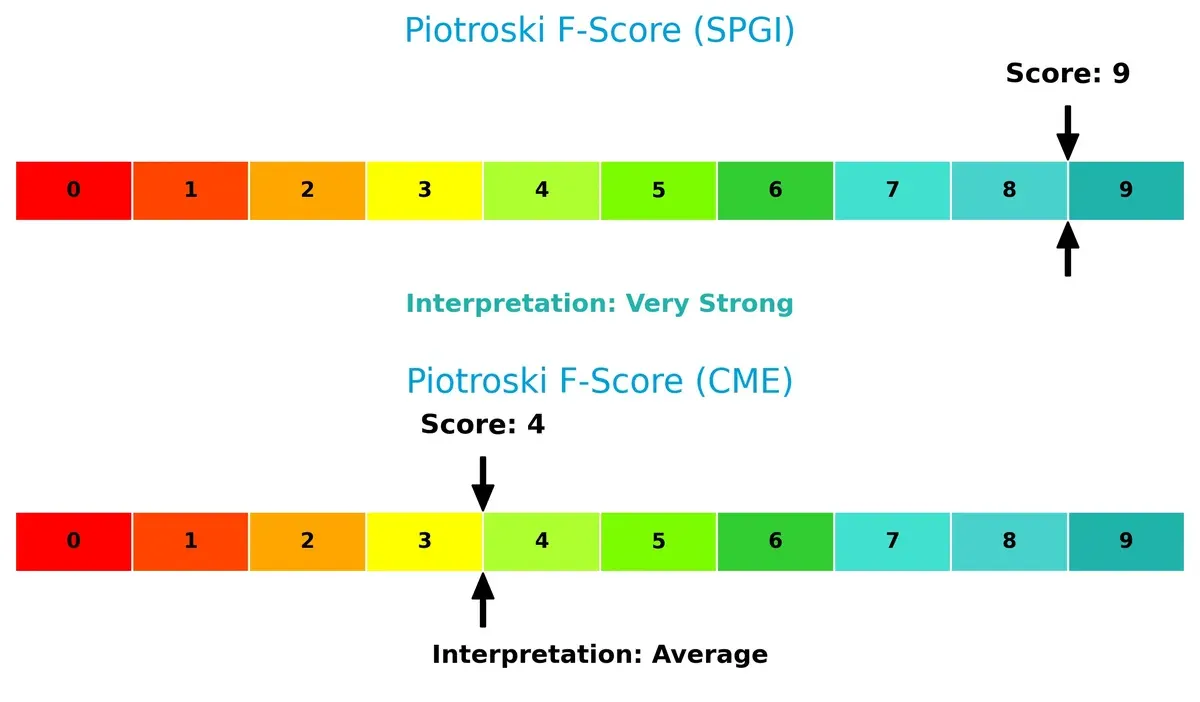
Financial Health: Quality of Operations
S&P Global’s Piotroski F-Score of 9 signals peak financial health with no internal red flags. CME’s score of 4 is average, raising caution about operational weaknesses and potential financial stress:
How are the two companies positioned?
This section dissects the operational DNA of S&P Global and CME Group by comparing their revenue distribution by segment and internal dynamics. The goal is to confront their economic moats to identify which business model offers the most resilient, sustainable advantage in today’s market.
Revenue Segmentation: The Strategic Mix
This visual comparison dissects how S&P Global Inc. and CME Group Inc. diversify their income streams and where their primary sector bets lie:
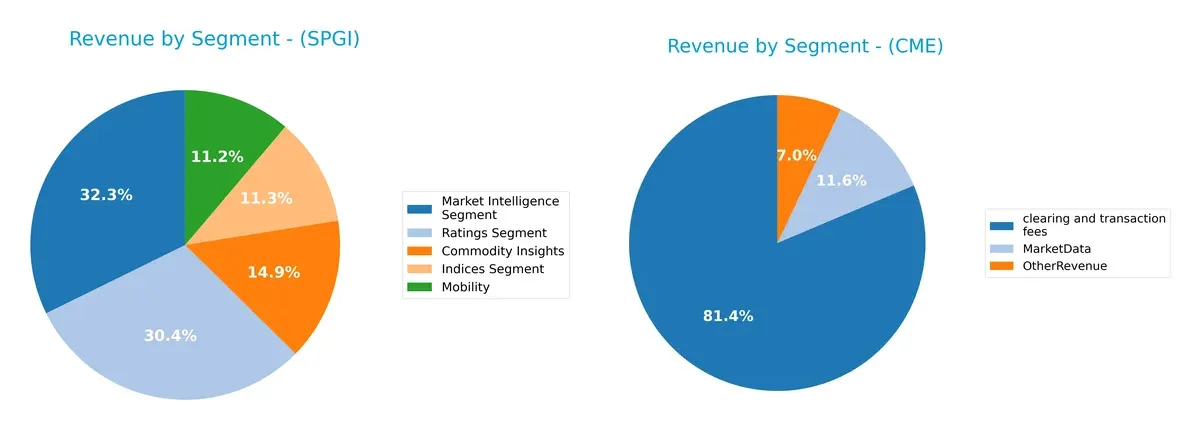
S&P Global Inc. boasts a more diversified revenue base with significant contributions from Market Intelligence ($4.65B), Ratings ($4.37B), and Commodity Insights ($2.14B). In contrast, CME Group Inc. heavily anchors its revenue in clearing and transaction fees, at $4.99B, dwarfing its Market Data ($710M) and Other Revenue ($432M). S&P’s mix reduces concentration risk, while CME’s dominance in clearing underlines its infrastructure moat but exposes it to regulatory shifts.
Strengths and Weaknesses Comparison
This table compares the strengths and weaknesses of S&P Global Inc. and CME Group Inc.:
S&P Global Inc. Strengths
- Diverse revenue streams across indices, ratings, market intelligence, and commodities
- Strong U.S. and European market presence
- Favorable net margin at 27.11%
- Low debt-to-assets ratio at 19.82%
- High interest coverage ratio of 18.87
CME Group Inc. Strengths
- Exceptional net margin at 62.02%
- Very low debt-to-assets ratio at 1.72%
- Strong interest coverage ratio at 41.98
- Favorable WACC at 5.02%
- Dominant revenue from clearing and transaction fees totaling 4.99B
S&P Global Inc. Weaknesses
- Unfavorable current ratio at 0.85 signals liquidity concerns
- High P/E ratio at 40.29 may indicate overvaluation
- Asset turnover low at 0.24
- Dividend yield low at 0.73%
- Neutral ROIC below WACC at 8.14% vs. 8.89%
CME Group Inc. Weaknesses
- Negative ROIC at -2.01% shows inefficient capital use
- Zero current and quick ratios raise liquidity red flags
- Unfavorable asset turnover at 0.03
- Unfavorable P/B ratio at 3.42
- Dividend yield moderate at 1.83% but no global revenue diversification data
Both companies exhibit strong profitability and solid capital structures, with SPGI showing broader geographic and segment diversification. CME Group excels in margin and interest coverage but faces challenges in capital efficiency and liquidity ratios. These factors shape their strategic priorities differently in 2026.
The Moat Duel: Analyzing Competitive Defensibility
A structural moat is the only reliable shield protecting long-term profits from relentless competition erosion. Let’s dissect the core moats of two giants:
S&P Global Inc.: Intangible Assets Powerhouse
S&P Global leverages its vast intangible assets—trusted credit ratings and proprietary indices—to sustain high margins and ROIC. Yet, its declining ROIC warns of mounting competitive pressures in 2026.
CME Group Inc.: Market Infrastructure Stronghold
CME’s moat centers on its unrivaled futures exchange network and clearing services. Despite a similar ROIC decline, CME’s dominant market infrastructure keeps it resilient against rivals and primes it for future growth.
Intangible Assets vs. Market Infrastructure: The Moat Showdown
Both firms face shrinking ROICs, signaling value destruction. However, S&P’s intangible asset moat is broader, while CME’s infrastructure moat is deeper. I see S&P better positioned to defend market share long term.
Which stock offers better returns?
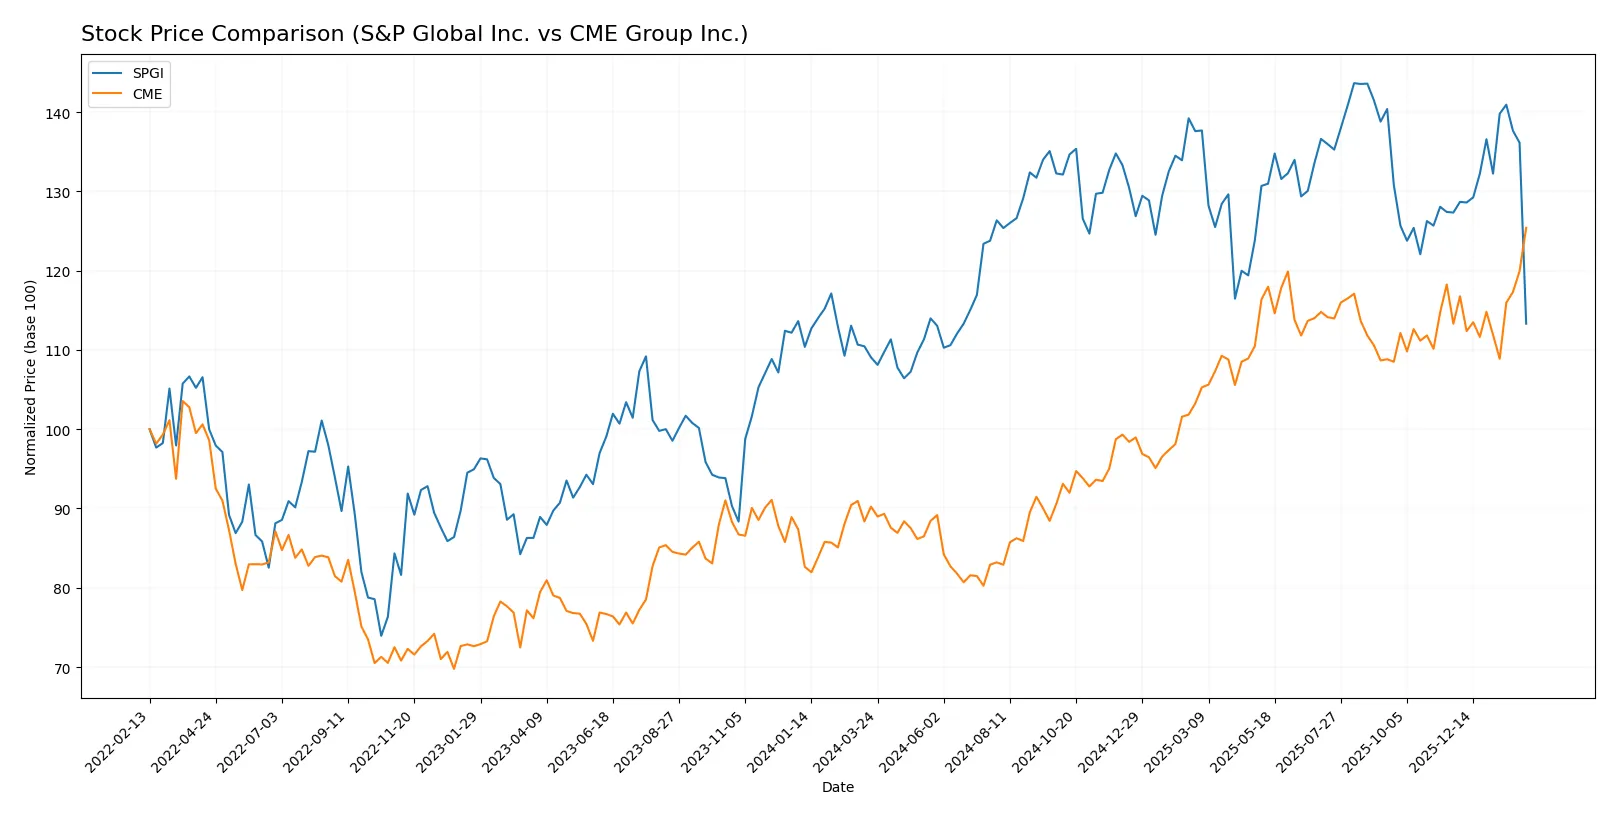
The past year reveals contrasting price dynamics: S&P Global Inc. shows moderate gains with recent weakness, while CME Group Inc. delivers strong growth and accelerating momentum. Trading volumes rise for both.
Trend Comparison
S&P Global Inc. posts a 3.9% price increase over the past 12 months, indicating a bullish but decelerating trend. The stock fluctuated between 413 and 557, with recent months showing an 11% decline.
CME Group Inc. outperforms with a 39% gain over the same period. Its bullish trend accelerates, supported by a tighter volatility range and a recent 10.7% price rise. Prices ranged from 193 to 302.
CME Group Inc. delivers the highest market performance, combining strong growth and acceleration, while S&P Global Inc. shows modest gains with recent downward pressure.
Target Prices
Analyst consensus points to solid upside potential across these leading financial data firms.
| Company | Target Low | Target High | Consensus |
|---|---|---|---|
| S&P Global Inc. | 540 | 643 | 605 |
| CME Group Inc. | 300 | 340 | 312 |
S&P Global’s target consensus at 605 significantly exceeds its current 439 price, suggesting strong growth expectations. CME Group’s 312 consensus also surpasses the present 302 share price, indicating modest upside potential.

Don’t Let Luck Decide Your Entry Point
Optimize your entry points with our advanced ProRealTime indicators. You’ll get efficient buy signals with precise price targets for maximum performance. Start outperforming now!
How do institutions grade them?
The following tables summarize recent institutional grades for S&P Global Inc. and CME Group Inc.:
S&P Global Inc. Grades
This table lists recent analyst grades from major financial institutions for S&P Global Inc.
| Grading Company | Action | New Grade | Date |
|---|---|---|---|
| Morgan Stanley | Maintain | Overweight | 2026-01-13 |
| Evercore ISI Group | Maintain | Outperform | 2026-01-08 |
| JP Morgan | Maintain | Overweight | 2025-10-31 |
| Stifel | Maintain | Buy | 2025-10-31 |
| Evercore ISI Group | Maintain | Outperform | 2025-10-31 |
| BMO Capital | Maintain | Outperform | 2025-10-16 |
| Mizuho | Maintain | Outperform | 2025-10-16 |
| Evercore ISI Group | Maintain | Outperform | 2025-10-14 |
| Morgan Stanley | Maintain | Overweight | 2025-10-09 |
| Wells Fargo | Maintain | Overweight | 2025-09-19 |
CME Group Inc. Grades
This table lists recent analyst grades from recognized firms for CME Group Inc.
| Grading Company | Action | New Grade | Date |
|---|---|---|---|
| TD Cowen | Maintain | Buy | 2026-02-05 |
| Morgan Stanley | Maintain | Overweight | 2026-02-05 |
| Barclays | Maintain | Equal Weight | 2026-02-05 |
| JP Morgan | Maintain | Underweight | 2026-02-05 |
| RBC Capital | Maintain | Sector Perform | 2026-02-05 |
| Morgan Stanley | Maintain | Overweight | 2026-01-15 |
| TD Cowen | Upgrade | Buy | 2026-01-14 |
| Morgan Stanley | Maintain | Overweight | 2025-12-22 |
| Barclays | Maintain | Equal Weight | 2025-12-12 |
| Piper Sandler | Maintain | Overweight | 2025-11-13 |
Which company has the best grades?
S&P Global holds consistently higher ratings, predominantly “Outperform” and “Overweight,” versus CME’s mixed “Buy,” “Equal Weight,” and “Underweight” grades. This suggests stronger analyst confidence in S&P Global, likely influencing investor sentiment more positively.
Risks specific to each company
In 2026, these categories highlight critical pressure points and systemic threats facing S&P Global Inc. and CME Group Inc. in today’s market environment:
1. Market & Competition
S&P Global Inc.
- Faces intense competition in data analytics and ratings, with pressure from fintech disruptors.
CME Group Inc.
- Operates in a niche futures and options market, but increasing competition from alternative trading platforms.
2. Capital Structure & Debt
S&P Global Inc.
- Moderate leverage with debt/equity at 0.36, interest coverage strong at 18.87x.
CME Group Inc.
- Lower debt/equity at 0.12, exceptional interest coverage at 41.98x, signaling conservative capital structure.
3. Stock Volatility
S&P Global Inc.
- Beta of 1.20 indicates higher volatility, more sensitive to market swings.
CME Group Inc.
- Beta of 0.28 shows lower volatility, more stable stock price in turbulent markets.
4. Regulatory & Legal
S&P Global Inc.
- Credit rating business faces regulatory scrutiny and potential legal challenges globally.
CME Group Inc.
- Subject to complex regulatory frameworks on derivatives trading, with ongoing compliance costs.
5. Supply Chain & Operations
S&P Global Inc.
- Heavy reliance on data accuracy and technology infrastructure; operational disruptions could impact output.
CME Group Inc.
- Operations centered on electronic trading platforms; system outages pose key operational risk.
6. ESG & Climate Transition
S&P Global Inc.
- Provides ESG data and faces pressure to improve own sustainability practices amid investor demand.
CME Group Inc.
- ESG integration in product offerings growing; must adapt to rising climate transition regulations.
7. Geopolitical Exposure
S&P Global Inc.
- Global footprint exposes it to geopolitical risks affecting credit markets and data flow.
CME Group Inc.
- Geopolitical tensions impact derivatives markets, especially currency and commodity contracts.
Which company shows a better risk-adjusted profile?
S&P Global’s most significant risk lies in market competition and regulatory scrutiny, complicating its pricing power and growth. CME Group’s key risk centers on operational risks tied to technology and geopolitical volatility. I see CME’s lower leverage, superior interest coverage, and markedly lower beta as indicators of a better risk-adjusted profile. CME’s Altman Z-Score in the distress zone and average Piotroski score raise concerns, while S&P Global’s strong financial health metrics provide a cushion despite valuation pressures. Recent data shows CME’s very low debt-to-assets ratio (1.72%) and robust interest coverage as reassuring amid market uncertainties.
Final Verdict: Which stock to choose?
S&P Global Inc. wields the superpower of strong income growth and robust cash flow generation. Its efficiency in capital allocation stands out, though a low current ratio signals liquidity caution. This stock suits investors with an appetite for aggressive growth willing to navigate some balance sheet risks.
CME Group Inc. commands a strategic moat through its dominant market position and recurring revenue streams. It offers a safer financial profile compared to S&P Global, with favorable leverage and stable margins. This stock fits well within a GARP (Growth at a Reasonable Price) portfolio aiming for steady returns and moderate risk.
If you prioritize dynamic growth and high cash conversion, S&P Global appears compelling despite liquidity pressures. However, if you seek income stability and a stronger safety cushion, CME Group offers better resilience and a well-established moat. Both stocks present value-destroying trends in capital efficiency, warranting cautious monitoring.
Disclaimer: Investment carries a risk of loss of initial capital. The past performance is not a reliable indicator of future results. Be sure to understand risks before making an investment decision.
Go Further
I encourage you to read the complete analyses of S&P Global Inc. and CME Group Inc. to enhance your investment decisions: