Home > Comparison > Financial Services > CME vs NDAQ
The strategic rivalry between CME Group Inc. and Nasdaq, Inc. defines leadership in financial data and stock exchange services. CME operates primarily as a futures and options contract market, focusing on commodities and derivatives. Nasdaq, by contrast, emphasizes technology-driven market platforms and data services, including anti-financial crime solutions. This analysis will evaluate which company’s operational model delivers superior risk-adjusted returns for a diversified portfolio amid evolving market dynamics.

Table of contents
Companies Overview
CME Group Inc. and Nasdaq, Inc. stand as titans in financial data and stock exchange markets, shaping global capital flows.
CME Group Inc.: Global Futures and Options Market Leader
CME Group dominates the futures and options trading landscape worldwide. It generates revenue through contract markets on interest rates, equity indexes, commodities, and more. In 2026, CME emphasizes expanding its clearing services and risk mitigation, reinforcing its role as a critical infrastructure provider for professional traders and institutions.
Nasdaq, Inc.: Innovator in Market Technology and Listing Services
Nasdaq is a leading technology-driven exchange operator and market services provider. It earns mainly from trading, listing fees, and SaaS anti-financial crime tools. Nasdaq’s strategic focus in 2026 centers on expanding its Market Technology segment and enhancing investment intelligence to support global capital markets and regulatory compliance.
Strategic Collision: Similarities & Divergences
Both firms operate in financial exchanges but differ philosophically: CME prioritizes a broad global futures marketplace; Nasdaq leverages technology and listing services. Their competition unfolds over market share in derivatives and market data solutions. CME offers a more traditional trading infrastructure, while Nasdaq’s tech-driven model appeals to innovation-focused investors seeking growth in regulatory and data services.
Income Statement Comparison
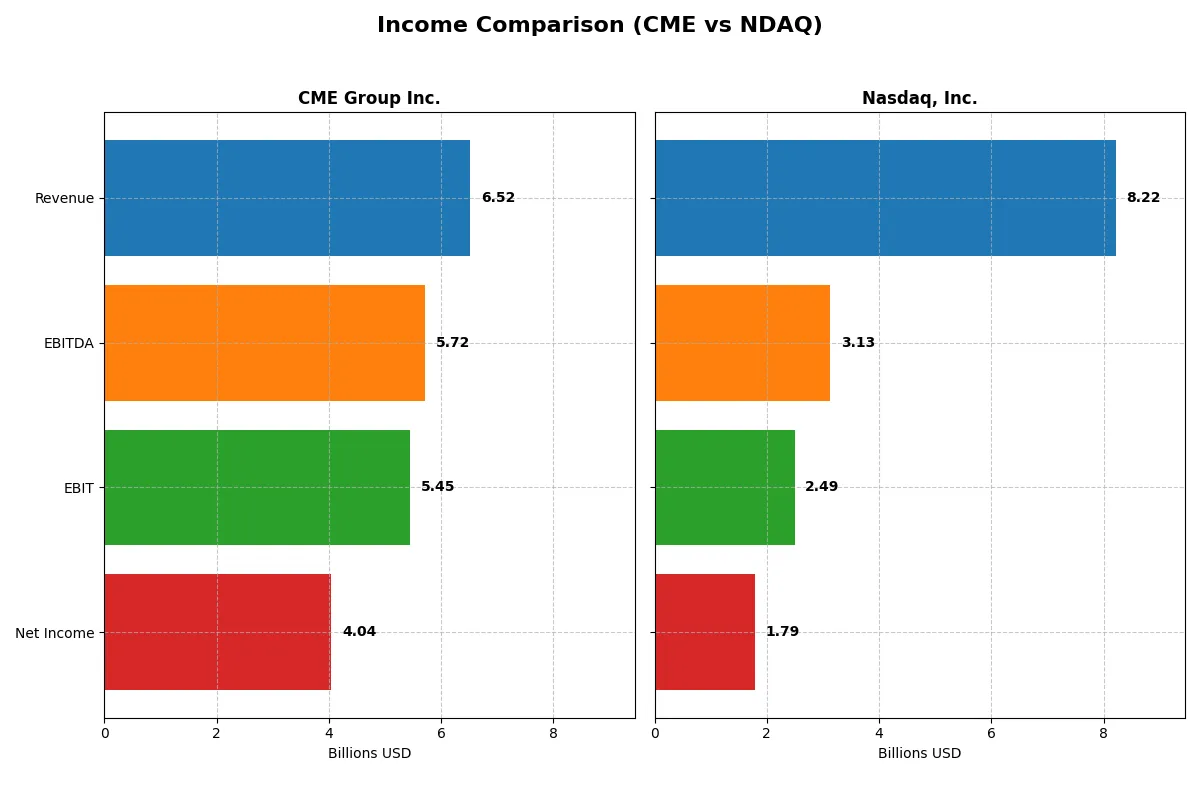
The following data dissects the core profitability and scalability of both corporate engines to reveal who dominates the bottom line:
| Metric | CME Group Inc. (CME) | Nasdaq, Inc. (NDAQ) |
|---|---|---|
| Revenue | 6.52B | 8.22B |
| Cost of Revenue | 907M | 4.28B |
| Operating Expenses | 1.38B | 1.61B |
| Gross Profit | 5.61B | 3.94B |
| EBITDA | 5.72B | 3.13B |
| EBIT | 5.45B | 2.49B |
| Interest Expense | 130M | 88M |
| Net Income | 4.04B | 1.79B |
| EPS | 11.18 | 3.13 |
| Fiscal Year | 2025 | 2025 |
Income Statement Analysis: The Bottom-Line Duel
This income statement comparison reveals which company operates with superior efficiency and sustainable profitability in 2025.
CME Group Inc. Analysis
CME Group’s revenue rose steadily, reaching 6.52B in 2025, with net income climbing to 4.04B. The company maintains exceptional gross margins above 86%, signaling strong cost control. Its net margin at 62% reflects remarkable profitability, supported by a 15.8% EBIT growth. CME’s consistent margin expansion highlights its operational momentum and capital allocation discipline.
Nasdaq, Inc. Analysis
Nasdaq’s revenue grew faster, reaching 8.22B in 2025, but with a slimmer gross margin of 48%. Net income advanced to 1.79B, reflecting a net margin of 22%. Despite a robust 31.8% gross profit increase and 35% EBIT growth, rising operating expenses relative to revenue mark a cautionary note. Nasdaq demonstrates strong growth but at lower margin efficiency than CME.
Margin Dominance vs. Growth Ambition
CME delivers superior profitability with a net margin nearly three times Nasdaq’s, driven by high gross margins and controlled expenses. Nasdaq posts faster revenue and earnings growth but at a cost to margin expansion. For investors prioritizing stable cash flow and margin resilience, CME’s profile stands out. Nasdaq offers growth appeal, but with greater margin pressure and expense risks.
Financial Ratios Comparison
These vital ratios act as a diagnostic tool to expose the underlying fiscal health, valuation premiums, and capital efficiency of the companies compared here:
| Ratios | CME Group Inc. (CME) | Nasdaq, Inc. (NDAQ) |
|---|---|---|
| ROE | 14.1% | 14.6% |
| ROIC | -2.0% | -25.8% |
| P/E | 24.3x | 31.0x |
| P/B | 3.42x | 4.53x |
| Current Ratio | 1.01 | N/A |
| Quick Ratio | 1.01 | N/A |
| D/E (Debt-to-Equity) | 0.12 | 0.81 |
| Debt-to-Assets | 1.7% | 32.0% |
| Interest Coverage | 32.6x | 26.5x |
| Asset Turnover | 0.033 | 0.265 |
| Fixed Asset Turnover | 18.0 | 7.0 |
| Payout ratio | 44.5% | 33.5% |
| Dividend yield | 1.83% | 1.08% |
| Fiscal Year | 2025 | 2025 |
Efficiency & Valuation Duel: The Vital Signs
Ratios act as a company’s DNA, revealing hidden risks and operational excellence behind headline figures.
CME Group Inc.
CME shows strong profitability with a 14.08% ROE and a robust 62.02% net margin, signaling operational efficiency. The stock trades at a neutral P/E of 24.28, suggesting fair valuation. Shareholders benefit from a 1.83% dividend yield, reflecting balanced capital allocation between returns and growth.
Nasdaq, Inc.
Nasdaq posts a similar ROE of 14.63% but a lower net margin of 21.77%, indicating less profit efficiency. Its P/E ratio of 30.98 appears stretched relative to peers. Dividend yield stands at 1.08%, while leverage is higher, signaling greater financial risk despite favorable interest coverage.
Balanced Profitability vs. Stretched Valuation
CME offers a better balance of profitability and valuation, combining efficient operations with moderate risk. Nasdaq’s higher valuation and leverage pose greater risks, fitting investors willing to pay a premium for growth despite financial strain.
Which one offers the Superior Shareholder Reward?
I see CME Group delivers higher dividend yields near 4.3% with a payout ratio around 100%, signaling strong income but tight free cash flow coverage. Nasdaq yields just 1.1% with a 33–48% payout ratio, preserving cash for growth. CME’s buyback intensity is modest but consistent, supporting shareholder value. Nasdaq’s lower payout and higher reinvestment, evidenced by lower margins and leverage, suggest a growth-oriented strategy with less immediate shareholder return. For 2026, CME offers a more attractive total return profile due to its balanced income and buyback mix, appealing to income-focused investors. Nasdaq’s model suits those prioritizing long-term capital gains but carries higher risk.
Comparative Score Analysis: The Strategic Profile
The radar chart reveals the fundamental DNA and trade-offs of CME Group Inc. and Nasdaq, Inc., highlighting their financial strengths and vulnerabilities:
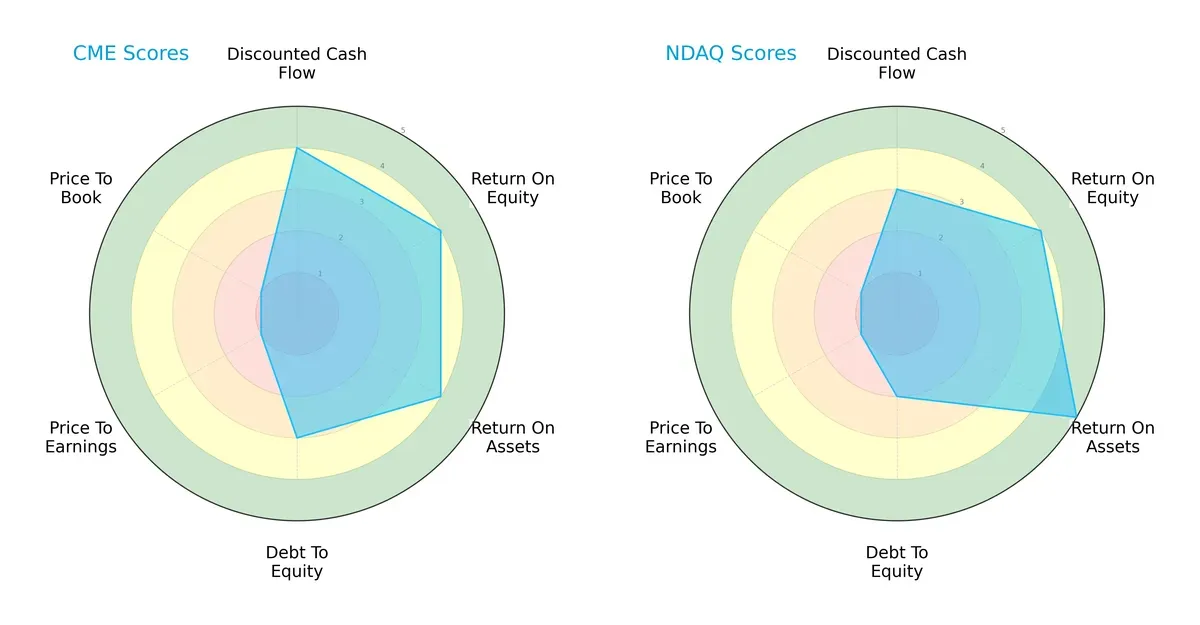
CME Group shows strength in discounted cash flow and balanced returns on equity and assets, coupled with moderate debt management. Nasdaq excels in asset utilization and has a higher ROA score but carries more debt risk. Both suffer from very unfavorable valuation scores, yet CME presents a more balanced financial profile, while Nasdaq relies heavily on operational efficiency.
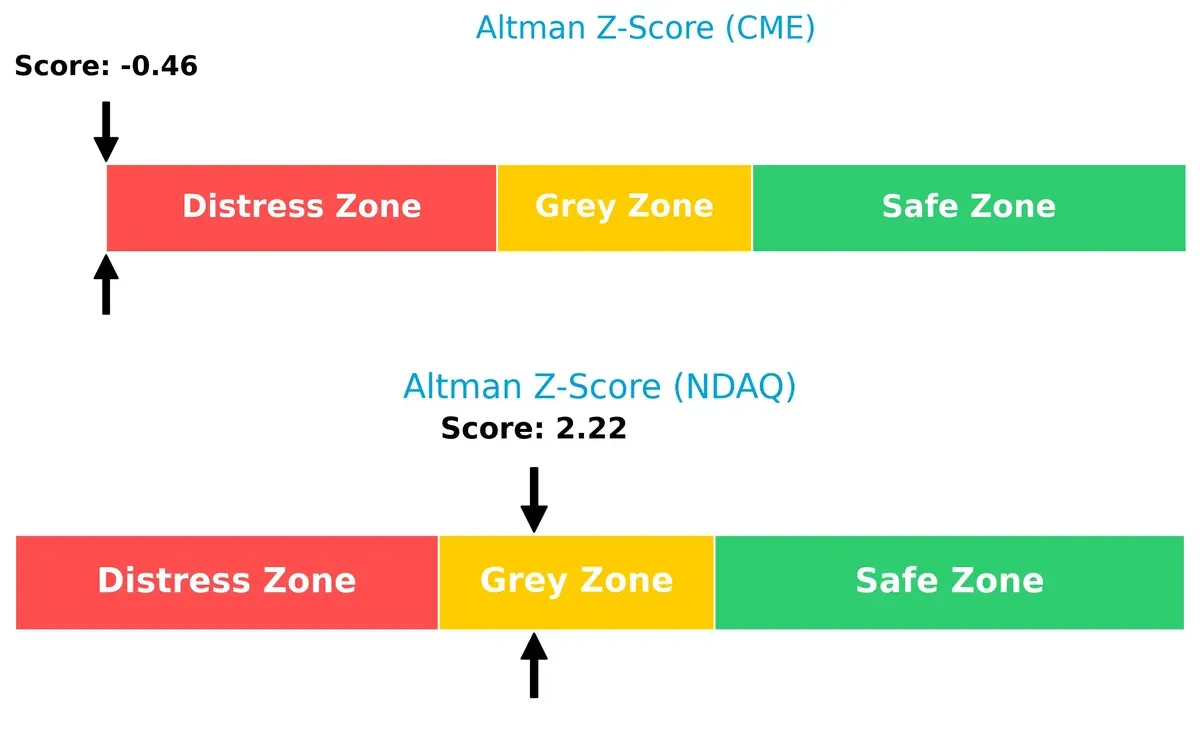
Bankruptcy Risk: Solvency Showdown
The Altman Z-Score gap signals drastically different bankruptcy risks: CME is in distress, implying significant financial strain, whereas Nasdaq remains in a grey zone with moderate survival prospects:
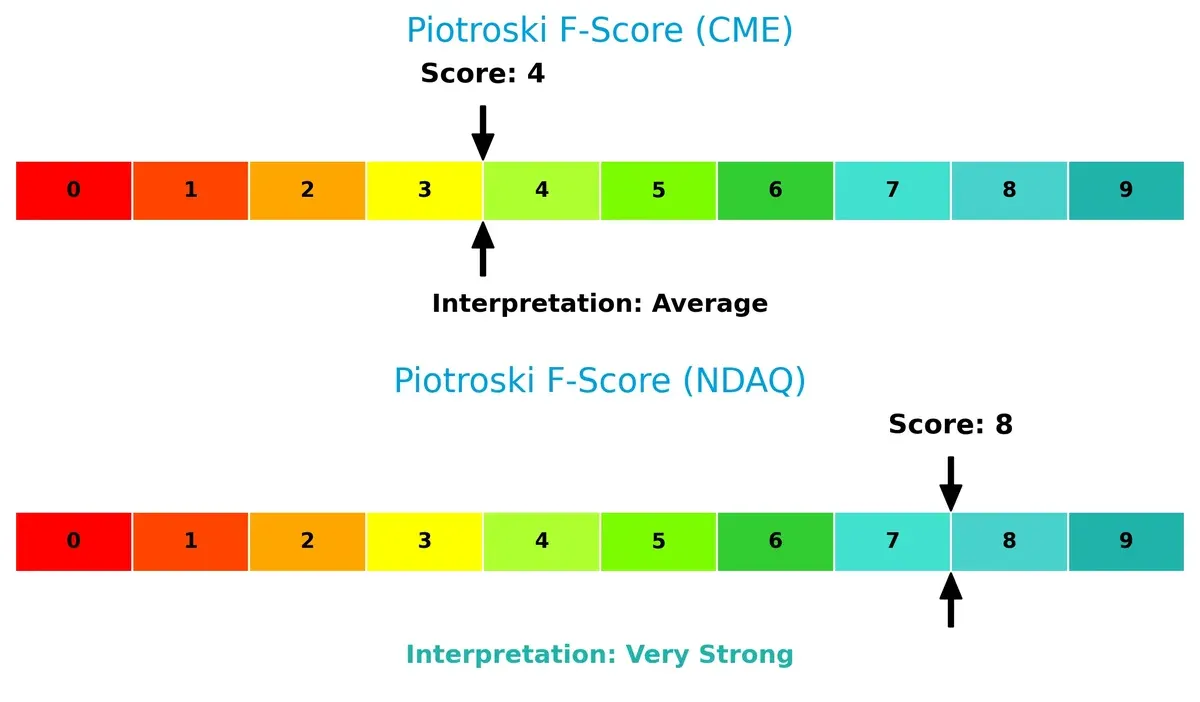
Financial Health: Quality of Operations
Nasdaq’s Piotroski F-Score of 8 signals very strong financial health, contrasting sharply with CME’s average score of 4, which raises internal red flags on profitability and efficiency:
How are the two companies positioned?
This section dissects CME and Nasdaq’s operational DNA by comparing their revenue distribution and internal dynamics, including strengths and weaknesses. The goal is to confront their economic moats to identify which model offers the most resilient and sustainable competitive advantage today.
Revenue Segmentation: The Strategic Mix
This visual comparison dissects how CME Group Inc. and Nasdaq, Inc. diversify their income streams and where their primary sector bets lie:
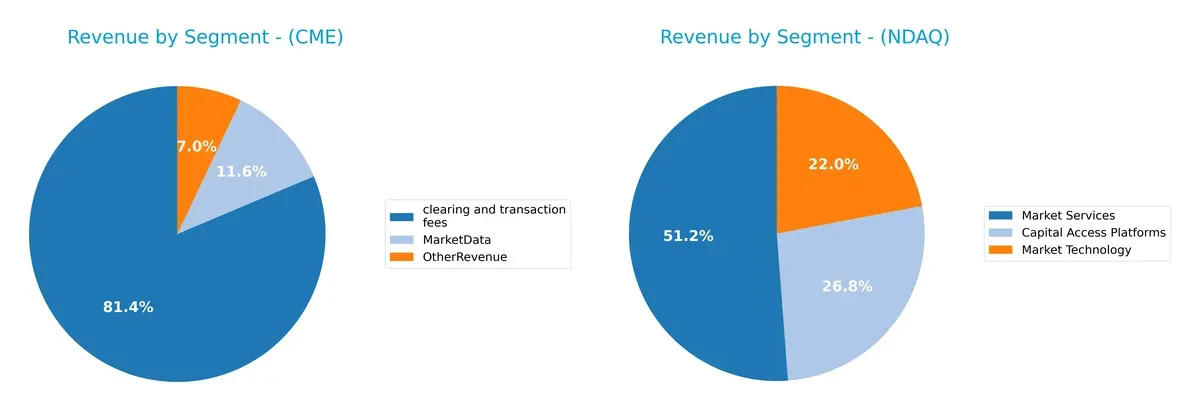
CME anchors revenue in clearing and transaction fees at $4.99B in 2024, dwarfing its Market Data ($710M) and Other Revenue ($432M). Nasdaq presents a more balanced mix, with Market Services leading at $3.77B, followed by Capital Access Platforms at $1.97B and Market Technology at $1.62B. Nasdaq’s diversification reduces concentration risk, while CME’s dominance in clearing fees signals strong ecosystem lock-in but heightened reliance on a single segment.
Strengths and Weaknesses Comparison
This table compares the strengths and weaknesses of CME and Nasdaq based on diversification, profitability, financial health, innovation, global presence, and market share:
CME Strengths
- High net margin at 62% indicates strong profitability
- Favorable WACC at 5% supports cheaper capital
- Low debt-to-assets ratio at 1.72% signals financial prudence
- Very high interest coverage (42x) reduces default risk
- Strong fixed asset turnover at 18 signifies efficient asset use
Nasdaq Strengths
- Favorable net margin at 22% reflects solid profitability
- Favorable WACC at 7.64% supports investment returns
- High interest coverage (28x) indicates good debt service
- Diverse revenue streams across Capital Access, Market Tech, and Services
- Significant US and Non-US revenue shows global presence
CME Weaknesses
- Negative ROIC (-2%) below WACC signals poor capital returns
- Unfavorable current and quick ratios indicate liquidity risks
- Low asset turnover (0.03) shows inefficiency in asset use
- Unfavorable price-to-book ratio (3.42) may concern valuation
- Limited geographic revenue data hinders global reach assessment
Nasdaq Weaknesses
- Negative ROIC (-26%) far below WACC suggests value destruction
- Unfavorable P/E (31) and P/B (4.53) ratios imply high valuation
- Unfavorable current and quick ratios raise liquidity concerns
- Moderate debt-to-assets (32%) increases financial risk
- Asset turnover low at 0.26 reflects relative inefficiency
CME’s strength lies in its superior profitability and financial stability but faces challenges in capital efficiency and liquidity. Nasdaq exhibits broader diversification and global reach but struggles with capital returns and valuation metrics. These factors shape their strategic focus on improving operational efficiency and managing financial leverage.
The Moat Duel: Analyzing Competitive Defensibility
A structural moat is the only reliable shield against relentless competition eroding long-term profits in financial exchanges:
CME Group Inc.: Intangible Assets Fortress
CME leverages strong intangible assets, including trusted clearing services. Its high margins reflect this. However, a declining ROIC threatens moat durability in 2026.
Nasdaq, Inc.: Technology-Driven Network Effect
Nasdaq’s moat hinges on its advanced market tech and SaaS platforms, contrasting CME’s asset-heavy model. Despite robust growth, its profitability erosion signals moat pressure ahead.
Verdict: Intangible Assets vs. Technology Network — Which Moat Holds Stronger?
Both firms face declining ROIC, shedding value despite strong revenue growth. CME’s intangible asset moat remains wider, better defending market share against emerging tech threats.
Which stock offers better returns?
Over the past year, both CME Group Inc. and Nasdaq, Inc. exhibited strong price appreciation, with notable acceleration and distinct trading volume dynamics.
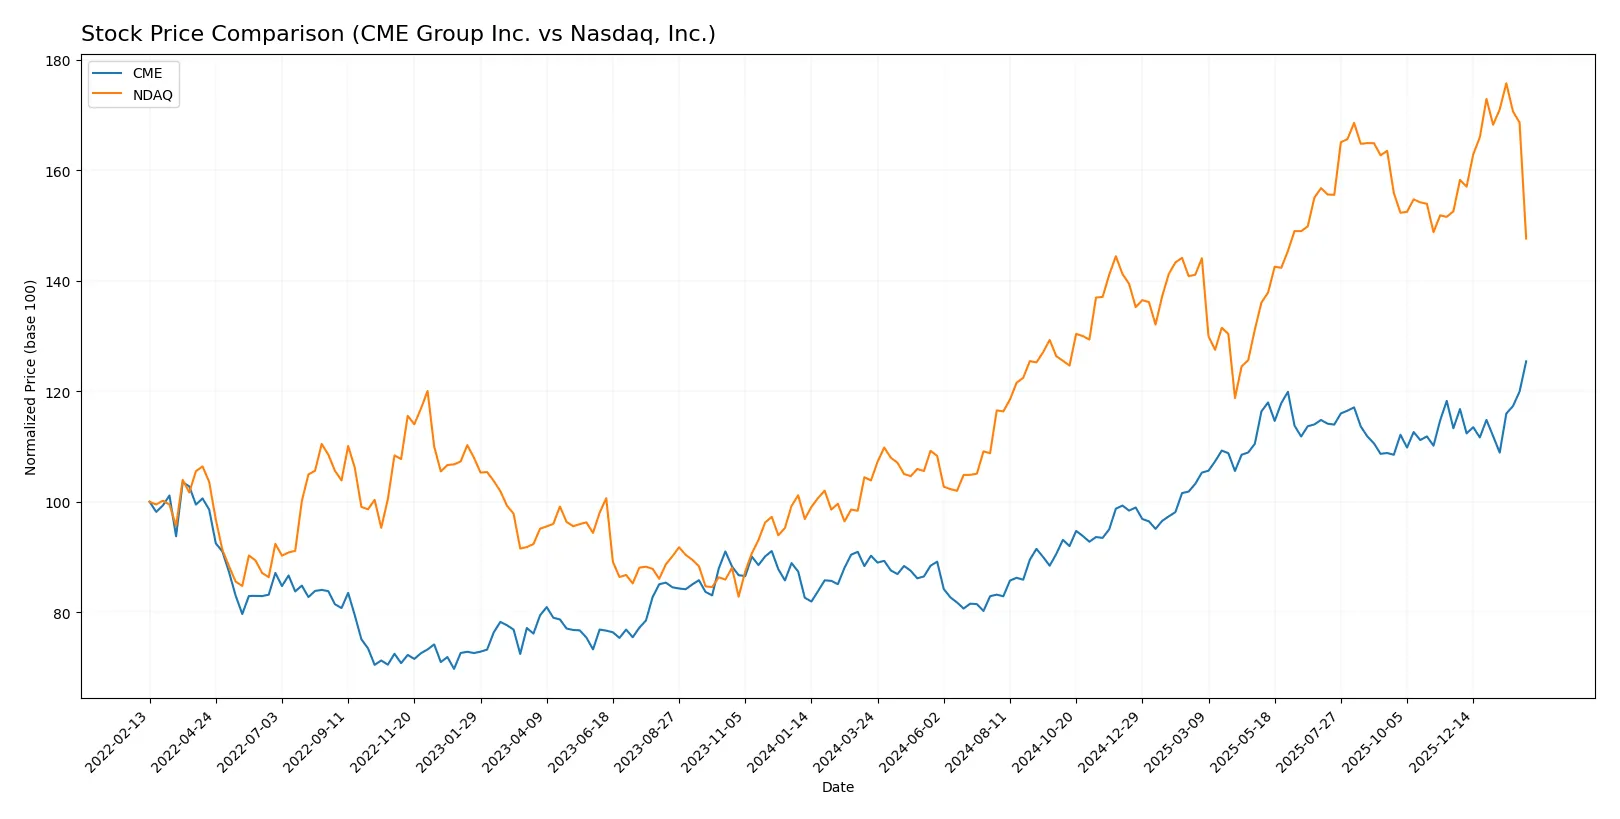
Trend Comparison
CME Group’s stock rose 39% over the past 12 months, showing a bullish trend with accelerating momentum and high volatility, peaking at 302.27 from a low of 193.43.
Nasdaq’s stock appreciated 42% over the same period, also accelerating, but with lower volatility and a high near 100.98 from a low of 58.6; recent months showed a slight decline.
Nasdaq outperformed CME in total price gain over the year, though CME’s recent upward momentum contrasts with Nasdaq’s short-term weakness.
Target Prices
Analysts show a bullish consensus for CME Group Inc. and Nasdaq, Inc., reflecting positive market expectations.
| Company | Target Low | Target High | Consensus |
|---|---|---|---|
| CME Group Inc. | 300 | 340 | 311.83 |
| Nasdaq, Inc. | 100 | 120 | 111.8 |
The consensus target prices for CME and Nasdaq exceed current prices by 3-30%, indicating growth potential despite recent market fluctuations.

Don’t Let Luck Decide Your Entry Point
Optimize your entry points with our advanced ProRealTime indicators. You’ll get efficient buy signals with precise price targets for maximum performance. Start outperforming now!
How do institutions grade them?
Here is a summary of recent institutional grades for both companies:
CME Group Inc. Grades
The following table shows recent grades assigned by reputable firms for CME Group Inc.:
| Grading Company | Action | New Grade | Date |
|---|---|---|---|
| TD Cowen | Maintain | Buy | 2026-02-05 |
| Morgan Stanley | Maintain | Overweight | 2026-02-05 |
| Barclays | Maintain | Equal Weight | 2026-02-05 |
| JP Morgan | Maintain | Underweight | 2026-02-05 |
| RBC Capital | Maintain | Sector Perform | 2026-02-05 |
Nasdaq, Inc. Grades
The following table summarizes recent institutional grades for Nasdaq, Inc.:
| Grading Company | Action | New Grade | Date |
|---|---|---|---|
| RBC Capital | Maintain | Outperform | 2026-01-30 |
| JP Morgan | Maintain | Overweight | 2026-01-30 |
| TD Cowen | Maintain | Hold | 2026-01-30 |
| Morgan Stanley | Maintain | Overweight | 2026-01-30 |
| Barclays | Maintain | Overweight | 2026-01-30 |
Which company has the best grades?
Nasdaq, Inc. generally receives stronger grades, including multiple Overweight and Outperform ratings. CME Group displays a wider range, including Underweight and Sector Perform. This divergence may influence investor sentiment and portfolio positioning.
Risks specific to each company
The following categories identify critical pressure points and systemic threats facing both firms in the 2026 market environment:
1. Market & Competition
CME Group Inc.
- Dominates futures and options markets with wide product diversity, but faces pressure from fintech innovation.
Nasdaq, Inc.
- Strong in technology-driven market services; competition intensifies in SaaS and digital asset segments.
2. Capital Structure & Debt
CME Group Inc.
- Maintains low debt-to-equity ratio (0.12), signaling conservative leverage and strong balance sheet.
Nasdaq, Inc.
- Higher debt-to-equity (0.81) increases financial risk, warranting close monitoring amid rising interest rates.
3. Stock Volatility
CME Group Inc.
- Low beta (0.28) indicates stable stock price, less sensitive to market swings.
Nasdaq, Inc.
- Beta near 1.02 reflects market-level volatility, exposing investors to broader equity market risks.
4. Regulatory & Legal
CME Group Inc.
- Faces ongoing regulatory scrutiny in derivatives markets; compliance costs are manageable but rising.
Nasdaq, Inc.
- Complex regulatory environment due to technology and financial crime surveillance segments; legal risks elevated.
5. Supply Chain & Operations
CME Group Inc.
- Operational model relies on robust clearinghouse infrastructure with minimal supply chain risks.
Nasdaq, Inc.
- Heavy reliance on cloud and SaaS platforms exposes Nasdaq to technology disruptions and cybersecurity threats.
6. ESG & Climate Transition
CME Group Inc.
- Moderate ESG risk; transition to sustainable finance products is ongoing but not yet a core strength.
Nasdaq, Inc.
- Leading in ESG data and governance solutions; however, climate transition regulatory changes could impact operations.
7. Geopolitical Exposure
CME Group Inc.
- Global footprint in futures markets entails exposure to geopolitical tensions affecting commodities and currencies.
Nasdaq, Inc.
- Geopolitical risks heightened by diverse international listings and cross-border technology services.
Which company shows a better risk-adjusted profile?
CME’s strongest risk lies in market competition amid fintech disruption, but its conservative debt and low volatility provide stability. Nasdaq faces significant regulatory and leverage risks, despite strong technological offerings. CME’s low beta and solid capital structure yield a superior risk-adjusted profile. Nasdaq’s elevated debt and regulatory complexity raise caution. The distress-zone Altman Z-score for CME versus Nasdaq’s grey-zone status highlights CME’s financial fragility despite operational strengths. This contrast justifies my concern about CME’s near-term solvency risks.
Final Verdict: Which stock to choose?
CME Group Inc. stands out as a cash machine with unmatched operational efficiency and strong income statement momentum. Its primary point of vigilance lies in declining ROIC, signaling potential challenges in capital allocation. CME suits portfolios targeting aggressive growth with a tolerance for capital efficiency risks.
Nasdaq, Inc. commands a strategic moat through its recurring revenue streams and robust income quality. Compared to CME, it offers a safer profile, although its elevated debt levels warrant caution. Nasdaq fits investors seeking GARP (Growth at a Reasonable Price) with a preference for stability over raw efficiency.
If you prioritize operational cash flow strength and growth acceleration, CME presents a compelling scenario despite its capital efficiency headwinds. However, if you seek better financial stability and a strong earnings quality foundation, Nasdaq offers superior safety, albeit at a premium valuation. Both profiles demand careful monitoring of their capital returns and leverage trends.
Disclaimer: Investment carries a risk of loss of initial capital. The past performance is not a reliable indicator of future results. Be sure to understand risks before making an investment decision.
Go Further
I encourage you to read the complete analyses of CME Group Inc. and Nasdaq, Inc. to enhance your investment decisions: