Home > Comparison > Financial Services > CME vs MSCI
The strategic rivalry between CME Group Inc. and MSCI Inc. defines the current trajectory of the financial data and stock exchanges sector. CME operates as a capital-intensive futures and options exchange, while MSCI excels as a high-margin provider of investment decision support tools. This head-to-head contrasts asset trading infrastructure with analytics-driven growth. This analysis will identify which corporate model delivers the superior risk-adjusted return for a diversified portfolio in 2026.
Table of contents
Companies Overview
CME Group Inc. and MSCI Inc. shape critical corners of the global financial data and exchange landscape.
CME Group Inc.: Global Futures Market Leader
CME Group Inc. dominates as a global contract market operator specializing in futures and options trading across interest rates, equity indexes, commodities, and currencies. Its revenue stems primarily from transaction fees and clearing services. In 2026, CME sharpened its focus on expanding cleared swaps and risk mitigation services, reinforcing its role as a central infrastructure provider for derivatives markets.
MSCI Inc.: Premier Investment Decision Support
MSCI Inc. excels in providing investment decision tools through index licensing, analytics, and ESG data solutions. Its core business generates income from licensing indexes used in ETFs and mutual funds, alongside analytics and climate risk services. In 2026, MSCI emphasized growing its ESG and climate segment to address rising investor demand for sustainable investment frameworks.
Strategic Collision: Similarities & Divergences
Both companies operate within the financial services sector but diverge sharply in approach. CME thrives on a trading and clearing ecosystem focused on derivatives, while MSCI builds an open data infrastructure catering to asset managers’ decision-making needs. Their primary battleground is the financial data market, where CME leverages liquidity and clearing, and MSCI commands influence through proprietary indexes and analytics. This delineates distinct investment profiles—CME’s cash flow stability contrasts with MSCI’s growth-oriented exposure to ESG and analytics trends.
Income Statement Comparison
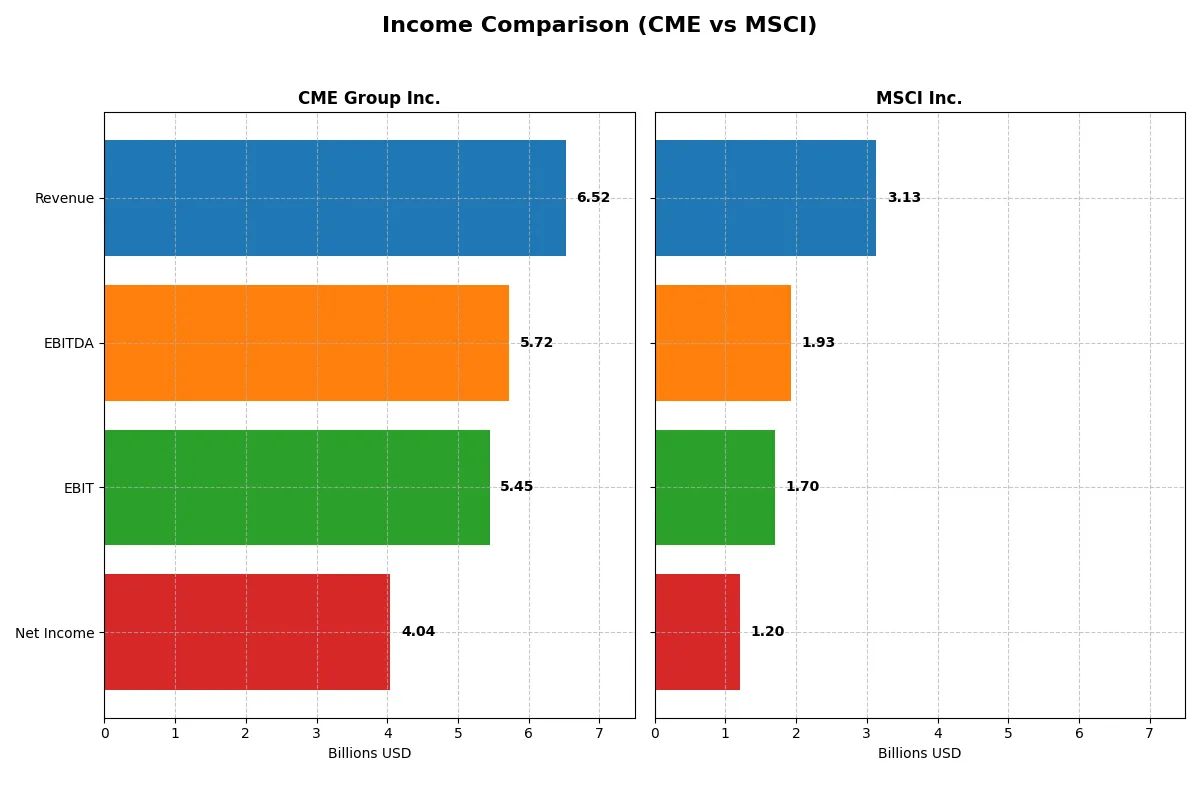
The following data dissects the core profitability and scalability of both corporate engines to reveal who dominates the bottom line:
| Metric | CME Group Inc. (CME) | MSCI Inc. (MSCI) |
|---|---|---|
| Revenue | 6.52B | 3.13B |
| Cost of Revenue | 907M | 550M |
| Operating Expenses | 1.38B | 871M |
| Gross Profit | 5.61B | 2.58B |
| EBITDA | 5.72B | 1.93B |
| EBIT | 5.45B | 1.70B |
| Interest Expense | 130M | 210M |
| Net Income | 4.04B | 1.20B |
| EPS | 11.18 | 15.58 |
| Fiscal Year | 2025 | 2025 |
Income Statement Analysis: The Bottom-Line Duel
This income statement comparison reveals how efficiently CME Group and MSCI convert revenue into profits and sustain margin strength.
CME Group Inc. Analysis
CME Group’s revenue rose steadily, reaching $6.5B in 2025, with net income climbing to $4B. Its gross margin holds strong at 86%, while net margin impressively sits above 62%. The company’s 2025 figures show robust operational leverage, with EBIT growth outpacing revenue, signaling efficient cost control and expanding profitability.
MSCI Inc. Analysis
MSCI’s revenue grew to $3.1B in 2025, alongside net income of $1.2B. The firm maintains a solid gross margin at 82%, but net margin trails at 38%. Despite healthy revenue and EBIT growth, MSCI’s net margin slipped slightly in the latest year, hinting at margin pressure possibly from rising interest expenses or operating costs.
Margin Strength vs. Growth Trajectory
CME Group outperforms MSCI in margin dominance, boasting higher gross and net margins with superior EBIT efficiency. MSCI shows stronger revenue and net income growth percentages but faces margin compression risks. For investors prioritizing consistent profitability and margin resilience, CME’s profile is more compelling, while MSCI appeals to those focused on growth potential with moderate margin volatility.
Financial Ratios Comparison
These vital ratios act as a diagnostic tool to expose the underlying fiscal health, valuation premiums, and capital efficiency of the companies compared below:
| Ratios | CME Group Inc. (CME) | MSCI Inc. (MSCI) |
|---|---|---|
| ROE | 14.08% | -45.29% |
| ROIC | -2.01% | 35.60% |
| P/E | 24.28 | 36.82 |
| P/B | 3.42 | -16.68 |
| Current Ratio | 0 | 0.90 |
| Quick Ratio | 0 | 0.90 |
| D/E | 0.12 | -2.42 |
| Debt-to-Assets | 1.72% | 112.54% |
| Interest Coverage | 32.61 | 8.16 |
| Asset Turnover | 0.033 | 0.55 |
| Fixed Asset Turnover | 17.98 | 15.66 |
| Payout Ratio | 44.46% | 46.29% |
| Dividend Yield | 1.83% | 1.26% |
| Fiscal Year | 2025 | 2025 |
Efficiency & Valuation Duel: The Vital Signs
Ratios act as a company’s DNA, revealing hidden risks and operational excellence that shape investor confidence and portfolio decisions.
CME Group Inc.
CME shows solid profitability with a 14.08% ROE and a strong 62.02% net margin, signaling efficient core operations. The stock trades at a neutral 24.28 P/E but an unfavorable 3.42 P/B, suggesting moderate valuation tension. Shareholders benefit from a 1.83% dividend yield, reflecting steady cash returns alongside restrained growth reinvestment.
MSCI Inc.
MSCI boasts a high 35.6% ROIC and a favorable P/B ratio, yet suffers from a deeply negative ROE of -45.29%, highlighting equity challenges. Its P/E stands stretched at 36.82, indicating expensive valuation. The 1.26% dividend yield is modest, while negative free cash flow suggests reinvestment heavily favors R&D and growth initiatives amid financial volatility.
Valuation Balance vs. Profitability Stability
CME offers a safer balance of profitability and valuation with consistent dividends and operational efficiency. MSCI’s profile suits growth-seeking investors willing to accept higher risk and valuation stretch for potential innovation payoffs. The choice hinges on your appetite for stability versus aggressive expansion.
Which one offers the Superior Shareholder Reward?
I see CME Group delivers a stronger and more sustainable shareholder reward than MSCI in 2026. CME yields 1.83% with a 44% payout ratio, backed by solid free cash flow coverage and consistent buybacks. MSCI offers a lower 1.26% yield and a 46% payout but carries significant leverage and volatile earnings. CME’s balanced dividend and aggressive buybacks drive superior total returns and long-term value. MSCI’s reinvestment strategy faces risks from high debt and weaker cash flow ratios. For disciplined income and capital appreciation, I favor CME Group.
Comparative Score Analysis: The Strategic Profile
The radar chart reveals the fundamental DNA and trade-offs of CME Group Inc. and MSCI Inc., highlighting their financial strengths and valuation challenges:
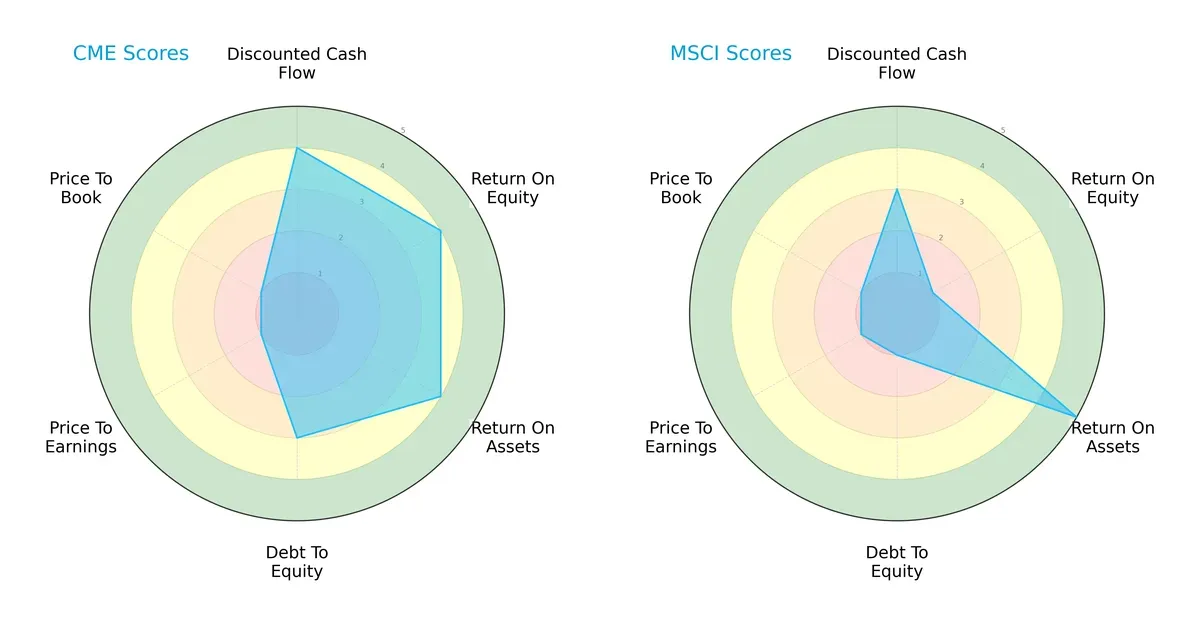
CME shows a balanced profile with favorable scores in DCF, ROE, and ROA, and moderate debt management. MSCI excels in asset utilization but suffers from weak equity returns and high leverage. CME relies on operational efficiency, while MSCI leans heavily on asset productivity despite financial risk.
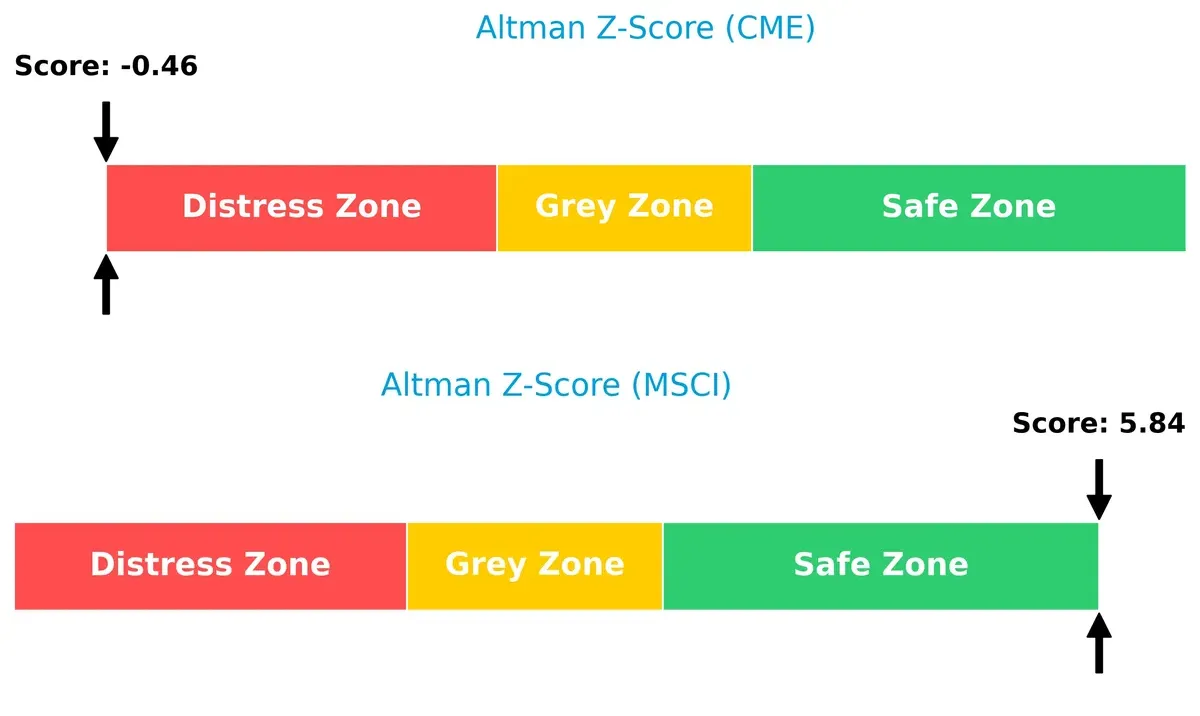
Bankruptcy Risk: Solvency Showdown
MSCI’s Altman Z-Score of 5.84 places it securely in the safe zone, signaling strong long-term solvency. CME’s score of -0.46 flags distress risk, indicating vulnerability in this economic cycle:
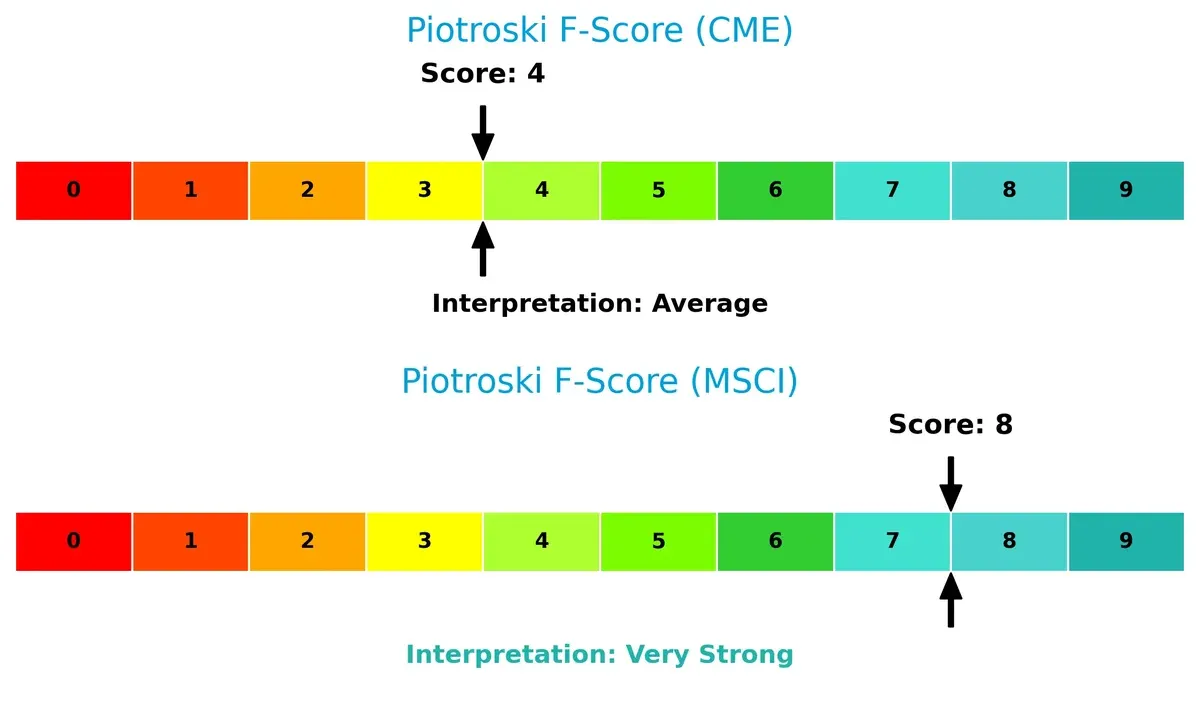
Financial Health: Quality of Operations
MSCI scores an impressive 8 on the Piotroski scale, denoting very strong financial health and operational quality. CME’s 4 signals average health with internal metrics that warrant caution:
How are the two companies positioned?
This section dissects the operational DNA of CME and MSCI by comparing their revenue distribution and internal dynamics. Its final objective is to confront their economic moats to identify which business model offers the most resilient and sustainable competitive advantage in today’s market.
Revenue Segmentation: The Strategic Mix
The following visual comparison dissects how CME Group Inc. and MSCI Inc. diversify their income streams and where their primary sector bets lie:
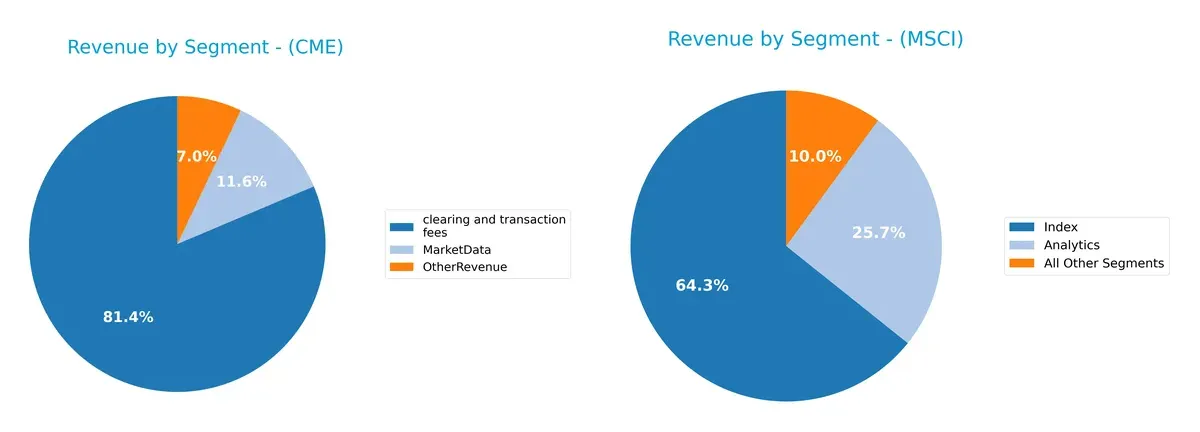
CME anchors its revenue with a dominant $4.99B from clearing and transaction fees, dwarfing its $710M MarketData and $432M OtherRevenue segments. MSCI presents a more balanced mix, with $1.79B from Index, $714M Analytics, and $279M in All Other Segments. CME’s concentration signals infrastructure dominance but heightens concentration risk. MSCI’s diversified streams suggest strategic ecosystem lock-in and resilience.
Strengths and Weaknesses Comparison
This table compares the strengths and weaknesses of CME Group Inc. and MSCI Inc. based on diversification, profitability, financials, innovation, global presence, and market share:
CME Strengths
- High net margin at 62%
- Favorable WACC at 5.02%
- Low debt to assets ratio of 1.72%
- Strong interest coverage at 42x
- Robust fixed asset turnover of 18
- Diverse revenue streams including Market Data and Clearing Fees
MSCI Strengths
- Favorable net margin at 38%
- High ROIC at 35.6%
- Favorable PB ratio
- Solid interest coverage at 8x
- Diversified revenue from Index and Analytics segments
- Broad geographic revenue base across Americas, EMEA, and Asia
CME Weaknesses
- Negative ROIC at -2% signals inefficient capital use
- Unfavorable current and quick ratios at 0, indicating liquidity concerns
- Low asset turnover at 0.03
- Unfavorable PB ratio at 3.42
- Neutral ROE at 14%
- Moderate dividend yield at 1.83%
MSCI Weaknesses
- Negative ROE at -45%, indicating poor profitability
- High debt to assets at 113%, raising leverage risk
- Unfavorable PE at 36.82
- Current ratio below 1 at 0.9
- Moderate dividend yield at 1.26%
- Neutral asset turnover at 0.55
CME displays strong profitability and low leverage but faces liquidity and capital efficiency challenges. MSCI shows excellent capital returns and global diversification but struggles with profitability and elevated debt levels. Both companies must address their financial weaknesses to sustain competitive advantage.
The Moat Duel: Analyzing Competitive Defensibility
A structural moat is the only reliable shield protecting long-term profits from relentless competitive pressures:
CME Group Inc.: Cost Advantage Meets Margin Pressure
CME’s moat rests on its cost advantage and market dominance in futures trading. Despite strong margins (62% net margin in 2025), its declining ROIC signals eroding capital efficiency. New product launches may struggle to reverse this trend in 2026.
MSCI Inc.: Intangible Assets Fuel Sustainable Growth
MSCI’s intangible assets—indexes, analytics, and ESG data—drive a robust moat. It consistently creates value with a 27% ROIC premium over WACC and expanding margins, positioning it well for global expansion and innovation-led growth in 2026.
Cost Efficiency vs. Intangible Asset Strength
MSCI possesses the deeper, more durable moat, evidenced by growing ROIC and superior capital allocation. CME’s margin strength is notable but undermined by declining ROIC, leaving MSCI better equipped to defend and expand its market share.
Which stock offers better returns?
Over the past 12 months, CME Group and MSCI have shown distinct price trajectories, with CME displaying a strong upward momentum and MSCI moving more modestly amid fluctuating trading activity.
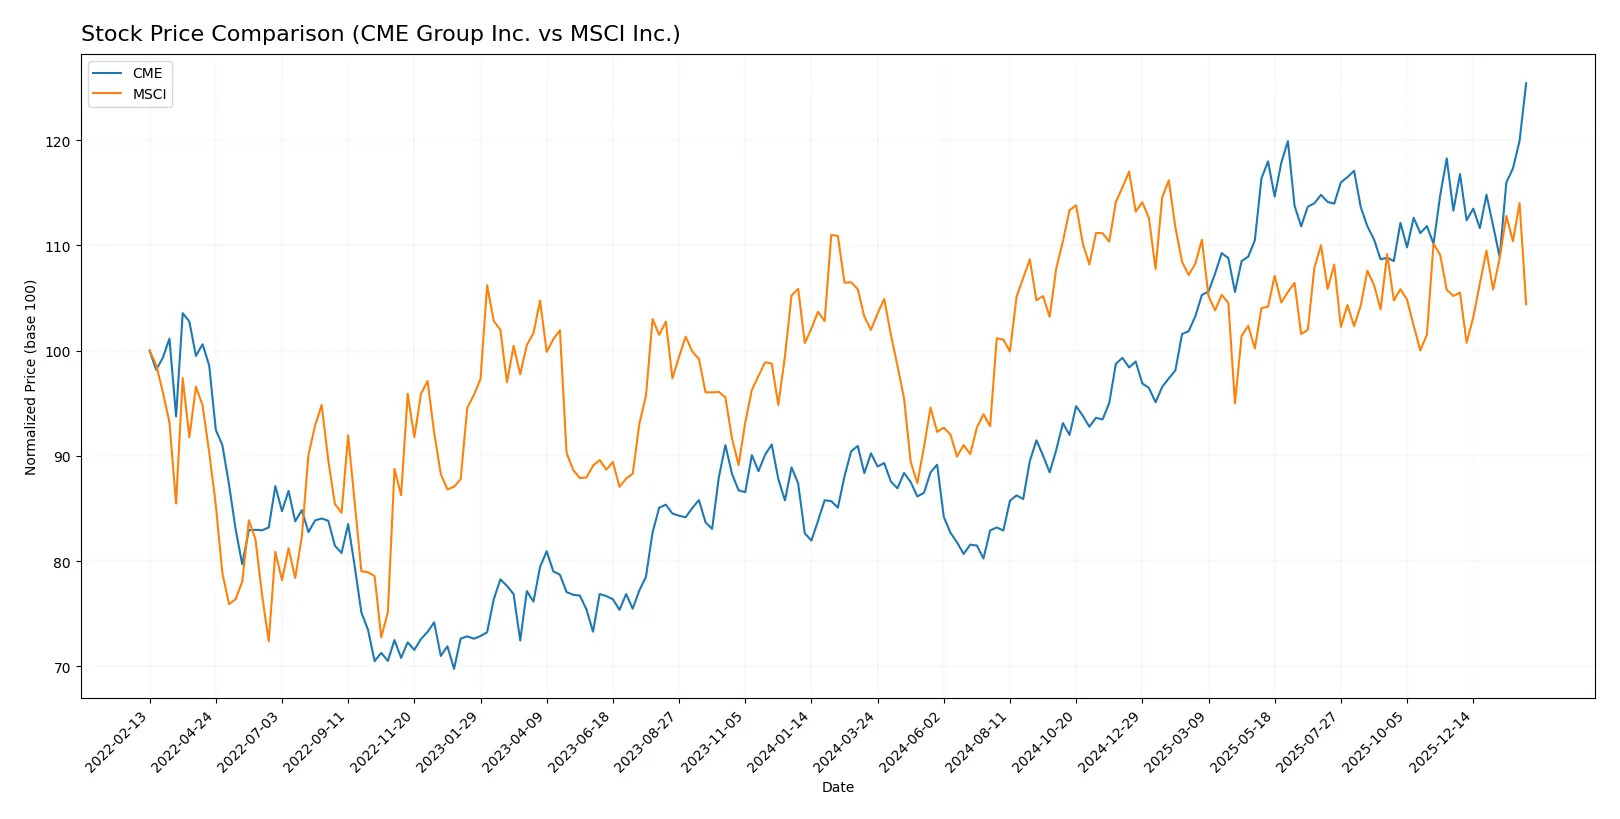
Trend Comparison
CME Group’s stock rose 39% over the last year, showing a bullish trend with accelerating gains and a high of 302.27. The price demonstrates robust momentum with moderate volatility (std dev 29.68).
MSCI’s price increased 2.4% over the same period, reflecting a neutral to mild bullish trend with acceleration but limited net gain. Volatility is higher at 35.43, with a peak near 625.1.
CME delivers the highest market performance, outperforming MSCI by a wide margin in total price appreciation and demonstrating more consistent upward acceleration.
Target Prices
Analysts present a solid target consensus for CME Group Inc. and MSCI Inc., reflecting confidence in their sector leadership.
| Company | Target Low | Target High | Consensus |
|---|---|---|---|
| CME Group Inc. | 300 | 340 | 311.83 |
| MSCI Inc. | 618 | 715 | 664.5 |
The consensus target prices for CME and MSCI exceed their current prices by 3-19%, signaling moderate upside potential. Analysts expect steady growth aligned with financial data services trends.

Don’t Let Luck Decide Your Entry Point
Optimize your entry points with our advanced ProRealTime indicators. You’ll get efficient buy signals with precise price targets for maximum performance. Start outperforming now!
How do institutions grade them?
This section compares the latest institutional grades assigned to CME Group Inc. and MSCI Inc.:
CME Group Inc. Grades
The following table summarizes recent grades from reputable financial institutions for CME Group Inc.:
| Grading Company | Action | New Grade | Date |
|---|---|---|---|
| TD Cowen | Maintain | Buy | 2026-02-05 |
| Morgan Stanley | Maintain | Overweight | 2026-02-05 |
| Barclays | Maintain | Equal Weight | 2026-02-05 |
| JP Morgan | Maintain | Underweight | 2026-02-05 |
| RBC Capital | Maintain | Sector Perform | 2026-02-05 |
MSCI Inc. Grades
The following table presents recent grades from leading financial firms for MSCI Inc.:
| Grading Company | Action | New Grade | Date |
|---|---|---|---|
| Evercore ISI Group | Maintain | Outperform | 2026-01-29 |
| Wells Fargo | Maintain | Equal Weight | 2026-01-29 |
| JP Morgan | Maintain | Overweight | 2025-10-29 |
| UBS | Maintain | Buy | 2025-10-29 |
| Barclays | Maintain | Overweight | 2025-10-29 |
Which company has the best grades?
MSCI Inc. generally receives higher grades such as Outperform and Overweight compared to CME Group’s mix of Buy, Overweight, and Underweight ratings. This suggests greater institutional confidence in MSCI, potentially affecting investor sentiment and valuation.
Risks specific to each company
The following categories identify critical pressure points and systemic threats facing CME Group Inc. and MSCI Inc. in the 2026 market environment:
1. Market & Competition
CME Group Inc.
- Operates in a mature futures and options market with strong global competitors but benefits from diversified product lines.
MSCI Inc.
- Faces intense competition in index and analytics services; innovation in ESG and climate data is a key battleground.
2. Capital Structure & Debt
CME Group Inc.
- Low debt-to-equity ratio (0.12) and strong interest coverage (42x) indicate financial stability and prudent leverage.
MSCI Inc.
- Extremely high debt-to-assets ratio (113%) signals risk; negative debt-to-equity ratio suggests accounting anomalies or off-balance-sheet liabilities.
3. Stock Volatility
CME Group Inc.
- Low beta (0.28) implies stable stock with limited market sensitivity, appealing to risk-averse investors.
MSCI Inc.
- High beta (1.28) indicates significant volatility and higher sensitivity to market swings, raising risk for shareholders.
4. Regulatory & Legal
CME Group Inc.
- Heavily regulated futures exchange faces compliance costs but benefits from established regulatory frameworks.
MSCI Inc.
- ESG data services face evolving regulations; risk of legal challenges over data accuracy or proprietary indexes.
5. Supply Chain & Operations
CME Group Inc.
- Operations rely on robust IT infrastructure and clearinghouses; operational disruptions could impact liquidity and client trust.
MSCI Inc.
- Dependent on data accuracy and technology platforms; operational risk includes data breaches and system failures.
6. ESG & Climate Transition
CME Group Inc.
- ESG integration is moderate; transition risks exist but less central to core business.
MSCI Inc.
- ESG and climate data form a core segment; regulatory pressure and market demand create both growth opportunities and execution risks.
7. Geopolitical Exposure
CME Group Inc.
- Global trading exposure subjects CME to geopolitical tensions affecting commodity and currency markets.
MSCI Inc.
- International client base exposes MSCI to geopolitical risks, especially around data privacy and cross-border regulations.
Which company shows a better risk-adjusted profile?
CME Group’s most impactful risk lies in its unfavorable liquidity ratios and modest ROIC, despite its strong capital structure and low stock volatility. MSCI faces severe financial leverage concerns and stock volatility, but excels in operational efficiency and ESG market positioning. MSCI’s Altman Z-Score in the safe zone and strong Piotroski Score contrast with CME’s distress zone Z-Score and average Piotroski. However, CME’s low beta and robust interest coverage lend it a safer risk profile overall. Recent data highlight MSCI’s alarming debt-to-assets ratio above 100%, underscoring its leverage risk, while CME’s zero current and quick ratios signal potential liquidity red flags investors must monitor.
Final Verdict: Which stock to choose?
CME Group Inc. excels as a cash-generating powerhouse with a resilient net margin near 62%. Its superpower lies in operational efficiency and disciplined capital management. The main point of vigilance is its declining return on invested capital, signaling potential value erosion. CME suits aggressive growth portfolios seeking strong income and market leadership.
MSCI Inc. boasts a durable strategic moat anchored in a growing ROIC that outpaces its cost of capital. This indicates a sustainable competitive advantage, reinforced by robust income quality and innovation investment. Relative to CME, MSCI offers a riskier balance sheet but greater long-term value creation potential. It fits well in GARP portfolios balancing growth and valuation discipline.
If you prioritize near-term operational cash flow and solid income generation, CME is the compelling choice due to its efficiency and margin strength. However, if you seek sustainable competitive advantage and superior capital returns over time, MSCI offers better stability and value creation despite higher leverage. Both scenarios require close monitoring of financial health and market conditions.
Disclaimer: Investment carries a risk of loss of initial capital. The past performance is not a reliable indicator of future results. Be sure to understand risks before making an investment decision.
Go Further
I encourage you to read the complete analyses of CME Group Inc. and MSCI Inc. to enhance your investment decisions: