Home > Comparison > Financial Services > CME vs MCO
The strategic rivalry between CME Group Inc. and Moody’s Corporation shapes the financial data and exchange sector’s evolution. CME operates as a capital-intensive global futures and options exchange, while Moody’s leads as a high-margin integrated risk assessment and credit rating firm. This analysis explores their divergent growth models and competitive moats to identify which company presents a superior risk-adjusted opportunity for a diversified institutional portfolio.

Table of contents
Companies Overview
CME Group and Moody’s Corporation stand as pillars in the global financial data and services sector.
CME Group Inc.: The Global Futures Marketplace Leader
CME Group dominates the futures and options contract markets worldwide. It generates revenue mainly through transaction fees on futures and options across interest rates, equity indexes, and commodities. In 2026, it focuses on expanding its clearinghouse services and enhancing market data offerings to support risk mitigation and trade processing.
Moody’s Corporation: Premier Risk Assessment Powerhouse
Moody’s is a leading integrated risk assessment firm, primarily earning from credit ratings and analytics. It operates two segments: Investors Service for credit ratings and Analytics for subscription-based risk management tools. Its 2026 strategy emphasizes broadening its data and research products while deepening analytics to support institutional clients’ financial risk management.
Strategic Collision: Similarities & Divergences
CME Group pursues an open marketplace model, facilitating transparent price discovery via futures trading. Moody’s relies on proprietary credit ratings and subscription services, building a closed analytical ecosystem. Both compete in financial market infrastructure but target distinct value propositions: CME offers transactional liquidity, Moody’s delivers credit insight. Their investment profiles differ as CME’s stable, low-beta business contrasts with Moody’s higher volatility yet diversified analytics portfolio.
Income Statement Comparison
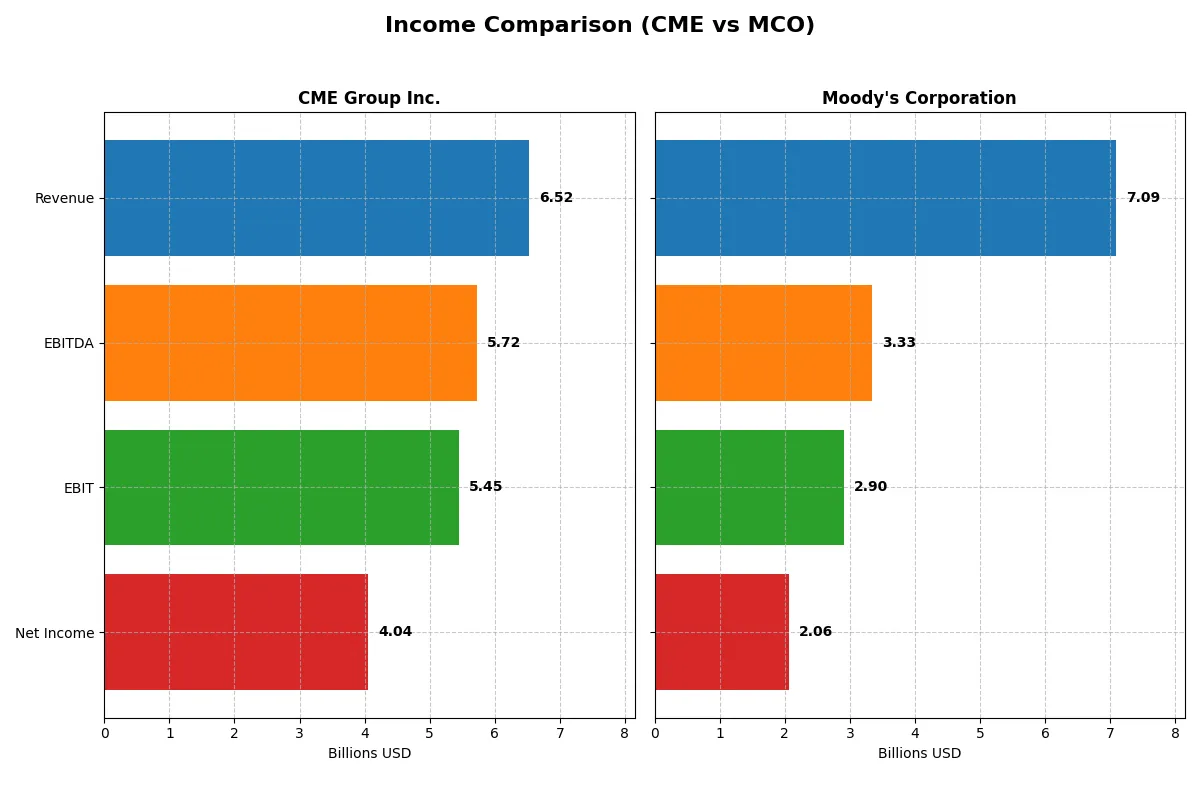
This data dissects the core profitability and scalability of both corporate engines to reveal who dominates the bottom line:
| Metric | CME Group Inc. (CME) | Moody’s Corporation (MCO) |
|---|---|---|
| Revenue | 6.52B | 7.09B |
| Cost of Revenue | 907M | 2.38B |
| Operating Expenses | 1.38B | 1.74B |
| Gross Profit | 5.61B | 4.71B |
| EBITDA | 5.72B | 3.33B |
| EBIT | 5.45B | 2.90B |
| Interest Expense | 130M | 204M |
| Net Income | 4.04B | 2.06B |
| EPS | 11.18 | 11.32 |
| Fiscal Year | 2025 | 2024 |
Income Statement Analysis: The Bottom-Line Duel
This comparison reveals which company drives greater efficiency and profit from their revenue engines over recent years.
CME Group Inc. Analysis
CME’s revenue grew steadily from $4.7B in 2021 to $6.5B in 2025, pushing net income up 53% over five years. Its gross margin holds strong at 86%, with a net margin above 62%, signaling exceptional profitability. In 2025, CME accelerated EBIT by nearly 16%, demonstrating robust operational momentum and efficient cost management.
Moody’s Corporation Analysis
Moody’s revenue climbed from $5.4B in 2020 to $7.1B in 2024, with net income rising 16% over five years. Gross margin sits at a healthy 66%, but net margin lags at 29%. The latest year showed a sharp 20% revenue increase and 36% EBIT growth, reflecting strong top-line momentum despite thinner margins.
Verdict: High Margin Efficiency vs. Strong Growth Momentum
CME outperforms Moody’s in profitability, boasting superior gross and net margins and more consistent net income growth. Moody’s excels in top-line and EBIT acceleration but at lower margin levels. For investors prioritizing margin quality and steady profit expansion, CME’s profile presents a more attractive fundamental foundation.
Financial Ratios Comparison
These vital ratios act as a diagnostic tool to expose the underlying fiscal health, valuation premiums, and capital efficiency of the companies compared:
| Ratios | CME Group Inc. (CME) | Moody’s Corporation (MCO) |
|---|---|---|
| ROE | 14.08% | 57.73% |
| ROIC | -2.01% | 17.84% |
| P/E | 24.28 | 41.82 |
| P/B | 3.42 | 24.14 |
| Current Ratio | 0 | 1.43 |
| Quick Ratio | 0 | 1.43 |
| D/E | 0.12 | 2.17 |
| Debt-to-Assets | 1.72% | 49.96% |
| Interest Coverage | 32.61 | 14.56 |
| Asset Turnover | 0.03 | 0.46 |
| Fixed Asset Turnover | 17.98 | 8.13 |
| Payout Ratio | 44.46% | 30.13% |
| Dividend Yield | 1.83% | 0.72% |
| Fiscal Year | 2025 | 2024 |
Efficiency & Valuation Duel: The Vital Signs
Financial ratios serve as a company’s DNA, revealing hidden risks and operational excellence beneath surface numbers.
CME Group Inc.
CME posts a decent 14.1% ROE and a strong 62.0% net margin, indicating solid profitability. Its P/E of 24.3 suggests the stock is fairly valued, neither cheap nor stretched. CME returns value with a 1.83% dividend yield, balancing shareholder payouts with reinvestment in stable operations.
Moody’s Corporation
Moody’s delivers an exceptional 57.7% ROE but a slimmer 29.0% net margin. Its high P/E of 41.8 signals an expensive valuation. The company focuses less on dividends (0.72% yield), likely prioritizing growth and strategic investments to sustain its dominant market position.
Premium Valuation vs. Operational Safety
Both companies achieve a slightly favorable ratio profile, but CME offers a more balanced risk-reward with stable profitability and reasonable valuation. Moody’s suits investors seeking high growth and willing to accept premium pricing and elevated risk.
Which one offers the Superior Shareholder Reward?
I compare CME Group and Moody’s based on dividend yield, payout ratios, and buyback intensity. CME yields 4.3% with a payout near 100%, signaling strong cash return but limited reinvestment. Moody’s yields under 1%, with a modest 30% payout ratio, prioritizing growth via R&D and acquisitions. CME’s buybacks are consistent but less aggressive; Moody’s deploys free cash flow more flexibly. Given Moody’s lower payout and higher reinvestment, its model suits long-term value creation better. I judge Moody’s superior for total shareholder reward in 2026, balancing income and growth sustainably.
Comparative Score Analysis: The Strategic Profile
The radar chart reveals the fundamental DNA and trade-offs of CME Group Inc. and Moody’s Corporation, highlighting their core financial strengths and valuation challenges:
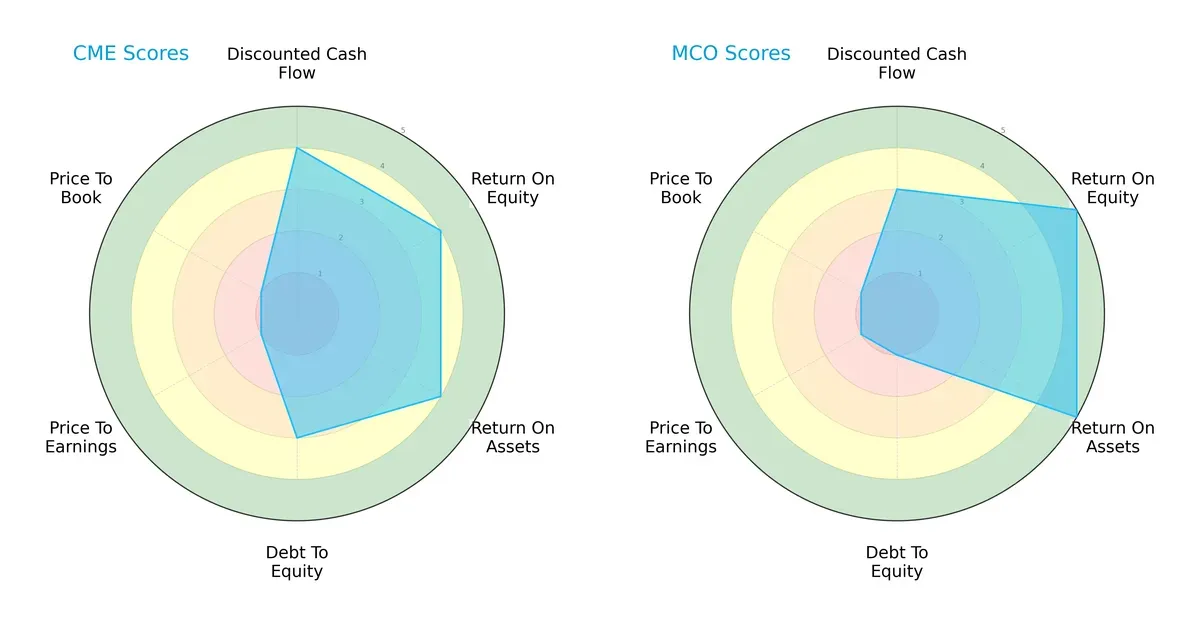
CME shows a balanced profile with solid DCF, ROE, and ROA scores (4 each) and moderate debt management (3). Moody’s excels in profitability with top ROE and ROA scores (5 each) but suffers from high leverage risk (debt/equity score 1). Both share weak valuation metrics (P/E and P/B scores at 1), indicating expensive market pricing. CME relies on financial stability, while Moody’s depends heavily on operational efficiency.
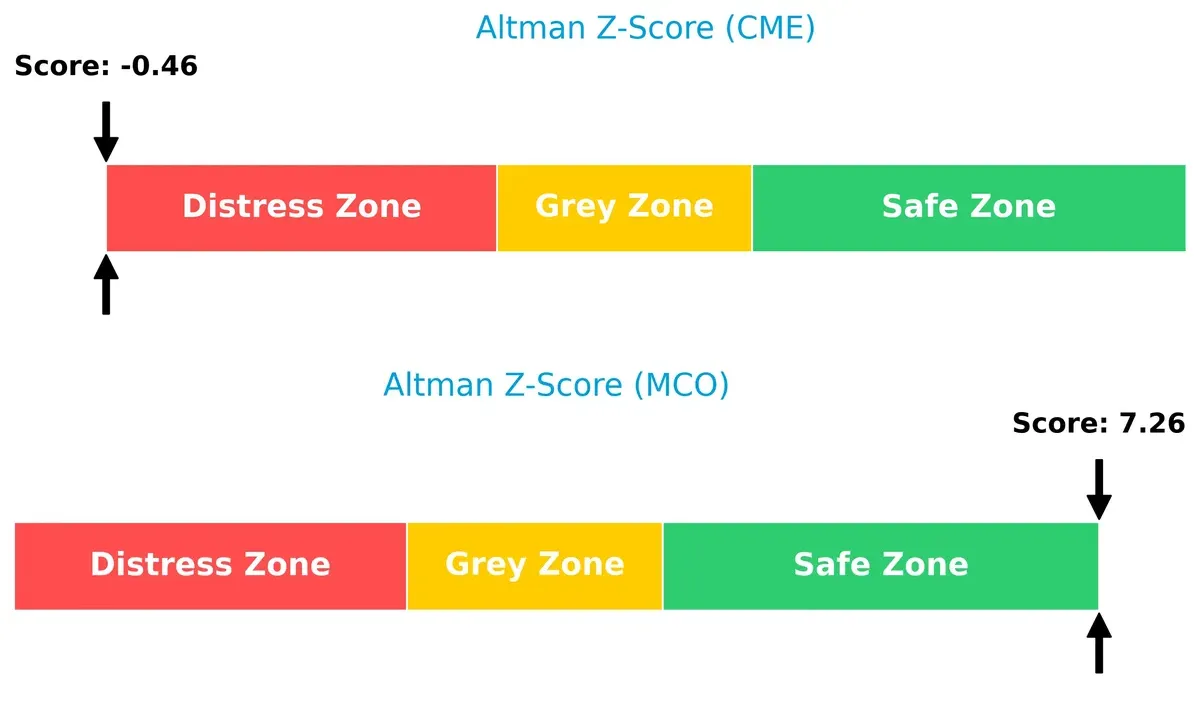
Bankruptcy Risk: Solvency Showdown
Moody’s Altman Z-Score of 7.26 places it well within the safe zone, signaling strong long-term survival prospects. CME’s score of -0.46 flags distress, indicating significant bankruptcy risk in this cycle:
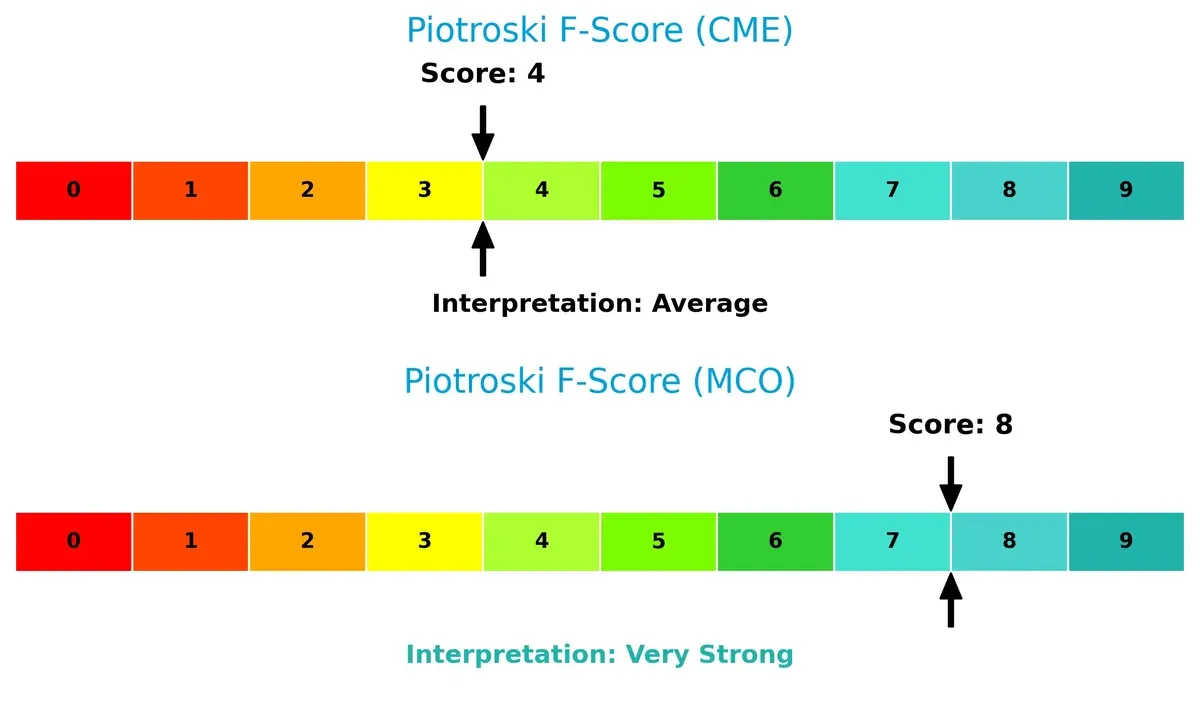
Financial Health: Quality of Operations
Moody’s Piotroski F-Score of 8 signifies very strong financial health with robust internal metrics. CME’s score of 4 is average, raising red flags about operational efficiency and financial quality relative to Moody’s:
How are the two companies positioned?
This section dissects CME and MCO’s operational DNA by comparing revenue distribution and internal dynamics. The goal is to confront their economic moats and identify which model delivers the most resilient competitive advantage today.
Revenue Segmentation: The Strategic Mix
This visual comparison dissects how CME Group Inc. and Moody’s Corporation diversify their income streams and where their primary sector bets lie:
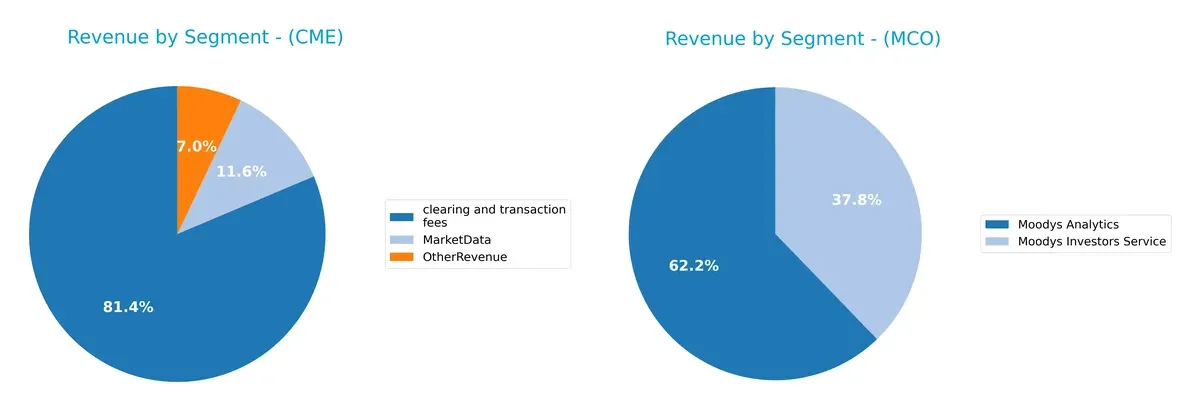
CME Group anchors its revenue in clearing and transaction fees, generating $4.99B in 2024, dwarfing Market Data ($710M) and Other Revenue ($432M). Moody’s posts a more balanced mix with Moody’s Analytics at $4.41B and Moody’s Investors Service at $2.68B. CME’s heavy reliance on one segment signals concentration risk but leverages infrastructure dominance. Moody’s diversified streams reduce risk and pivot on analytics and ratings ecosystems.
Strengths and Weaknesses Comparison
This table compares the Strengths and Weaknesses of CME Group Inc. and Moody’s Corporation:
CME Strengths
- High net margin at 62%
- Low debt-to-assets at 1.72%
- Strong interest coverage at 42x
- Favorable fixed asset turnover at 18
- Stable clearing and transaction fees revenue
MCO Strengths
- Strong ROE at 58%
- High ROIC at 18%
- Good quick ratio at 1.43
- Solid interest coverage at 14x
- Diversified revenue from Analytics and Investors Service segments
CME Weaknesses
- Negative ROIC at -2% signals inefficient capital use
- Zero current and quick ratios raise liquidity concerns
- Unfavorable price-to-book at 3.42
- Low asset turnover at 0.03 limits asset efficiency
- Dividend yield neutral at 1.8%
MCO Weaknesses
- Unfavorable high P/E at 42 and P/B at 24
- Debt-to-equity at 2.17 indicates higher leverage
- Unfavorable asset turnover at 0.46
- Dividend yield weak at 0.7%
- Current ratio only neutral at 1.43
Both companies show slightly favorable overall financial profiles but face distinct challenges. CME’s strength lies in profitability and low leverage but suffers liquidity and capital efficiency issues. Moody’s excels in returns and revenue diversification but bears higher valuation multiples and leverage risks. Each must balance growth ambitions with prudent financial management in their strategy.
The Moat Duel: Analyzing Competitive Defensibility
A structural moat is the only fortress guarding long-term profits from relentless competition erosion. Let’s dissect the moats of two financial stalwarts:
CME Group Inc.: Cost Advantage and Market Infrastructure Moat
CME’s moat stems from its dominant futures exchange network and clearinghouse infrastructure. Its income statement shows exceptional margin stability, but a declining ROIC signals eroding capital efficiency. New derivatives or market expansion could deepen this moat if operational leverage improves by 2026.
Moody’s Corporation: Intangible Assets and Brand Moat
Moody’s moat lies in its trusted credit ratings and analytics brand, creating high switching costs. Unlike CME, Moody’s maintains strong ROIC above WACC, signaling value creation despite a recent slight ROIC decline. Expanding analytics offerings globally could bolster its moat further by 2026.
Infrastructure Dominance vs. Brand Authority: The Moat Battle
Moody’s possesses the wider moat with consistent value creation and strong intangible assets. CME’s eroding ROIC reveals a weakening moat despite operational scale. Moody’s stands better equipped to defend and grow its market share through trusted brand power.
Which stock offers better returns?
Both CME Group Inc. and Moody’s Corporation showed notable price movements over the past year, with CME accelerating bullish momentum and Moody’s exhibiting a more volatile pattern.
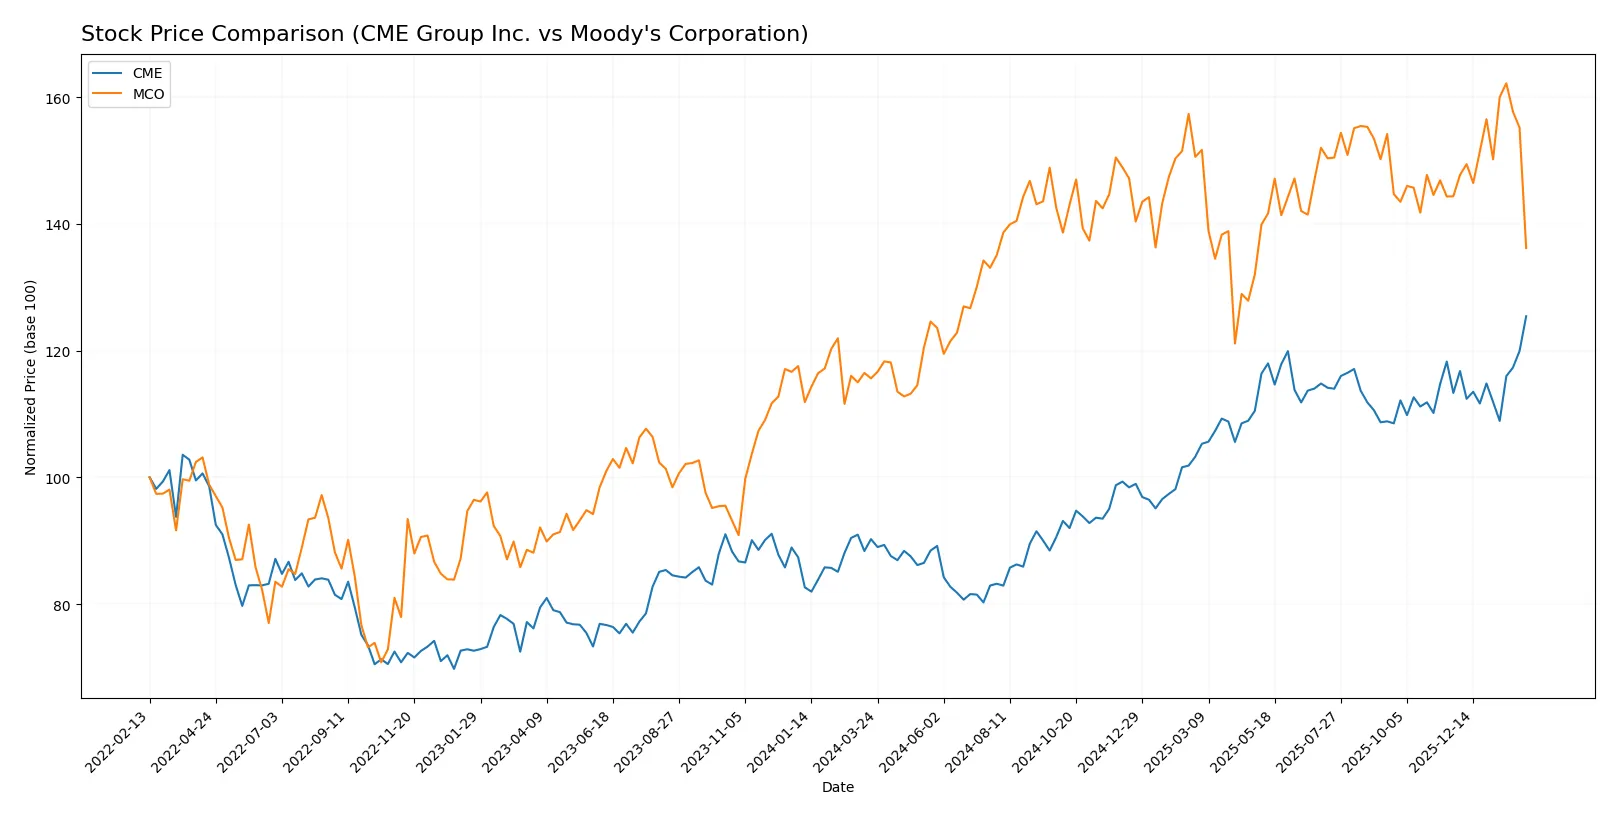
Trend Comparison
CME Group Inc. posted a strong bullish trend with a 38.97% price increase over the past 12 months, showing acceleration and hitting a high of 302.27 with moderate volatility (std dev 29.68).
Moody’s Corporation also trended bullish overall, rising 17.79% with acceleration, but recent months show a 5.66% decline, reflecting short-term weakness despite higher volatility (std dev 39.22).
CME’s 38.97% gain clearly outperforms Moody’s 17.79% over the year, marking CME as the stronger market performer in this period.
Target Prices
Analysts present a confident target consensus for CME Group Inc. and Moody’s Corporation, reflecting bullish expectations.
| Company | Target Low | Target High | Consensus |
|---|---|---|---|
| CME Group Inc. | 300 | 340 | 311.83 |
| Moody’s Corporation | 507 | 620 | 561.3 |
Both companies show target prices well above current market levels, indicating expected upside. CME trades near 302, close to its low target, while Moody’s at 452 suggests significant potential growth.

Don’t Let Luck Decide Your Entry Point
Optimize your entry points with our advanced ProRealTime indicators. You’ll get efficient buy signals with precise price targets for maximum performance. Start outperforming now!
How do institutions grade them?
Institutional grades for CME Group Inc. and Moody’s Corporation reflect recent analyst views:
CME Group Inc. Grades
This table summarizes recent institutional grades for CME Group Inc.:
| Grading Company | Action | New Grade | Date |
|---|---|---|---|
| TD Cowen | Maintain | Buy | 2026-02-05 |
| Morgan Stanley | Maintain | Overweight | 2026-02-05 |
| Barclays | Maintain | Equal Weight | 2026-02-05 |
| JP Morgan | Maintain | Underweight | 2026-02-05 |
| RBC Capital | Maintain | Sector Perform | 2026-02-05 |
Moody’s Corporation Grades
This table summarizes recent institutional grades for Moody’s Corporation:
| Grading Company | Action | New Grade | Date |
|---|---|---|---|
| Wells Fargo | Maintain | Overweight | 2026-01-14 |
| Daiwa Capital | Upgrade | Outperform | 2026-01-13 |
| Morgan Stanley | Maintain | Equal Weight | 2026-01-13 |
| Evercore ISI Group | Maintain | Outperform | 2026-01-08 |
| Stifel | Upgrade | Buy | 2026-01-05 |
Which company has the best grades?
Moody’s Corporation has generally received higher grades, including “Outperform” and “Buy” upgrades. CME’s grades are mixed, with some cautionary ratings like “Underweight.” Investors may interpret Moody’s stronger grades as a signal of greater institutional confidence.
Risks specific to each company
The following categories identify the critical pressure points and systemic threats facing both firms in the 2026 market environment:
1. Market & Competition
CME Group Inc.
- Faces intense competition in futures and options exchanges with pressure from digital platforms.
Moody’s Corporation
- Operates in a competitive credit rating and analytics space with regulatory scrutiny increasing.
2. Capital Structure & Debt
CME Group Inc.
- Maintains a low debt-to-equity ratio (0.12) and strong interest coverage (42x), signaling low financial risk.
Moody’s Corporation
- Carries significantly higher leverage (D/E 2.17) with moderate interest coverage (14x), raising financial risk concerns.
3. Stock Volatility
CME Group Inc.
- Exhibits low beta (0.28), indicating stable price movements relative to the market.
Moody’s Corporation
- Shows high beta (1.44), reflecting greater stock price volatility and market sensitivity.
4. Regulatory & Legal
CME Group Inc.
- Subject to financial market regulations globally, with risks from changes in clearinghouse rules.
Moody’s Corporation
- Faces regulatory pressure on credit rating methodologies and potential legal challenges on ratings accuracy.
5. Supply Chain & Operations
CME Group Inc.
- Operational risk tied to technology infrastructure and clearing systems reliability.
Moody’s Corporation
- Relies heavily on data integrity and advanced analytics platforms, vulnerable to cyber threats.
6. ESG & Climate Transition
CME Group Inc.
- Increasing pressure to integrate ESG data into futures products and clearing services.
Moody’s Corporation
- Must adapt credit models for climate risk, facing scrutiny from investors and regulators.
7. Geopolitical Exposure
CME Group Inc.
- Global operations expose CME to cross-border regulatory changes and trade tensions.
Moody’s Corporation
- Moody’s global ratings business faces risks from geopolitical shifts affecting sovereign and corporate credit.
Which company shows a better risk-adjusted profile?
The most impactful risk for CME Group is its distressed Altman Z-score, signaling financial distress despite operational strengths. Moody’s faces critical risk from its high leverage, amplifying financial vulnerability. Moody’s superior Altman Z-score and Piotroski score indicate a much stronger financial footing. However, Moody’s elevated debt and stock volatility remain key concerns. Overall, Moody’s shows a better risk-adjusted profile, backed by robust profitability and financial health, despite its leverage risks.
Final Verdict: Which stock to choose?
CME Group’s superpower lies in its unmatched operational efficiency and strong cash generation, fueling steady income growth. Yet, its declining ROIC signals a point of vigilance, hinting at potential challenges in capital allocation. It suits portfolios targeting aggressive growth with tolerance for operational risks.
Moody’s moat is anchored in its robust recurring revenue and impressive ROE, reflecting a fortress of value creation despite its higher leverage. Its safer liquidity profile compared to CME makes it appealing for investors favoring stability. Moody’s fits well within GARP portfolios seeking balanced growth and safety.
If you prioritize growth backed by operational excellence and can accept some capital efficiency risk, CME Group stands out as the compelling choice. However, if you seek a stronger economic moat with superior financial stability, Moody’s offers better risk-adjusted stability, albeit at a premium valuation. Each presents a distinct strategic scenario for different investor profiles.
Disclaimer: Investment carries a risk of loss of initial capital. The past performance is not a reliable indicator of future results. Be sure to understand risks before making an investment decision.
Go Further
I encourage you to read the complete analyses of CME Group Inc. and Moody’s Corporation to enhance your investment decisions: