Home > Comparison > Financial Services > CME vs ICE
The strategic rivalry between CME Group Inc. and Intercontinental Exchange, Inc. shapes the evolution of financial data and stock exchanges globally. CME operates as a specialized futures and options marketplace with a streamlined workforce, while ICE combines exchange operations with expansive fixed income and mortgage technology services, employing a significantly larger staff. This analysis pits CME’s focused model against ICE’s diversified platform to identify which offers superior risk-adjusted returns for a balanced portfolio.
Table of contents
Companies Overview
CME Group Inc. and Intercontinental Exchange, Inc. anchor global financial data and trading markets with distinct strategic priorities.
CME Group Inc.: Global Futures & Options Leader
CME Group dominates global futures and options trading with a broad product mix including interest rates, equity indexes, and commodities. Its core revenue relies on contract market operations and clearing services that guarantee trades. In 2026, CME sharpened its focus on expanding market data services to enhance real-time analytics and risk mitigation.
Intercontinental Exchange, Inc.: Diversified Exchange & Data Powerhouse
Intercontinental Exchange operates a wide network of regulated exchanges and clearinghouses across multiple continents. Its revenue engine combines futures and options trading, fixed income data, and a proprietary mortgage origination platform. The company’s 2026 strategy emphasizes integrated data and technology services to deepen market connectivity and expand fixed income analytics.
Strategic Collision: Similarities & Divergences
Both firms prioritize derivatives trading and clearing but differ in scope and approach. CME concentrates on futures and options with a data-centric expansion, while ICE pursues diversification across asset classes and mortgage technology. They battle chiefly in market data services and clearing efficiency. Investors face contrasting profiles: CME offers focused futures market strength; ICE presents multi-asset breadth with scalable platforms.
Income Statement Comparison
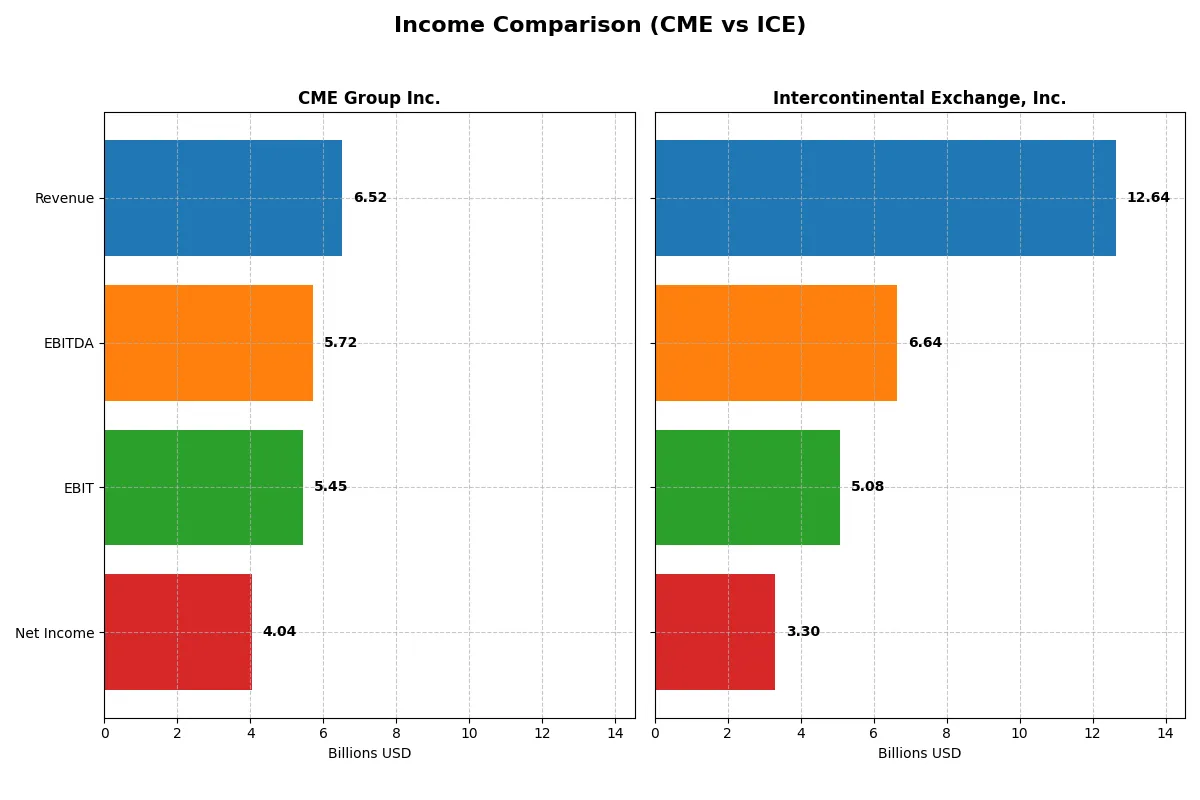
This data dissects the core profitability and scalability of both corporate engines to reveal who dominates the bottom line:
| Metric | CME Group Inc. (CME) | Intercontinental Exchange, Inc. (ICE) |
|---|---|---|
| Revenue | 6.52B | 12.64B |
| Cost of Revenue | 907M | 4.82B |
| Operating Expenses | 1.38B | 2.93B |
| Gross Profit | 5.61B | 7.82B |
| EBITDA | 5.72B | 6.64B |
| EBIT | 5.45B | 5.08B |
| Interest Expense | 130M | 781M |
| Net Income | 4.04B | 3.30B |
| EPS | 11.18 | 5.80 |
| Fiscal Year | 2025 | 2025 |
Income Statement Analysis: The Bottom-Line Duel
This income statement comparison reveals which corporate engine delivers superior efficiency and profitability through the latest fiscal results and margin trends.
CME Group Inc. Analysis
CME Group’s revenue rose steadily from 4.7B in 2021 to 6.5B in 2025, with net income climbing from 2.6B to 4.0B. Its gross margin remains robust at 86%, and net margin impresses at 62%. The 2025 results show accelerating EBIT growth (+15.8%) and EPS improvement (+15.4%), signaling strong operational momentum and cost control.
Intercontinental Exchange, Inc. Analysis
ICE’s revenue expanded from 9.2B in 2021 to 12.6B in 2025, with net income rising to 3.3B after a dip earlier in the period. Gross margin stays healthy at 62%, but net margin at 26% trails CME significantly. Despite a 7.5% revenue increase in 2025, operating expenses grew faster, slightly weakening margin expansion and efficiency gains.
Margin Dominance vs. Revenue Scale
CME outperforms ICE with superior margin profiles and faster net income growth, reflecting stronger cost discipline and profitability. ICE boasts higher top-line scale but suffers from higher expenses and weaker net margin expansion. Investors prioritizing margin strength and earnings growth will find CME’s profile more compelling.
Financial Ratios Comparison
These vital ratios act as a diagnostic tool to expose the underlying fiscal health, valuation premiums, and capital efficiency of the companies compared below:
| Ratios | CME Group Inc. (CME) | Intercontinental Exchange, Inc. (ICE) |
|---|---|---|
| ROE | 14.08% | 11.40% |
| ROIC | -2.01% | 7.02% |
| P/E | 24.28 | 27.99 |
| P/B | 3.42 | 3.19 |
| Current Ratio | 0 (2025 est.) | 1.02 |
| Quick Ratio | 0 (2025 est.) | 1.02 |
| D/E | 0.12 | 0.72 |
| Debt-to-Assets | 1.72% | 15.31% |
| Interest Coverage | 32.61 | 6.27 |
| Asset Turnover | 0.03 | 0.09 |
| Fixed Asset Turnover | 17.98 | 4.70 |
| Payout ratio | 44.46% | 33.44% |
| Dividend yield | 1.83% | 1.19% |
| Fiscal Year | 2025 | 2025 |
Efficiency & Valuation Duel: The Vital Signs
Ratios act as a company’s DNA, revealing hidden risks and operational excellence behind headline figures.
CME Group Inc.
CME shows strong profitability with a 14.08% ROE and a robust 62.02% net margin, signaling operational efficiency. Its P/E of 24.28 is fairly valued, though a PB of 3.42 flags a stretched balance sheet. CME returns value via a 1.83% dividend yield, reflecting stable cash flow despite an unfavorable ROIC.
Intercontinental Exchange, Inc.
ICE posts a modest 11.4% ROE and a lower 26.14% net margin, indicating less margin strength. Its P/E of 28.0 appears expensive, while a PB near 3.19 suggests valuation pressure. ICE maintains shareholder returns with a 1.19% dividend but carries higher debt, reflected in a neutral debt/equity ratio of 0.72.
Margin Strength vs. Valuation Discipline
CME offers superior margin efficiency and a balanced valuation, though ROIC concerns warrant caution. ICE balances moderate returns with higher leverage and stretched valuation. Risk-tolerant investors may prefer ICE’s growth profile, while those favoring operational safety will find CME’s profile more fitting.
Which one offers the Superior Shareholder Reward?
I compare CME Group Inc. and Intercontinental Exchange, Inc. on dividends and buybacks. CME yields 4.3% with a payout ratio around 100%, showing strong free cash flow coverage and a consistent dividend hike. ICE offers a modest 1.2% yield with a conservative 33% payout ratio, indicating room for reinvestment or buybacks. Both execute buybacks, but CME’s higher payout and steady cash flow support a more sustainable distribution. ICE’s lower payout preserves capital for growth but limits immediate income. For 2026 investors seeking total return, CME’s balanced yield and buyback intensity deliver superior shareholder reward.
Comparative Score Analysis: The Strategic Profile
The radar chart reveals the fundamental DNA and trade-offs of CME Group Inc. and Intercontinental Exchange, Inc.:
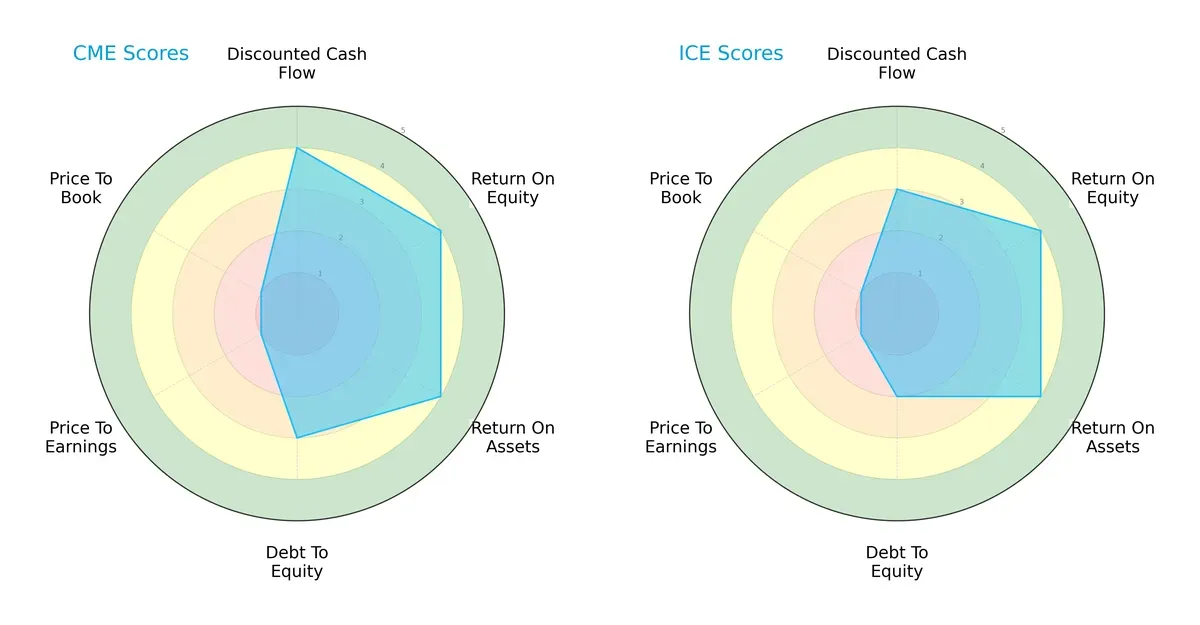
CME leads in discounted cash flow with a score of 4 versus ICE’s 3, signaling stronger future cash generation. Both match on return on equity and assets at 4, reflecting efficient profit and asset use. CME’s debt-to-equity score of 3 outperforms ICE’s 2, indicating a more balanced leverage profile. Both suffer on valuation metrics, scoring 1 in P/E and P/B, suggesting market skepticism or overvaluation. Overall, CME shows a more balanced financial profile, while ICE relies more heavily on operational efficiency.
Bankruptcy Risk: Solvency Showdown
The Altman Z-Scores place both CME (-0.46) and ICE (0.97) in the distress zone, implying elevated bankruptcy risk amid current market volatility:
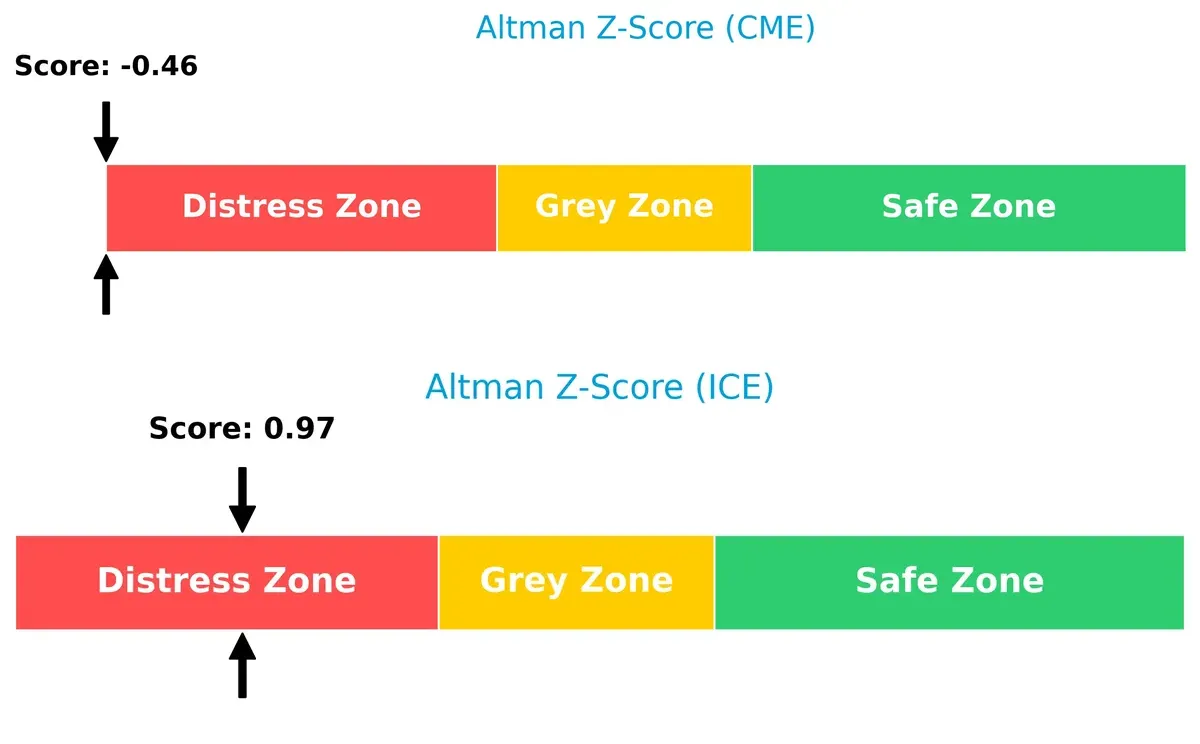
CME’s deeper negative score signals more acute financial distress. ICE, while still in distress, shows marginally better solvency, indicating slightly stronger resilience in this challenging cycle.
Financial Health: Quality of Operations
Piotroski F-Scores reveal stark contrasts in financial health and operational quality between CME (4) and ICE (8):
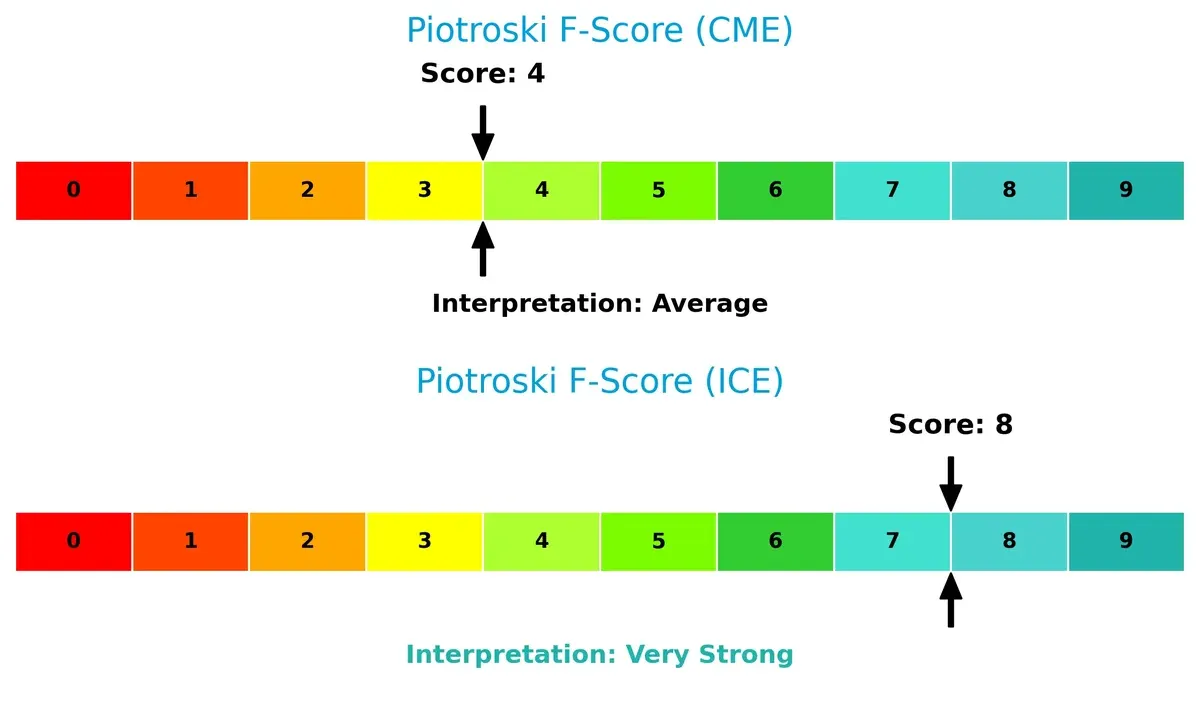
ICE’s very strong score of 8 highlights robust profitability, liquidity, and efficiency metrics. CME’s average score of 4 raises red flags around internal financial controls and operational effectiveness. Investors should view ICE as the safer bet for structural financial strength.
How are the two companies positioned?
This section dissects CME and ICE’s operational DNA by comparing their revenue distribution and internal strengths and weaknesses. The goal is to confront their economic moats and identify which business model offers the most resilient competitive advantage today.
Revenue Segmentation: The Strategic Mix
This visual comparison dissects how CME Group Inc. and Intercontinental Exchange, Inc. diversify their income streams and where their primary sector bets lie:
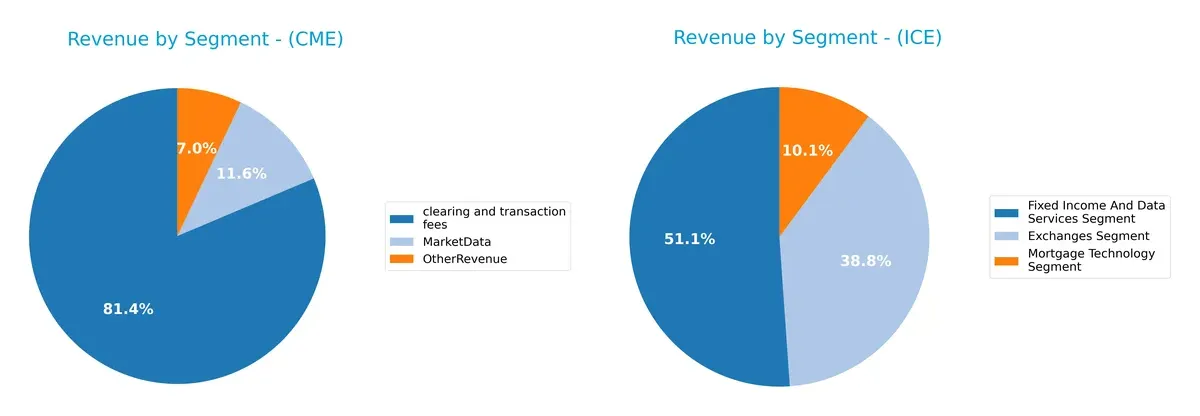
CME anchors its revenue in clearing and transaction fees, generating $4.99B in 2024, dwarfing MarketData at $710M and OtherRevenue at $432M. ICE shows a more balanced mix: $1.35B from Fixed Income and Data Services, $1.03B from Exchanges, and $269M in Mortgage Technology in 2025. CME’s concentration signals infrastructure dominance but heightens concentration risk. ICE’s diversified segments mitigate risk and support ecosystem lock-in through varied offerings.
Strengths and Weaknesses Comparison
This table compares the strengths and weaknesses of CME Group Inc. and Intercontinental Exchange, Inc.:
CME Strengths
- High net margin of 62% demonstrates strong profitability
- Low debt-to-assets ratio at 1.7% indicates conservative leverage
- Very high interest coverage of 41.98 times reduces default risk
- Strong fixed asset turnover at 17.98 reflects efficient asset use
ICE Strengths
- Diversified revenue streams across Exchanges, Fixed Income, and Mortgage Technology
- Balanced global presence with significant revenues from the US and Europe
- Favorable WACC supports capital efficiency
- Solid interest coverage at 6.51 times maintains financial stability
- Reasonable quick ratio of 1.02 supports liquidity
CME Weaknesses
- Negative ROIC at -2% signals poor capital returns
- Unfavorable current and quick ratios suggest liquidity risks
- Low asset turnover at 0.03 implies inefficient asset use
- Unfavorable price-to-book ratio of 3.42 may indicate overvaluation
ICE Weaknesses
- Higher debt-to-equity ratio at 0.72 signals increased leverage
- Unfavorable PE ratio of 28 could reflect expensive valuation
- Asset turnover remains low at 0.09, limiting operational efficiency
CME excels in profitability and conservative leverage but struggles with capital returns and liquidity metrics. ICE benefits from diversified revenue and global reach but carries higher leverage and valuation risks. Each company’s financial profile suggests different strategic priorities and risk exposures.
The Moat Duel: Analyzing Competitive Defensibility
A structural moat is the fortress protecting long-term profits from relentless competition and market erosion. Here’s how CME Group and Intercontinental Exchange defend their turf:
CME Group Inc.: Intangible Assets and Market Dominance
CME’s moat stems from deep intangible assets and regulatory licenses that secure market share. Despite strong gross margins near 86%, its ROIC has sharply declined, signaling weakening capital efficiency in 2026. New derivatives and data services could bolster this moat if execution improves.
Intercontinental Exchange, Inc.: Network Effects and Diversification
ICE leverages broad network effects through multiple exchanges and data platforms, contrasting CME’s narrower footprint. Its margin profile is weaker but improving ROIC suggests growing operational efficiency. Expansion into mortgage technology and fixed income markets may deepen its competitive edge in 2026.
The Moat Battle: Intangible Fortress vs. Network Expansion
CME boasts a wider moat with superior margins but suffers a steep ROIC decline, indicating eroding capital returns. ICE’s moat is narrower but shows improving profitability and growth potential. ICE is better positioned to defend and expand market share amid evolving industry dynamics.
Which stock offers better returns?
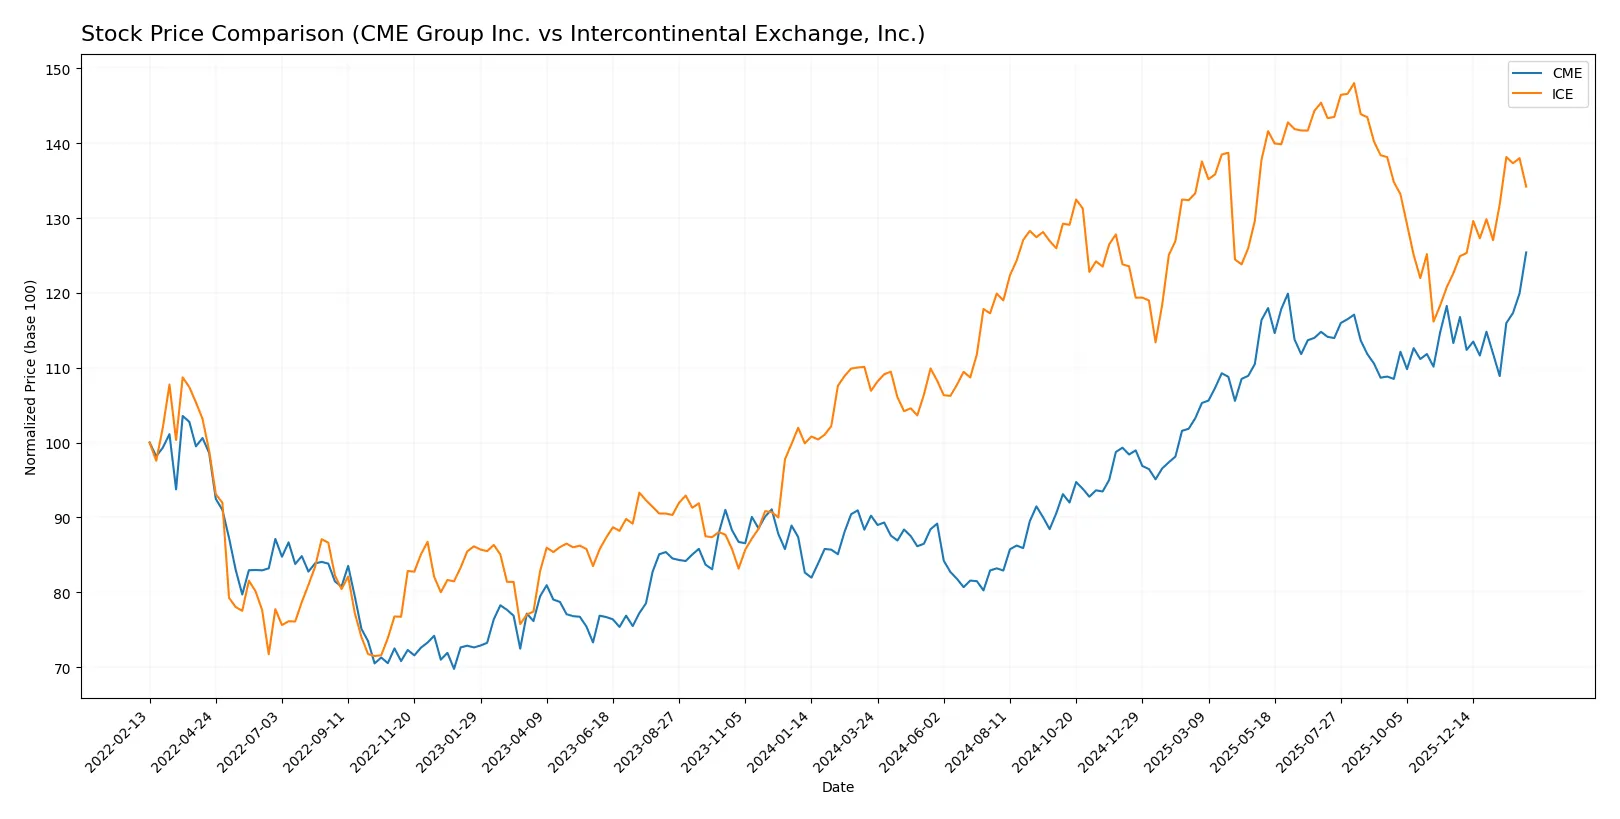
Both CME Group Inc. and Intercontinental Exchange, Inc. display strong upward momentum, with notable price gains and acceleration in trading activity over the past 12 months.
Trend Comparison
CME Group Inc. shows a 38.97% price increase over the past year, reflecting a bullish trend with accelerating momentum and high volatility between $193.43 and $302.27.
Intercontinental Exchange, Inc. gained 25.52% in the same period, also bullish with accelerating trend and less volatility, ranging from $130.50 to $186.40.
CME Group outperformed ICE with a higher total return and stronger acceleration, delivering the most robust market performance over the last 12 months.
Target Prices
Analysts show a bullish consensus for both CME Group and Intercontinental Exchange with solid upside potential.
| Company | Target Low | Target High | Consensus |
|---|---|---|---|
| CME Group Inc. | 300 | 340 | 311.83 |
| Intercontinental Exchange, Inc. | 180 | 211 | 192.33 |
The consensus target for CME Group sits about 3% above the current price of 302.27, signaling modest upside. Intercontinental Exchange’s target consensus exceeds the current 169 price by roughly 14%, indicating stronger expected appreciation.

Don’t Let Luck Decide Your Entry Point
Optimize your entry points with our advanced ProRealTime indicators. You’ll get efficient buy signals with precise price targets for maximum performance. Start outperforming now!
How do institutions grade them?
Here is a summary of recent institutional grades for CME Group Inc. and Intercontinental Exchange, Inc.:
CME Group Inc. Grades
The following table presents recent grades from reputable grading firms for CME Group Inc.:
| Grading Company | Action | New Grade | Date |
|---|---|---|---|
| TD Cowen | Maintain | Buy | 2026-02-05 |
| Morgan Stanley | Maintain | Overweight | 2026-02-05 |
| Barclays | Maintain | Equal Weight | 2026-02-05 |
| JP Morgan | Maintain | Underweight | 2026-02-05 |
| RBC Capital | Maintain | Sector Perform | 2026-02-05 |
Intercontinental Exchange, Inc. Grades
The following table presents recent grades from reputable grading firms for Intercontinental Exchange, Inc.:
| Grading Company | Action | New Grade | Date |
|---|---|---|---|
| Barclays | Maintain | Overweight | 2026-02-06 |
| Morgan Stanley | Maintain | Equal Weight | 2026-01-15 |
| Piper Sandler | Maintain | Overweight | 2026-01-14 |
| TD Cowen | Maintain | Buy | 2026-01-14 |
| UBS | Maintain | Buy | 2026-01-07 |
Which company has the best grades?
Intercontinental Exchange, Inc. generally receives more Overweight and Buy grades from top firms, indicating stronger institutional sentiment. CME Group shows a wider range from Buy to Underweight, which may suggest more cautious investor views. This divergence could affect investor confidence and portfolio positioning.
Risks specific to each company
The following categories identify critical pressure points and systemic threats facing both CME Group Inc. and Intercontinental Exchange, Inc. in the 2026 market environment:
1. Market & Competition
CME Group Inc.
- Dominates global futures markets with strong clearing services but faces intense pressure from fintech innovation.
Intercontinental Exchange, Inc.
- Diverse exchange and data services portfolio but competes aggressively in mortgage technology and international markets.
2. Capital Structure & Debt
CME Group Inc.
- Exhibits a low debt-to-equity ratio (0.12), indicating conservative leverage and strong balance sheet discipline.
Intercontinental Exchange, Inc.
- Higher leverage (0.72 debt-to-equity) raises financial risk, though interest coverage remains adequate at 6.51x.
3. Stock Volatility
CME Group Inc.
- Low beta of 0.28 signals stability and lower market sensitivity, appealing to risk-averse investors.
Intercontinental Exchange, Inc.
- Beta near 1.03 indicates market-aligned volatility, exposing shareholders to broader equity swings.
4. Regulatory & Legal
CME Group Inc.
- Operates under heavy financial regulation but benefits from established compliance frameworks.
Intercontinental Exchange, Inc.
- Faces complex regulatory environments globally, especially in EU and mortgage sectors, increasing compliance costs.
5. Supply Chain & Operations
CME Group Inc.
- Relies on technology infrastructure for clearing; operational efficiency is critical but vulnerable to cyber risks.
Intercontinental Exchange, Inc.
- Broader operational scope with mortgage tech adds complexity and potential integration challenges.
6. ESG & Climate Transition
CME Group Inc.
- ESG initiatives less visible; energy and commodity derivatives may expose it to climate-related transition risks.
Intercontinental Exchange, Inc.
- More diversified services allow better ESG adaptation, but mortgage tech sector may face scrutiny on sustainability.
7. Geopolitical Exposure
CME Group Inc.
- Primarily US-focused, limiting geopolitical risk but also growth opportunities abroad.
Intercontinental Exchange, Inc.
- Operates in multiple jurisdictions, increasing geopolitical risk but offering geographic diversification.
Which company shows a better risk-adjusted profile?
CME Group’s biggest risk is its negative ROIC, signaling inefficient capital use despite strong margins. ICE’s main concern lies in its higher leverage and regulatory complexity. CME’s low beta and conservative capital structure offer superior risk-adjusted stability. However, both show financial distress signs via Altman Z-scores, warranting caution. Recent ratio trends emphasize CME’s operational fragility, while ICE’s mortgage tech expansion entails integration risks. Overall, CME presents a slightly better risk-adjusted profile for conservative investors in 2026.
Final Verdict: Which stock to choose?
CME Group Inc. stands out as a cash-generating powerhouse with exceptional operational efficiency and a strong track record of margin expansion. Its main point of vigilance lies in a troubling trend of declining return on invested capital, signaling potential value destruction in the long run. CME fits well within an aggressive growth portfolio focused on capitalizing on market leadership.
Intercontinental Exchange, Inc. boasts a strategic moat rooted in its recurring revenue streams and robust income quality. Despite higher leverage, it offers a comparatively safer profile with improving profitability trends. ICE appeals to investors seeking growth at a reasonable price, emphasizing stability alongside moderate expansion potential.
If you prioritize operational excellence and rapid earnings growth, CME emerges as the compelling choice due to its superior margin profile and cash flow strength. However, if you seek a balance between growth and financial resilience, ICE offers better stability and a gradually improving moat, albeit at a modest premium. Both present analytical scenarios worth considering depending on your risk tolerance and investment horizon.
Disclaimer: Investment carries a risk of loss of initial capital. The past performance is not a reliable indicator of future results. Be sure to understand risks before making an investment decision.
Go Further
I encourage you to read the complete analyses of CME Group Inc. and Intercontinental Exchange, Inc. to enhance your investment decisions: