Home > Comparison > Financial Services > CME vs FDS
The strategic rivalry between CME Group Inc. and FactSet Research Systems Inc. shapes the Financial Services sector’s evolution. CME operates a capital-intensive exchange platform focused on futures and options trading worldwide. FactSet delivers high-margin, integrated financial data and analytics solutions to investment professionals. This clash highlights a contest between robust market infrastructure and cutting-edge data services. This analysis will reveal which business model offers superior risk-adjusted returns for a diversified portfolio in 2026.

Table of contents
Companies Overview
CME Group Inc. and FactSet Research Systems Inc. hold pivotal roles in financial data and market services.
CME Group Inc.: Global Futures and Options Exchange Leader
CME Group Inc. dominates as a contract market operator for futures and options worldwide. Its core revenue stems from transaction fees on interest rates, equity indexes, and commodities. In 2026, CME emphasizes expanding clearing house services and enhancing real-time market data offerings to fortify its infrastructure and risk management capabilities.
FactSet Research Systems Inc.: Premier Financial Data and Analytics Provider
FactSet Research Systems Inc. specializes in integrated financial data and analytics. It generates revenues by delivering workflow solutions for research, trading, and wealth management across global markets. The company focuses on refining its content and technology platforms to boost user insight and operational efficiency in 2026.
Strategic Collision: Similarities & Divergences
CME and FactSet both serve financial professionals but diverge sharply in business models. CME operates a transaction-based exchange ecosystem emphasizing clearing and risk mitigation. FactSet offers a subscription-based analytics platform prioritizing data integration and workflow. They compete at the intersection of market intelligence and execution, presenting distinct risk-return profiles for investors seeking exposure to market infrastructure versus financial technology services.
Income Statement Comparison
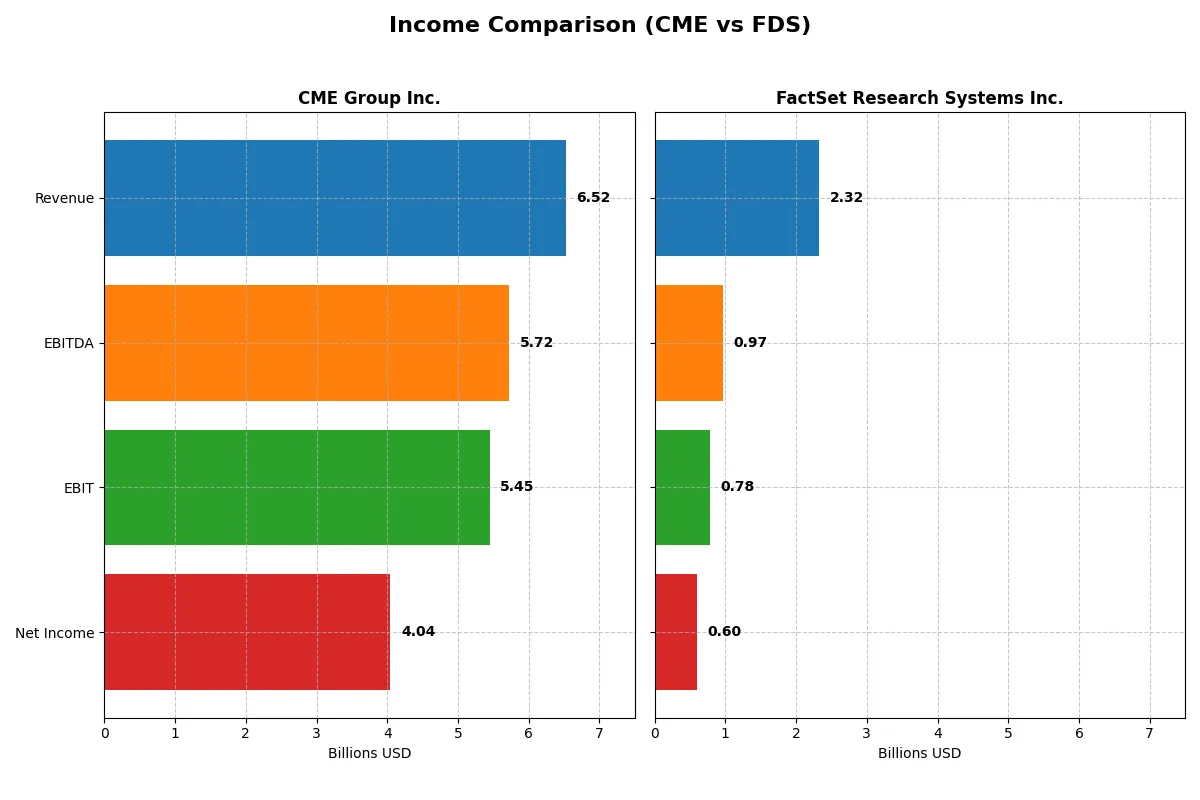
This data dissects the core profitability and scalability of both corporate engines to reveal who dominates the bottom line:
| Metric | CME Group Inc. (CME) | FactSet Research Systems Inc. (FDS) |
|---|---|---|
| Revenue | 6.52B | 2.32B |
| Cost of Revenue | 907M | 1.10B |
| Operating Expenses | 1.38B | 476M |
| Gross Profit | 5.61B | 1.22B |
| EBITDA | 5.72B | 966M |
| EBIT | 5.45B | 777M |
| Interest Expense | 130M | 56M |
| Net Income | 4.04B | 597M |
| EPS | 11.18 | 15.74 |
| Fiscal Year | 2025 | 2025 |
Income Statement Analysis: The Bottom-Line Duel
This income statement comparison reveals which company drives superior profitability and operational efficiency through their revenue and cost management.
CME Group Inc. Analysis
CME Group’s revenue grew steadily from $4.7B in 2021 to $6.5B in 2025, with net income surging from $2.6B to $4B. Its gross margin remains robust at 86%, while net margin expanded to 62%, signaling exceptional cost control and pricing power. In 2025, CME accelerated EBIT by 16%, highlighting strong operational momentum.
FactSet Research Systems Inc. Analysis
FactSet increased revenue from $1.6B in 2021 to $2.3B in 2025, with net income rising from $400M to $597M. Its gross margin stands lower at 53%, and net margin reached 26%, reflecting a less efficient cost structure. Despite this, FactSet posted solid 12% EPS growth last year, showing promising profit expansion amid moderate revenue gains.
Margin Dominance vs. Growth Efficiency
CME Group dominates with superior margins and higher absolute profits, driven by efficient cost management and scale. FactSet delivers respectable growth but trails on profitability metrics. Investors seeking steady, high-margin cash flows may favor CME’s profile, while those prioritizing growth potential might watch FactSet’s momentum closely.
Financial Ratios Comparison
These vital ratios act as a diagnostic tool to expose the underlying fiscal health, valuation premiums, and capital efficiency:
| Ratios | CME Group Inc. (CME) | FactSet Research Systems Inc. (FDS) |
|---|---|---|
| ROE | 14.1% | 27.3% |
| ROIC | 8.5% | 16.1% |
| P/E | 24.3 | 23.7 |
| P/B | 3.42 | 6.48 |
| Current Ratio | 1.01 | 1.40 |
| Quick Ratio | 1.01 | 1.40 |
| D/E | 0.13 | 0.71 |
| Debt-to-Assets | 2.4% | 36.2% |
| Interest Coverage | 24.4 | 13.3 |
| Asset Turnover | 0.045 | 0.54 |
| Fixed Asset Turnover | 15.9 | 11.2 |
| Payout ratio | 102% | 27% |
| Dividend yield | 4.3% | 1.1% |
| Fiscal Year | 2025 | 2025 |
Efficiency & Valuation Duel: The Vital Signs
Financial ratios serve as a company’s DNA, uncovering hidden risks and operational strengths crucial for investment decisions.
CME Group Inc.
CME shows solid profitability with a 14.08% ROE and a commanding 62.02% net margin, signaling operational strength. The P/E of 24.28 is fairly valued, but a high P/B ratio of 3.42 suggests some valuation stretch. Shareholders receive a modest 1.83% dividend yield, reflecting balanced capital return.
FactSet Research Systems Inc.
FactSet delivers superior profitability, boasting a 27.31% ROE and a 25.72% net margin, demonstrating efficient capital use. Its P/E near 23.71 appears reasonable despite an elevated P/B of 6.48. FactSet maintains a 1.13% dividend yield, while reinvesting heavily in R&D to fuel growth and innovation.
Valuation Discipline Meets Operational Excellence
FactSet offers higher returns on equity and invested capital with fewer unfavorable ratios, indicating robust operational efficiency. CME balances a higher net margin with a more conservative debt profile, yet valuation metrics show some stretch. Investors seeking growth may prefer FactSet’s dynamic profile; those favoring steady dividends might lean toward CME.
Which one offers the Superior Shareholder Reward?
I compare CME Group and FactSet’s shareholder reward by analyzing dividends, payout ratios, and buyback intensity. CME yields 4.3% with a payout near 100%, backed by strong free cash flow. FactSet yields 1.1%, with a 27% payout, focusing on growth reinvestment. Both run buybacks, but CME’s model balances yield and buybacks more sustainably. I see CME’s distribution as more attractive for total return in 2026 due to its mix of income and capital return, while FactSet’s lower yield and higher leverage pose risks despite growth focus.
Comparative Score Analysis: The Strategic Profile
The radar chart reveals the fundamental DNA and trade-offs of CME Group Inc. and FactSet Research Systems Inc., highlighting their strategic financial profiles:
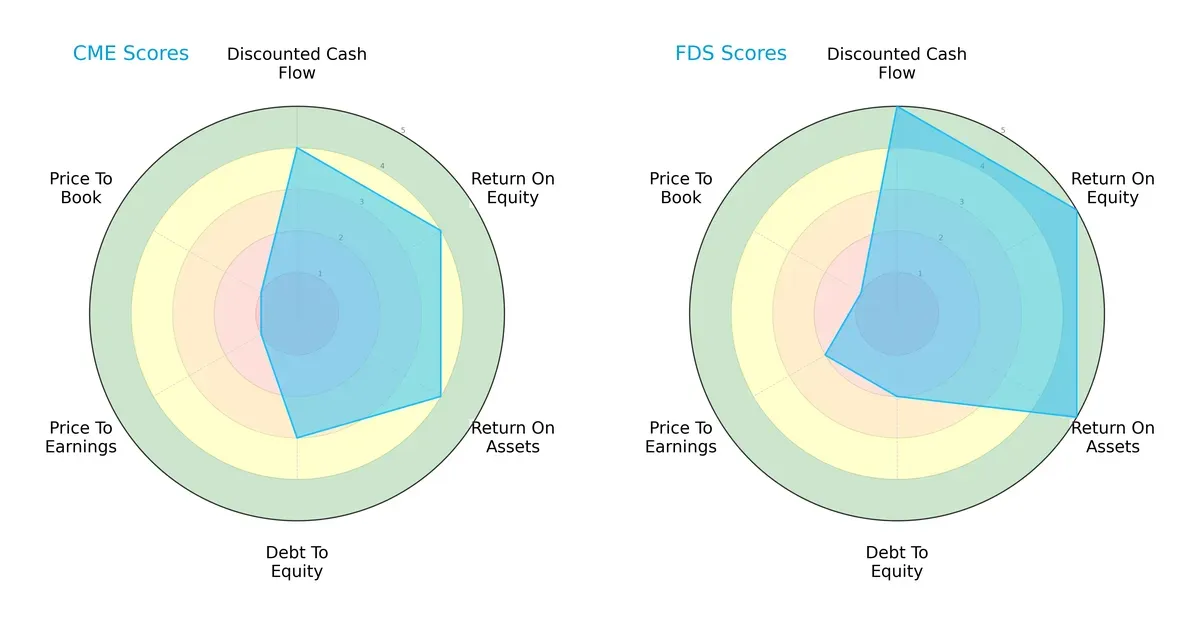
FactSet leads with a more balanced and robust profile, scoring very favorably in DCF, ROE, and ROA, reflecting superior profitability and asset efficiency. CME shows moderate strength but relies more on its moderate debt-to-equity position. Both firms face valuation challenges, with low P/E and P/B scores, but CME’s valuation scores are notably weaker. FactSet’s edge lies in operational efficiency, while CME holds a steadier leverage position.
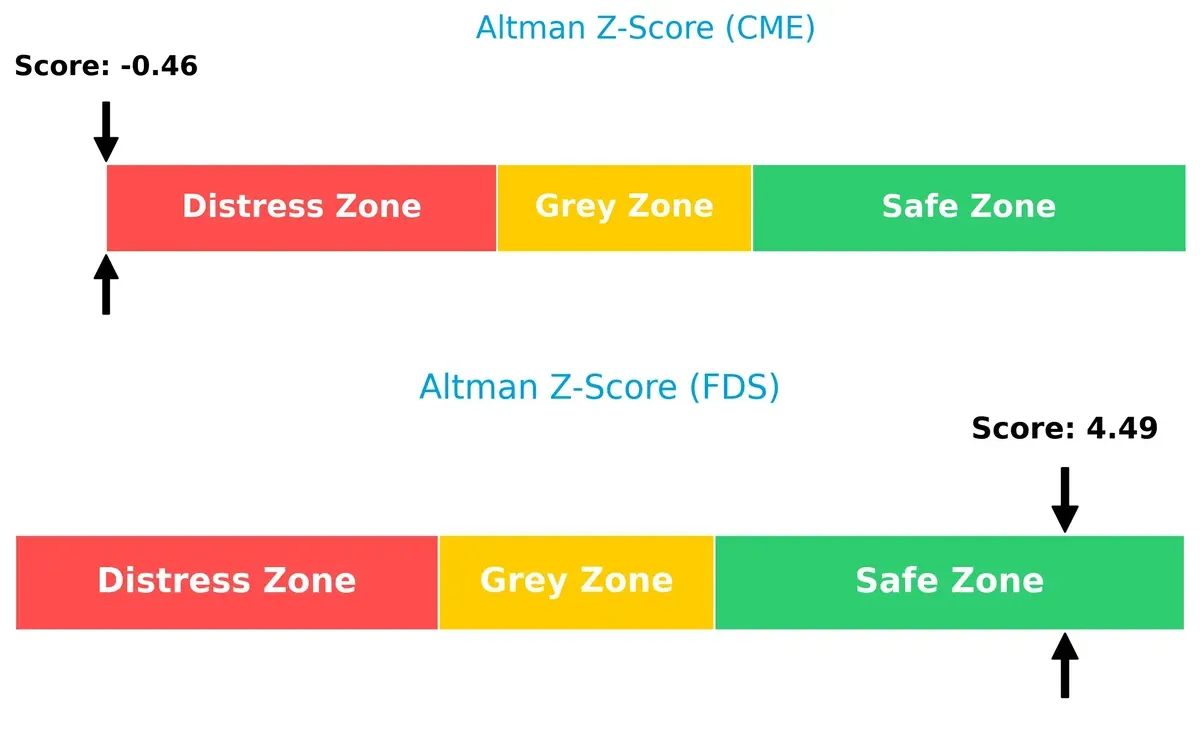
Bankruptcy Risk: Solvency Showdown
FactSet’s Altman Z-Score (4.49) places it firmly in the safe zone, signaling strong financial stability. CME’s score (-0.46) lands in the distress zone, indicating significant bankruptcy risk in this cycle:
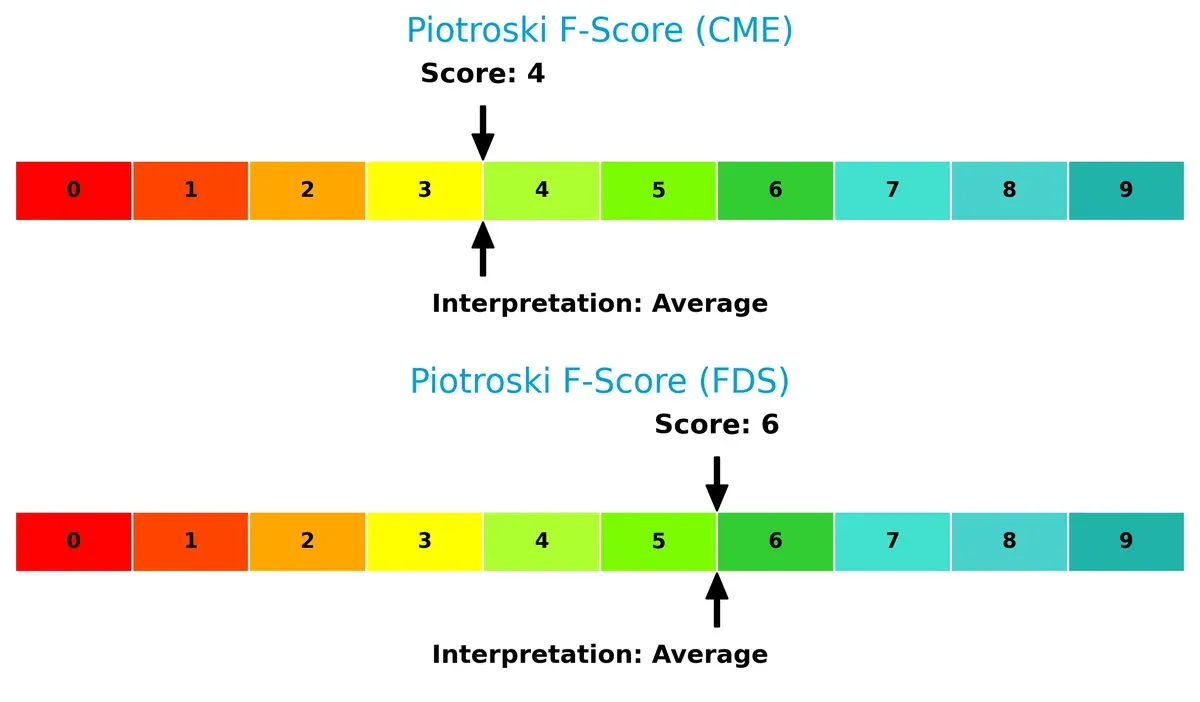
Financial Health: Quality of Operations
FactSet’s Piotroski F-Score of 6 surpasses CME’s 4, suggesting better operational quality and fewer red flags. Both firms are average, but CME’s internal metrics warrant caution compared to FactSet’s stronger financial health:
How are the two companies positioned?
This section dissects CME and FDS’s operational DNA by comparing revenue distribution and internal dynamics. Its goal is to confront their economic moats to reveal which model offers the most resilient competitive advantage today.
Revenue Segmentation: The Strategic Mix
This comparison dissects how CME Group and FactSet diversify their income streams and reveals where their primary sector bets lie:
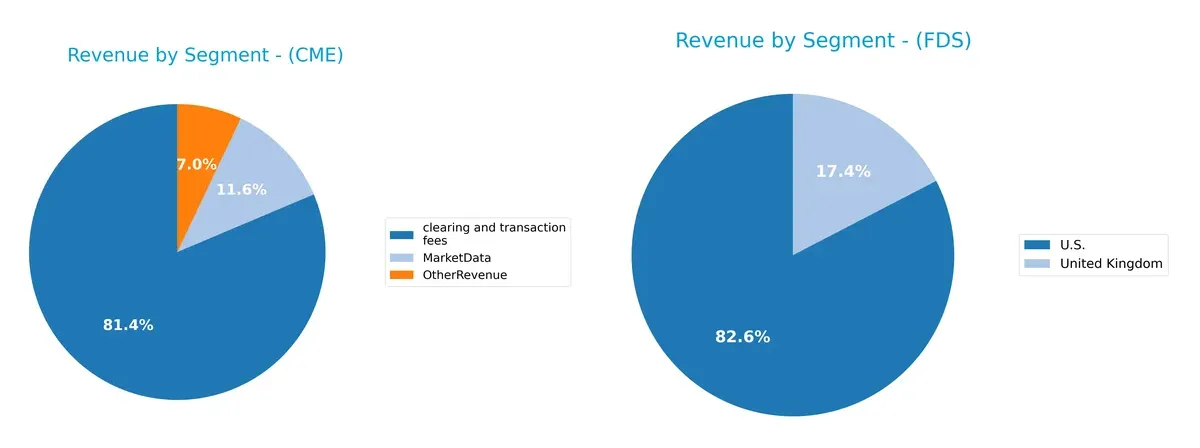
CME Group’s revenue anchors heavily on clearing and transaction fees, reaching $4.99B in 2024, dwarfing its $710M Market Data and $432M Other Revenue. This concentration highlights CME’s infrastructure dominance in derivatives markets. FactSet, by contrast, shows a geographic split with $498M from the U.S. and $105M from the U.K., indicating a more diversified regional exposure. CME’s focus carries higher concentration risk, while FactSet pivots on broader market coverage.
Strengths and Weaknesses Comparison
This table compares the strengths and weaknesses of CME and FDS across key financial and strategic metrics:
CME Strengths
- High net margin at 62%
- Very low debt-to-assets at 1.7%
- Strong interest coverage at 42x
- Favorable fixed asset turnover at 18x
- Large revenue base from clearing and transaction fees
FDS Strengths
- Strong ROE at 27% and ROIC at 16%
- Favorable net margin at 26%
- Healthy quick ratio at 1.4
- Favorable fixed asset turnover at 11x
- Global revenue presence especially in US, UK, and Europe
CME Weaknesses
- Negative ROIC at -2% indicating poor capital returns
- Unfavorable liquidity ratios at zero
- Low asset turnover at 0.03
- Unfavorable price-to-book ratio at 3.4
FDS Weaknesses
- Higher debt-to-assets at 36%
- Unfavorable price-to-book ratio at 6.5
- Neutral current ratio at 1.4
- Moderate asset turnover at 0.54
CME excels in profitability and low leverage but faces challenges in capital efficiency and liquidity. FDS shows robust returns on capital and diversified global revenue but carries higher leverage and weaker valuation metrics. These contrasts highlight different strategic priorities and risk profiles for each company.
The Moat Duel: Analyzing Competitive Defensibility
A structural moat is the only true defense against the relentless erosion of profits by competition. Let’s dissect how two firms protect their turf:
CME Group Inc.: Network Effects and Clearing Dominance
CME’s moat stems from its unmatched network effects and clearinghouse monopoly. This translates to stable, high margins above 60%, despite a recent decline in ROIC that threatens future profitability in 2026.
FactSet Research Systems Inc.: Intangible Assets and Subscription Lock-in
FactSet leans on deep intangible assets and sticky subscription models, generating solid margins near 26%. Its ROIC comfortably exceeds WACC, signaling value creation but facing modest profitability pressure ahead.
Verdict: Clearing Monopoly vs. Data Intelligence Moats
FactSet’s intangible asset moat is deeper and more efficient, with ROIC surpassing WACC by nearly 10%. CME’s network dominance is strong but currently losing value. FactSet appears better positioned to defend its market share in 2026.
Which stock offers better returns?
Over the past year, CME Group Inc. surged nearly 39%, showing strong upward momentum and accelerating gains. FactSet Research Systems Inc. declined sharply by 56%, with a clear decelerating downtrend.
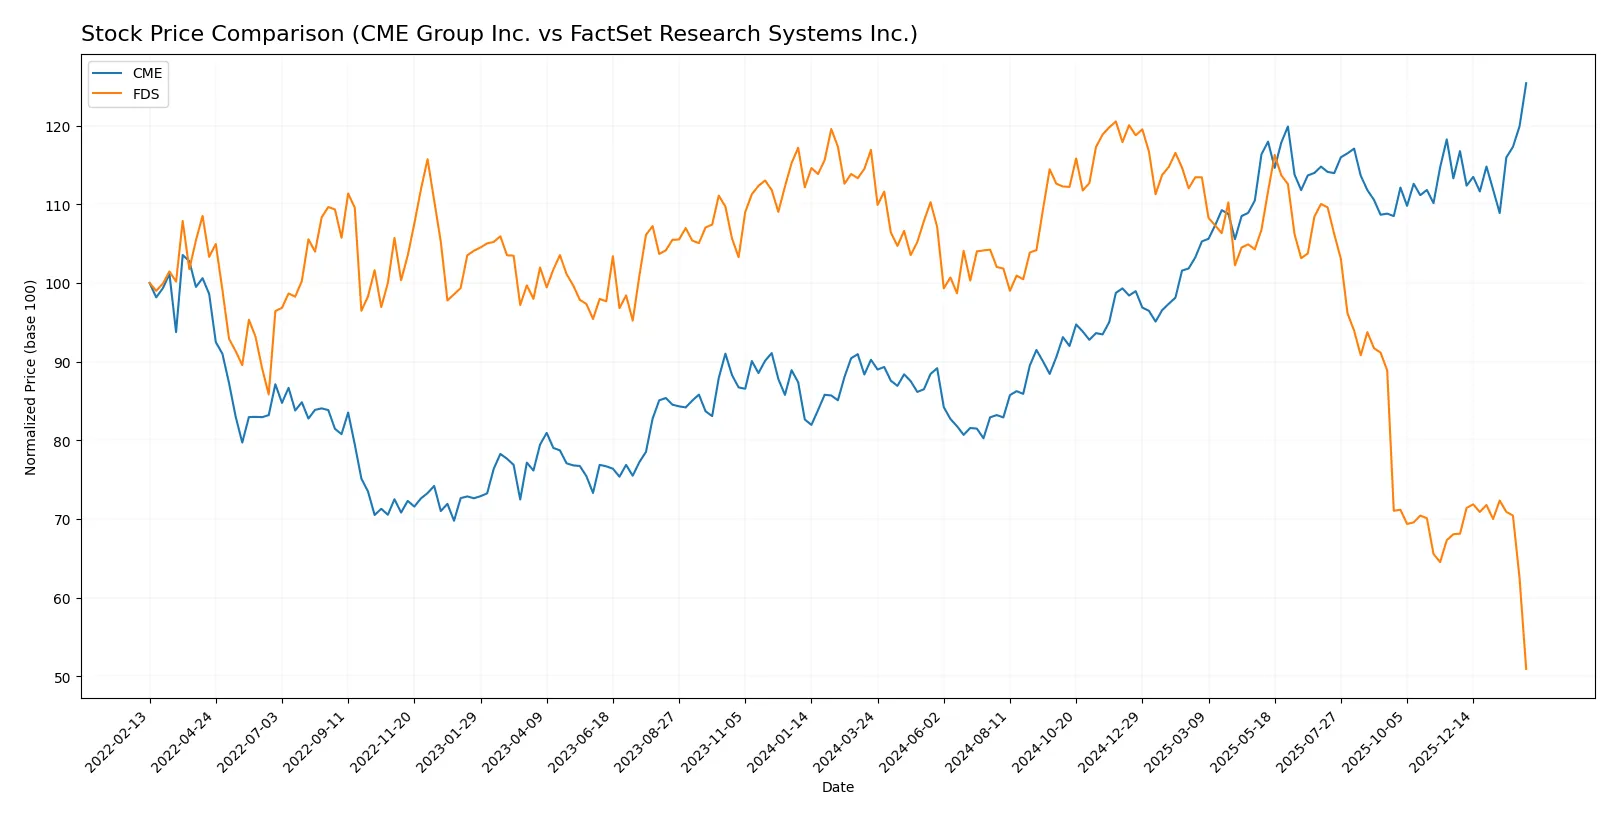
Trend Comparison
CME Group’s stock rose 38.97% over 12 months, confirming a bullish trend with accelerating gains and a high near 302.27. Its volatility remains moderate at a 29.68 standard deviation.
FactSet’s stock fell 56.44% over the same period, marking a bearish trend with decelerating losses. Volatility is much higher at 70.83, with prices bottoming near 207.32.
CME outperformed FactSet by a wide margin, delivering the highest market returns and a stable upward trajectory in 2026.
Target Prices
Analysts present a clear target consensus for CME Group Inc. and FactSet Research Systems Inc.
| Company | Target Low | Target High | Consensus |
|---|---|---|---|
| CME Group Inc. | 300 | 340 | 311.83 |
| FactSet Research Systems Inc. | 215 | 321 | 287.89 |
The targets for CME suggest a modest upside from the current 302.27 price, reflecting steady confidence. FactSet’s wider range and consensus well above the current 207.32 price indicate expectations of significant recovery or growth.

Don’t Let Luck Decide Your Entry Point
Optimize your entry points with our advanced ProRealTime indicators. You’ll get efficient buy signals with precise price targets for maximum performance. Start outperforming now!
How do institutions grade them?
CME Group Inc. Grades
The following table summarizes recent grades assigned to CME Group by leading institutions.
| Grading Company | Action | New Grade | Date |
|---|---|---|---|
| TD Cowen | Maintain | Buy | 2026-02-05 |
| Morgan Stanley | Maintain | Overweight | 2026-02-05 |
| Barclays | Maintain | Equal Weight | 2026-02-05 |
| JP Morgan | Maintain | Underweight | 2026-02-05 |
| RBC Capital | Maintain | Sector Perform | 2026-02-05 |
| Morgan Stanley | Maintain | Overweight | 2026-01-15 |
| TD Cowen | Upgrade | Buy | 2026-01-14 |
| Morgan Stanley | Maintain | Overweight | 2025-12-22 |
| Barclays | Maintain | Equal Weight | 2025-12-12 |
| Piper Sandler | Maintain | Overweight | 2025-11-13 |
FactSet Research Systems Inc. Grades
Below is a summary of recent grades for FactSet Research Systems from reputable grading firms.
| Grading Company | Action | New Grade | Date |
|---|---|---|---|
| Wells Fargo | Maintain | Underweight | 2026-02-04 |
| Wells Fargo | Maintain | Underweight | 2026-01-14 |
| Evercore ISI Group | Maintain | In Line | 2026-01-08 |
| BMO Capital | Maintain | Market Perform | 2025-12-22 |
| Stifel | Maintain | Hold | 2025-12-19 |
| Goldman Sachs | Maintain | Sell | 2025-12-19 |
| RBC Capital | Maintain | Sector Perform | 2025-12-19 |
| Morgan Stanley | Upgrade | Equal Weight | 2025-12-17 |
| Wells Fargo | Maintain | Underweight | 2025-12-05 |
| UBS | Upgrade | Buy | 2025-09-22 |
Which company has the best grades?
CME Group consistently receives Buy and Overweight grades from top firms, indicating stronger institutional confidence. FactSet’s ratings skew lower, with frequent Underweight, Hold, and Sell grades. Investors may interpret CME’s superior grades as a more favorable outlook and potential for higher relative performance.
Risks specific to each company
The following categories identify the critical pressure points and systemic threats facing both firms in the 2026 market environment:
1. Market & Competition
CME Group Inc.
- Operates in highly competitive futures and options markets with established global players. Faces pressure from fintech innovation and market fragmentation.
FactSet Research Systems Inc.
- Competes in financial data analytics amid rising competition from AI-driven platforms and larger integrated service providers.
2. Capital Structure & Debt
CME Group Inc.
- Low debt-to-equity ratio (0.12) signals conservative leverage and strong balance sheet. Interest coverage is robust at 41.98x.
FactSet Research Systems Inc.
- Moderate leverage with debt-to-equity at 0.71. Interest coverage of 13.8x is adequate but shows higher financial risk.
3. Stock Volatility
CME Group Inc.
- Very low beta (0.28) indicates stability and lower sensitivity to market swings.
FactSet Research Systems Inc.
- Higher beta (0.726) suggests more volatility and greater sensitivity to market fluctuations.
4. Regulatory & Legal
CME Group Inc.
- Subject to stringent financial market regulations globally, with potential impact from regulatory tightening on derivatives trading.
FactSet Research Systems Inc.
- Faces regulatory scrutiny on data privacy and compliance across multiple jurisdictions, increasing legal complexity.
5. Supply Chain & Operations
CME Group Inc.
- Operations depend on technology infrastructure reliability and clearing house efficiency; systemic risk if disruptions occur.
FactSet Research Systems Inc.
- Relies on continuous data acquisition and IT systems; operational risks include data integrity and technology failures.
6. ESG & Climate Transition
CME Group Inc.
- Increasing pressure to integrate ESG factors in products and internal operations; risk of lagging peers in climate initiatives.
FactSet Research Systems Inc.
- Faces growing investor demand for ESG transparency and sustainable data solutions; must innovate to stay relevant.
7. Geopolitical Exposure
CME Group Inc.
- Global footprint exposes it to geopolitical risks including trade tensions and regulatory divergence.
FactSet Research Systems Inc.
- International client base subjects it to geopolitical uncertainties, especially in emerging markets and data localization laws.
Which company shows a better risk-adjusted profile?
CME Group’s most impactful risk lies in operational and regulatory pressures on its complex derivatives markets. FactSet faces its greatest threat from higher leverage and market volatility amid intensifying competition. FactSet’s stronger profitability and Altman Z-Score in the safe zone signal a more resilient risk-adjusted profile despite elevated financial risk. CME’s distress-zone Z-Score and unfavorable liquidity ratios caution investors to weigh stability versus financial strength carefully.
Final Verdict: Which stock to choose?
CME Group’s superpower lies in its robust cash generation and stellar profitability, making it a formidable cash machine in the financial exchanges sector. However, its declining ROIC and weak liquidity ratios are points of vigilance. It suits aggressive growth portfolios willing to embrace some operational risks.
FactSet commands a strategic moat through its high return on invested capital and strong recurring revenue model, which supports durability despite recent ROIC softness. It offers better financial stability compared to CME, fitting portfolios focused on GARP – growth at a reasonable price.
If you prioritize cash flow strength and high profitability momentum, CME outshines as a compelling choice despite its capital inefficiencies. However, if you seek stability and consistent value creation with a durable moat, FactSet offers better downside protection and operational efficiency. Both present tailored opportunities depending on your risk tolerance and investment horizon.
Disclaimer: Investment carries a risk of loss of initial capital. The past performance is not a reliable indicator of future results. Be sure to understand risks before making an investment decision.
Go Further
I encourage you to read the complete analyses of CME Group Inc. and FactSet Research Systems Inc. to enhance your investment decisions: