Home > Comparison > Financial Services > CME vs COIN
The strategic rivalry between CME Group Inc. and Coinbase Global, Inc. shapes the evolution of financial services worldwide. CME operates as a capital-intensive exchange powerhouse specializing in futures and options across diverse asset classes. In contrast, Coinbase leads as a high-volatility crypto marketplace innovating financial infrastructure for the digital economy. This analysis will assess which model offers superior risk-adjusted returns, guiding investors toward the more resilient portfolio addition in a rapidly transforming sector.

Table of contents
Companies Overview
CME Group Inc. and Coinbase Global, Inc. stand as pivotal players in the evolving financial exchange landscape.
CME Group Inc.: The Established Futures Market Leader
CME Group dominates global derivatives trading with its futures and options contracts across diverse asset classes like interest rates and commodities. Its robust revenue stems from transaction fees and clearing services. In 2026, CME focuses on expanding market data services and enhancing risk mitigation capabilities to reinforce its competitive edge in institutional trading.
Coinbase Global, Inc.: The Crypto Infrastructure Pioneer
Coinbase leads in providing crypto financial infrastructure and technology for consumers and institutions. It generates revenue through transaction fees on its marketplace and by supplying blockchain-based developer tools. In 2026, Coinbase prioritizes broadening its crypto asset offerings and deepening liquidity pools to capture growing demand in the cryptoeconomy.
Strategic Collision: Similarities & Divergences
Both companies serve financial markets but differ fundamentally: CME offers a traditional, regulated derivatives ecosystem, while Coinbase builds an open infrastructure for digital assets. Their primary battleground is market share in trading volume and liquidity, though targeting distinct investor bases. This divergence creates contrasting risk profiles—CME benefits from stability and established moats, Coinbase offers growth potential amid crypto volatility.
Income Statement Comparison
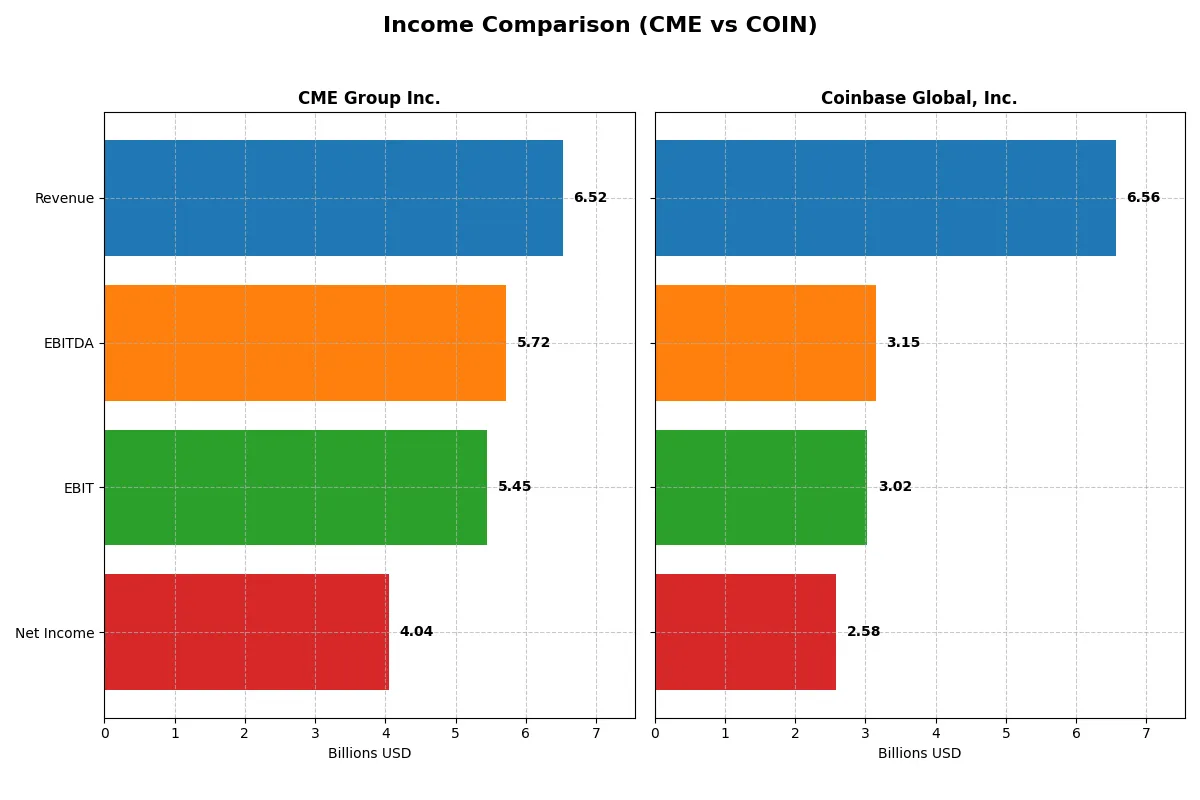
This data dissects the core profitability and scalability of both corporate engines to reveal who dominates the bottom line:
| Metric | CME Group Inc. (CME) | Coinbase Global, Inc. (COIN) |
|---|---|---|
| Revenue | 6.52B | 6.56B |
| Cost of Revenue | 907M | 1.66B |
| Operating Expenses | 1.38B | 2.60B |
| Gross Profit | 5.61B | 4.91B |
| EBITDA | 5.72B | 3.15B |
| EBIT | 5.45B | 3.02B |
| Interest Expense | 130M | 81M |
| Net Income | 4.04B | 2.58B |
| EPS | 11.18 | 10.42 |
| Fiscal Year | 2025 | 2024 |
Income Statement Analysis: The Bottom-Line Duel
This income statement comparison reveals which company leverages its revenues into stronger profitability and operational efficiency.
CME Group Inc. Analysis
CME Group’s revenue climbed steadily from 4.7B in 2021 to 6.5B in 2025, with net income rising 53% over five years to 4.0B. Its gross margin remains exceptional at 86%, and net margin steadies above 62%. The 2025 results highlight robust margin expansion and efficient cost control, fueling solid earnings momentum.
Coinbase Global, Inc. Analysis
Coinbase’s revenue surged from 1.3B in 2020 to 6.6B in 2024, reflecting explosive growth. Net income jumped from a loss in 2022 to 2.6B in 2024. Gross margin holds at a healthy 75%, while net margin improved sharply to 39%. The latest year shows dramatic margin recovery and operational scaling after earlier losses.
Margin Dominance vs. Growth Surge
CME delivers superior margin quality and consistent profit growth with a well-established business model. Coinbase outpaces with massive top-line growth and a rapid turnaround from losses to profits. For investors prioritizing steady profitability, CME’s profile is more attractive. Growth-seekers may find Coinbase’s momentum compelling but should weigh its higher volatility.
Financial Ratios Comparison
These vital ratios act as a diagnostic tool to expose the underlying fiscal health, valuation premiums, and capital efficiency of the companies compared below:
| Ratios | CME Group Inc. (CME) | Coinbase Global, Inc. (COIN) |
|---|---|---|
| ROE | 14.1% | 25.1% |
| ROIC | 8.5% | 13.6% |
| P/E | 24.3 | 23.8 |
| P/B | 3.4 | 6.0 |
| Current Ratio | 1.01 | 2.28 |
| Quick Ratio | 1.01 | 2.28 |
| D/E | 0.13 | 0.45 |
| Debt-to-Assets | 2.5% | 20.5% |
| Interest Coverage | 24.4 | 28.6 |
| Asset Turnover | 0.04 | 0.29 |
| Fixed Asset Turnover | 15.9 | 23.3 |
| Payout Ratio | 101.7% | 0% |
| Dividend Yield | 4.3% | 0% |
| Fiscal Year | 2025 | 2024 |
Efficiency & Valuation Duel: The Vital Signs
Ratios act as a company’s DNA, revealing hidden risks and operational excellence beyond surface-level financials.
CME Group Inc.
CME shows solid core profitability with a 14.08% ROE and an impressive 62.02% net margin, signaling operational strength. Its P/E of 24.28 suggests a fairly valued stock, while a 1.83% dividend yield rewards shareholders steadily. However, a negative ROIC and unfavorable current and quick ratios highlight some capital efficiency and liquidity concerns.
Coinbase Global, Inc.
Coinbase delivers a strong 25.1% ROE and a healthy 39.29% net margin, reflecting robust profitability. The P/E of 23.82 marks a neutral valuation, yet a 0% dividend yield reveals an aggressive reinvestment strategy focused on R&D (22% of revenue). Its favorable liquidity ratios and moderate debt levels position it well for growth but at a higher risk profile.
Balanced Profitability Meets Growth Ambition
CME offers stability with steady dividends and moderate valuation but shows capital allocation weaknesses. Coinbase stands out for superior profitability and growth reinvestment but carries higher valuation risks and no shareholder payouts. Investors seeking income and operational safety may prefer CME, while those targeting growth should consider Coinbase’s dynamic profile.
Which one offers the Superior Shareholder Reward?
I see CME Group Inc. balances dividends and buybacks, yielding 4.3% with a payout ratio near 100%, supported by strong free cash flow. Coinbase Global, Inc. pays no dividends but reinvests heavily in growth and innovation, with modest buybacks. CME’s steady, sustainable payouts align with defensive capital allocation. Coinbase’s strategy targets high growth but carries execution risk in a volatile crypto market. For 2026, CME offers a superior total return profile due to reliable income and prudent capital returns, while Coinbase suits growth-seeking investors accepting higher uncertainty.
Comparative Score Analysis: The Strategic Profile
The radar chart reveals the fundamental DNA and trade-offs of CME Group Inc. and Coinbase Global, Inc. across key financial dimensions:
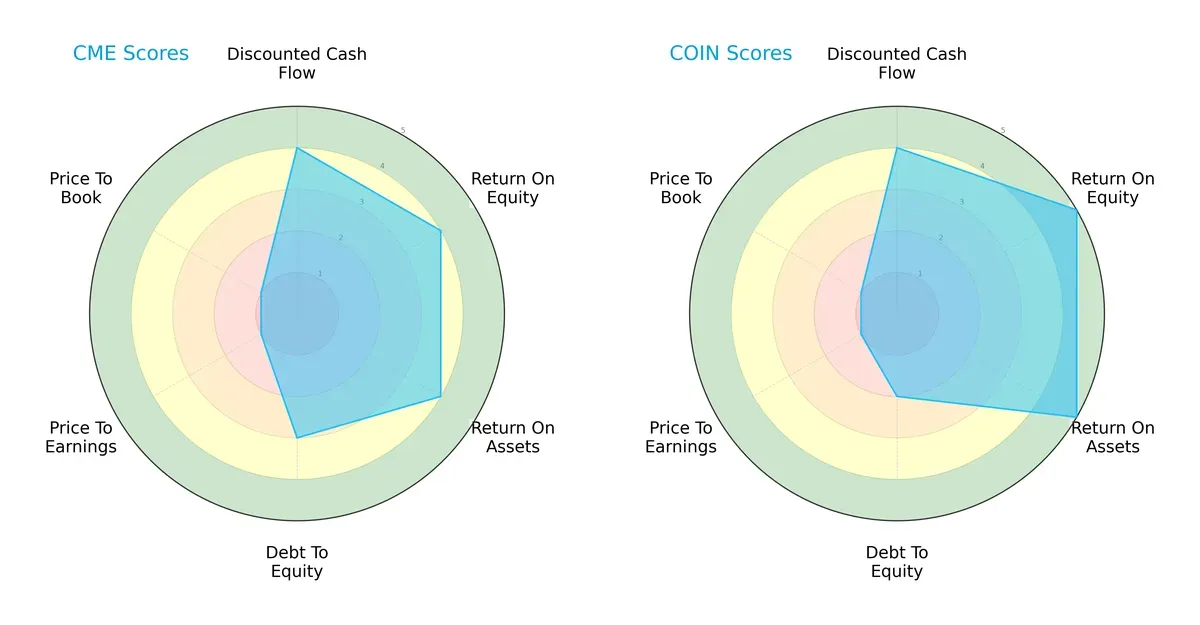
CME displays a balanced profile with solid DCF, ROE, ROA, and moderate debt levels. Coinbase excels in profitability metrics (ROE 5, ROA 5) but carries higher financial risk with weaker debt management (score 2). Both struggle on valuation, scoring very low on P/E and P/B, signaling market skepticism or overvaluation.
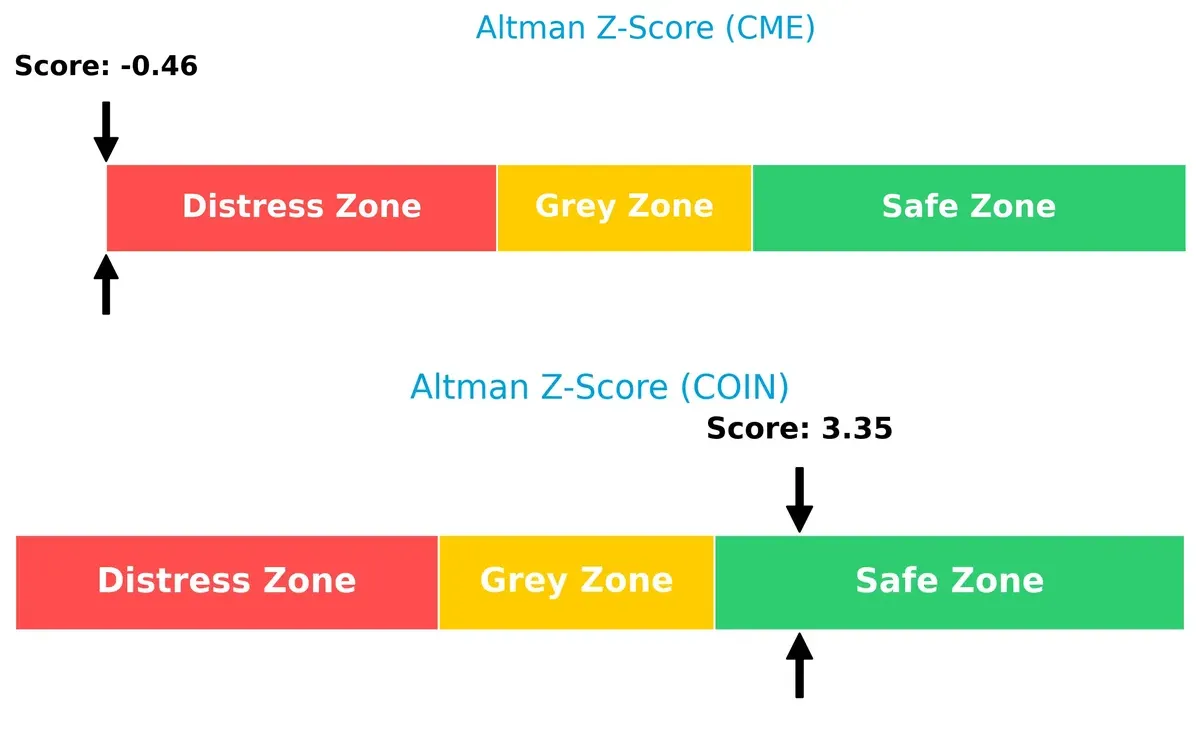
Bankruptcy Risk: Solvency Showdown
Coinbase’s Altman Z-Score of 3.35 places it safely above distress, signaling strong long-term solvency. CME’s score of -0.46 signals financial distress and elevated bankruptcy risk in this cycle:
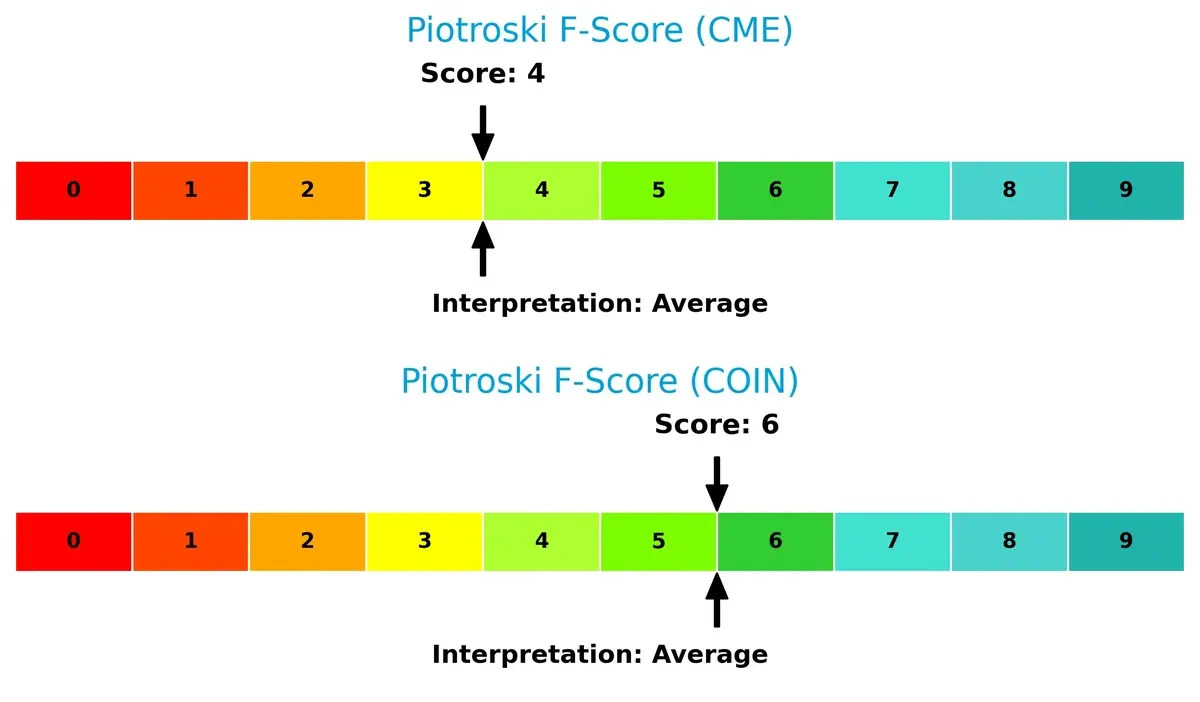
Financial Health: Quality of Operations
Coinbase’s Piotroski F-Score of 6 indicates healthier fundamentals than CME’s weaker 4 score. CME’s lower score highlights operational red flags, suggesting internal metrics need improvement to match Coinbase’s financial quality:
How are the two companies positioned?
This section dissects CME and COIN’s operational DNA by comparing their revenue distribution and internal dynamics. The goal is to confront their economic moats and identify which business model offers the most resilient, sustainable advantage in today’s market.
Revenue Segmentation: The Strategic Mix
This visual comparison dissects how CME Group Inc. and Coinbase Global, Inc. diversify their income streams and where their primary sector bets lie:
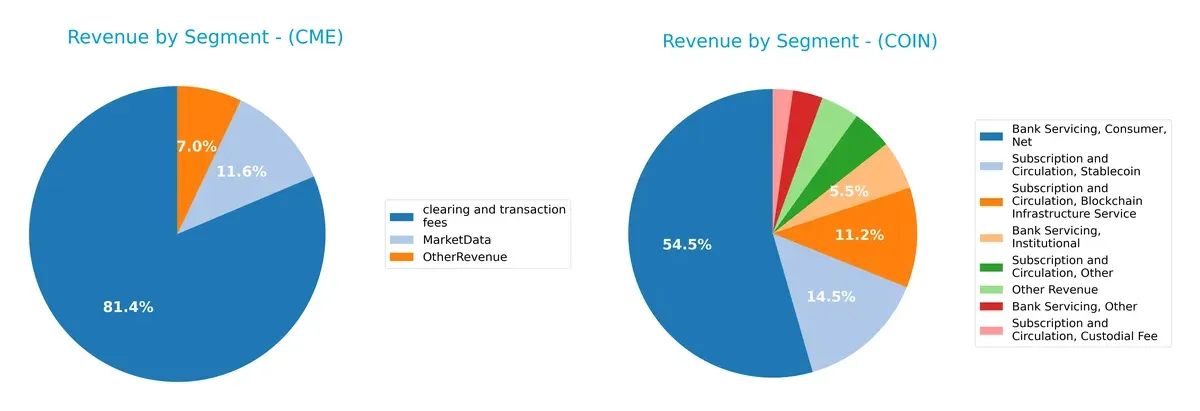
CME anchors its revenue with $4.99B from clearing and transaction fees, dwarfing $710M in Market Data and $432M in Other Revenue. Coinbase, however, shows a diversified mix: $3.43B banking consumer net and meaningful contributions from stablecoin ($910M) and blockchain infrastructure ($706M). CME’s concentration signals infrastructure dominance but higher segment risk. Coinbase pivots on varied digital finance services, reducing dependency on any single source.
Strengths and Weaknesses Comparison
This table compares the Strengths and Weaknesses of CME Group Inc. and Coinbase Global, Inc.:
CME Strengths
- High net margin at 62%
- Favorable WACC at 5%
- Low debt-to-assets ratio at 1.72%
- Strong interest coverage ratio near 42
- Stable revenue from clearing and transaction fees
- Favorable fixed asset turnover at 18
COIN Strengths
- Strong net margin at 39%
- High ROE of 25%
- Favorable current and quick ratios above 2.2
- Solid debt-to-assets ratio at 20.54%
- Diverse revenue streams including blockchain and stablecoin
- Favorable fixed asset turnover at 23
CME Weaknesses
- Negative ROIC at -2% signals poor capital returns
- Unfavorable asset turnover at 0.03 indicates low asset efficiency
- Zero current and quick ratios raise liquidity concerns
- Elevated PB ratio at 3.42
- Neutral ROE at 14% limits profitability appeal
COIN Weaknesses
- Unfavorable ROIC at 13.56%, below WACC
- High WACC at 19.51% increases capital costs
- Unfavorable asset turnover at 0.29
- No dividend yield to attract income investors
- Elevated PB ratio at 5.98
CME excels in profitability margins and conservative leverage but struggles with capital efficiency and liquidity metrics. COIN shows strong profitability and liquidity yet faces high capital costs and weaker asset utilization. Both companies must address these weaknesses to sustain competitive positioning.
The Moat Duel: Analyzing Competitive Defensibility
A structural moat is the only thing protecting long-term profits from the relentless erosion of competition. Let’s break down the moats of two financial exchanges:
CME Group Inc.: Intangible Assets and Market Infrastructure
CME’s moat stems from its entrenched market infrastructure and regulatory licenses. It sustains high gross and net margins above 60%, reflecting strong pricing power. However, its declining ROIC warns of weakening competitive defenses heading into 2026.
Coinbase Global, Inc.: Network Effects and Innovation
Coinbase’s moat relies on network effects within the crypto ecosystem and rapid product expansion. Its explosive revenue growth and improving margins reveal dynamic competitive positioning. Yet, like CME, its ROIC decline signals challenges sustaining this advantage.
Market Infrastructure vs. Crypto Network Effects: Who Defends Better?
Both companies destroy economic value with declining ROIC trends. Still, CME’s deep regulatory barriers offer a more durable moat than Coinbase’s nascent network effects. CME remains better equipped to defend market share despite current profitability headwinds.
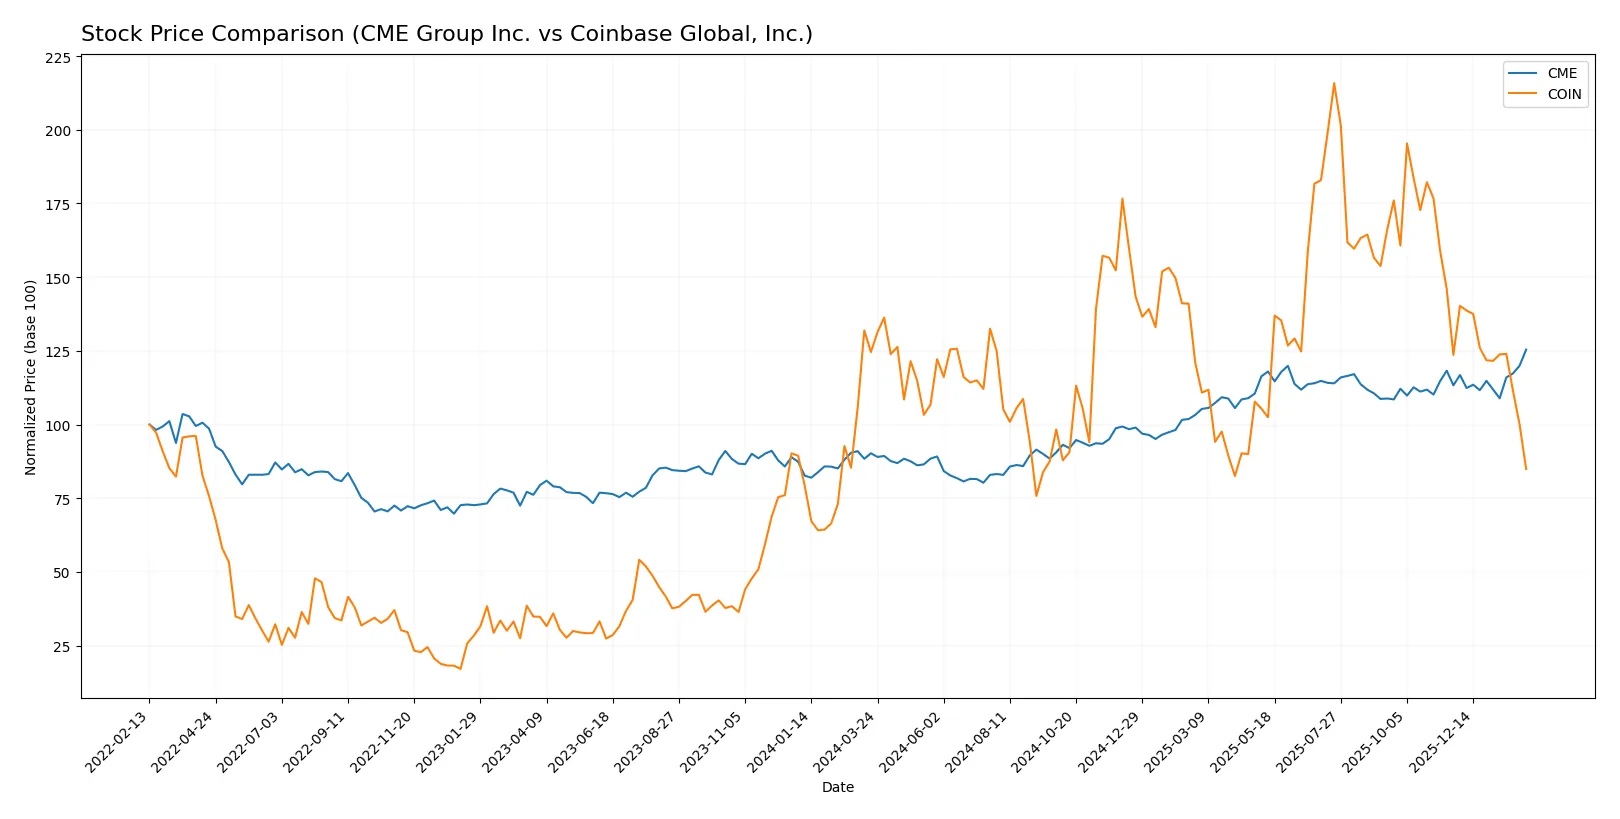
Which stock offers better returns?
The past year shows a sharp divergence: CME Group rallies with sustained acceleration, while Coinbase Global slides amid decelerating losses and heavy selling pressure.
Trend Comparison
CME Group’s stock price rose 39% over 12 months, showing a bullish trend with accelerating momentum and a peak at 302.27. Volatility remains moderate at a 29.68 standard deviation.
Coinbase Global declined 32% over the same period, confirming a bearish trend with deceleration. The stock hit a low of 147.35 and experienced high volatility, with a 58.94 standard deviation.
CME outperformed Coinbase markedly, delivering the highest market returns with strong buyer dominance and increasing volume versus Coinbase’s seller dominance and falling volume.
Target Prices
Analysts present a clear target price consensus for CME Group Inc. and Coinbase Global, Inc.
| Company | Target Low | Target High | Consensus |
|---|---|---|---|
| CME Group Inc. | 300 | 340 | 311.83 |
| Coinbase Global, Inc. | 230 | 440 | 336.44 |
CME’s consensus target of 311.83 slightly exceeds its current price of 302.27, suggesting modest upside. Coinbase’s target consensus of 336.44 is more than double its current price of 165.12, indicating significant expected growth but accompanied by higher volatility risk.

Don’t Let Luck Decide Your Entry Point
Optimize your entry points with our advanced ProRealTime indicators. You’ll get efficient buy signals with precise price targets for maximum performance. Start outperforming now!
How do institutions grade them?
Here is a summary of recent institutional grades for CME Group Inc. and Coinbase Global, Inc.:
CME Group Inc. Grades
The following table shows recent grades issued by reputable financial institutions for CME Group Inc.:
| Grading Company | Action | New Grade | Date |
|---|---|---|---|
| TD Cowen | Maintain | Buy | 2026-02-05 |
| Morgan Stanley | Maintain | Overweight | 2026-02-05 |
| Barclays | Maintain | Equal Weight | 2026-02-05 |
| JP Morgan | Maintain | Underweight | 2026-02-05 |
| RBC Capital | Maintain | Sector Perform | 2026-02-05 |
Coinbase Global, Inc. Grades
Below is a table summarizing recent grades from recognized grading firms for Coinbase Global, Inc.:
| Grading Company | Action | New Grade | Date |
|---|---|---|---|
| BTIG | Maintain | Buy | 2026-02-05 |
| Piper Sandler | Maintain | Neutral | 2026-01-14 |
| Oppenheimer | Maintain | Outperform | 2026-01-12 |
| Barclays | Maintain | Equal Weight | 2026-01-08 |
| B of A Securities | Upgrade | Buy | 2026-01-08 |
Which company has the best grades?
CME Group presents a mixed picture with mostly “Buy” and “Overweight” ratings but also some “Underweight” and “Equal Weight” views. Coinbase shows a stronger consensus toward positive ratings, including “Buy” and “Outperform.” Investors might interpret Coinbase’s grades as more bullish, potentially reflecting higher growth expectations or sector momentum.
Risks specific to each company
The following categories identify the critical pressure points and systemic threats facing CME Group Inc. and Coinbase Global, Inc. in the 2026 market environment:
1. Market & Competition
CME Group Inc.
- Dominates traditional futures markets with a broad product range, but faces slow growth in some segments.
Coinbase Global, Inc.
- Operates in a highly volatile, rapidly evolving crypto market with fierce competition and regulatory uncertainty.
2. Capital Structure & Debt
CME Group Inc.
- Maintains low debt levels (D/E 0.12), ensuring financial stability and strong interest coverage.
Coinbase Global, Inc.
- Higher leverage (D/E 0.45) increases financial risk amid market volatility, despite adequate interest coverage.
3. Stock Volatility
CME Group Inc.
- Low beta (0.28) indicates stable stock with limited sensitivity to market swings.
Coinbase Global, Inc.
- Extremely high beta (3.7) signals significant volatility and risk for investors.
4. Regulatory & Legal
CME Group Inc.
- Operates within established regulatory frameworks, facing moderate compliance costs.
Coinbase Global, Inc.
- Faces greater regulatory uncertainty as crypto laws evolve globally, posing substantial compliance risks.
5. Supply Chain & Operations
CME Group Inc.
- Robust operational infrastructure with longstanding market presence minimizes operational disruptions.
Coinbase Global, Inc.
- Relies on complex technology infrastructure vulnerable to cyber risks and rapid innovation demands.
6. ESG & Climate Transition
CME Group Inc.
- Faces moderate ESG risks typical of financial services, with growing pressure on sustainable practices.
Coinbase Global, Inc.
- Increasing scrutiny on crypto’s environmental impact could affect operations and investor sentiment.
7. Geopolitical Exposure
CME Group Inc.
- Primarily US-focused with limited international geopolitical risk exposure.
Coinbase Global, Inc.
- Global footprint exposes Coinbase to diverse geopolitical tensions affecting crypto markets.
Which company shows a better risk-adjusted profile?
CME Group’s dominant market position, low leverage, and low stock volatility build a robust risk-adjusted profile. Coinbase’s high volatility and regulatory risks overshadow its strong profitability and growth potential. CME’s Altman Z-score in distress contrasts with Coinbase’s safe zone score, reflecting underlying financial stability concerns for CME despite its market strength.
Final Verdict: Which stock to choose?
CME Group Inc. shines with unmatched operational efficiency and a strong cash generation engine, making it a resilient player in financial markets. Its key point of vigilance is the declining return on invested capital, signaling potential challenges in value creation. CME fits well in a conservative or dividend-focused portfolio seeking steady income.
Coinbase Global, Inc. boasts a strategic moat rooted in its dominant position in crypto trading and growing recurring revenues. It offers a more dynamic growth profile with a healthier liquidity buffer compared to CME. Coinbase suits investors targeting growth with a tolerance for higher volatility and disruption risk.
If you prioritize steady income and operational resilience, CME is the compelling choice due to its robust cash flow and market positioning despite value creation concerns. However, if you seek aggressive growth and exposure to emerging financial technologies, Coinbase offers superior growth potential and liquidity safety, though it carries elevated execution risks.
Disclaimer: Investment carries a risk of loss of initial capital. The past performance is not a reliable indicator of future results. Be sure to understand risks before making an investment decision.
Go Further
I encourage you to read the complete analyses of CME Group Inc. and Coinbase Global, Inc. to enhance your investment decisions: