Home > Comparison > Financial Services > CME vs CBOE
The strategic rivalry between CME Group Inc. and Cboe Global Markets, Inc. defines the current trajectory of financial data and stock exchanges. CME operates as a dominant global futures and options marketplace with extensive clearing services. Cboe focuses on options and equities trading across multiple regions, emphasizing diverse product segments. This analysis pits CME’s scale against Cboe’s niche breadth to identify the superior risk-adjusted return for a diversified portfolio in financial services.

Table of contents
Companies Overview
CME Group Inc. and Cboe Global Markets, Inc. stand as pivotal players in the financial exchange landscape.
CME Group Inc.: Global Futures Market Leader
CME Group dominates as a global futures and options exchange, generating revenue through diverse contracts on interest rates, equity indexes, and commodities. Its strategic focus in 2026 emphasizes expanding clearing services and risk mitigation to enhance market stability and attract institutional traders.
Cboe Global Markets, Inc.: Premier Options and Equities Exchange
Cboe Global Markets operates as a leading options and equities exchange, earning from transactions in listed options, equities, futures, and FX products. In 2026, it prioritizes broadening international reach and strengthening its multi-asset trading platforms to capture cross-border investor demand.
Strategic Collision: Similarities & Divergences
Both firms operate within financial data and stock exchanges, yet CME centers on futures and clearing while Cboe emphasizes options and global equities. Their primary battleground is capturing institutional market share through technology and product diversification. CME offers a broader product suite; Cboe exhibits nimble, multi-asset growth, shaping distinct risk-return profiles for investors.
Income Statement Comparison
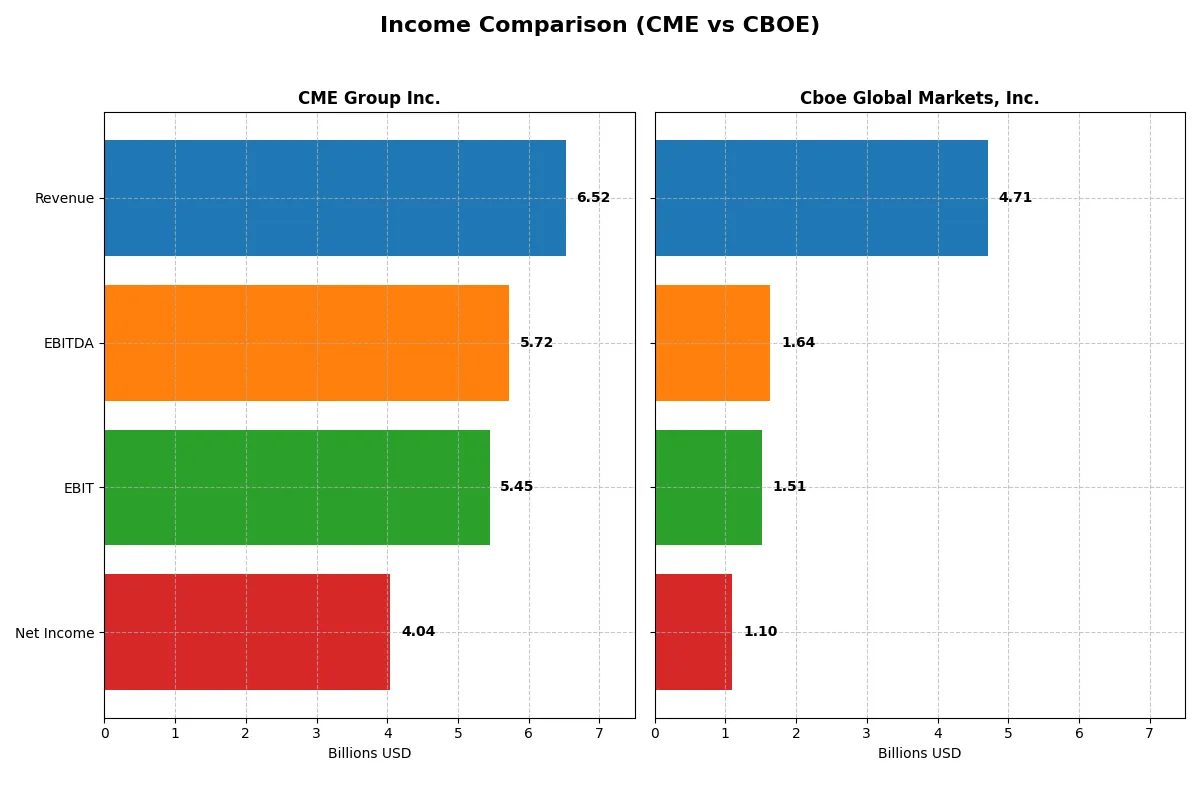
This data dissects the core profitability and scalability of both corporate engines to reveal who dominates the bottom line:
| Metric | CME Group Inc. (CME) | Cboe Global Markets, Inc. (CBOE) |
|---|---|---|
| Revenue | 6.52B | 4.71B |
| Cost of Revenue | 907M | 2.41B |
| Operating Expenses | 1.38B | 723M |
| Gross Profit | 5.61B | 2.31B |
| EBITDA | 5.72B | 1.64B |
| EBIT | 5.45B | 1.51B |
| Interest Expense | 130M | -52M |
| Net Income | 4.04B | 1.10B |
| EPS | 11.18 | 10.46 |
| Fiscal Year | 2025 | 2025 |
Income Statement Analysis: The Bottom-Line Duel
The following income statement comparison reveals which company operates with superior efficiency and delivers better shareholder returns.
CME Group Inc. Analysis
CME Group’s revenue climbed steadily from 4.69B in 2021 to 6.52B in 2025, with net income surging from 2.62B to 4.04B. Its gross margin consistently exceeds 86%, signaling excellent cost control. In 2025, CME’s net margin hit 62%, reflecting strong operational leverage and sustained earnings momentum.
Cboe Global Markets, Inc. Analysis
Cboe’s revenue rose from 3.49B in 2021 to 4.71B in 2025, with net income growing impressively from 529M to 1.10B. Its gross margin improved to nearly 49%, while net margin reached 23% in 2025. The company shows robust growth, particularly in EPS, with a 44.5% jump in the last year alone, highlighting accelerating profitability.
Margin Strength vs. Growth Momentum
CME Group dominates with higher margins and larger absolute profits, showcasing operational excellence and margin expansion. Cboe excels in growth rates, notably doubling net income over five years and posting strong margin improvements. Investors favoring stable, high-margin cash flow may prefer CME, while those seeking rapid earnings growth might lean toward Cboe.
Financial Ratios Comparison
These vital ratios act as a diagnostic tool to expose the underlying fiscal health, valuation premiums, and capital efficiency of the following companies:
| Ratios | CME Group Inc. (CME) | Cboe Global Markets, Inc. (CBOE) |
|---|---|---|
| ROE | 14.08% | 21.41% |
| ROIC | -2.01% | 15.31% |
| P/E | 24.28 | 23.89 |
| P/B | 3.42 | 5.11 |
| Current Ratio | 0 | 1.87 |
| Quick Ratio | 0 | 1.87 |
| D/E (Debt-to-Equity) | 0.12 | 0.33 |
| Debt-to-Assets | 1.72% | 18.10% |
| Interest Coverage | 32.61 | -28.95 |
| Asset Turnover | 0.03 | 0.51 |
| Fixed Asset Turnover | 17.98 | 19.31 |
| Payout Ratio | 44.46% | 25.70% |
| Dividend Yield | 1.83% | 1.08% |
| Fiscal Year | 2025 | 2025 |
Efficiency & Valuation Duel: The Vital Signs
Financial ratios act as a company’s DNA, uncovering hidden risks and operational strengths behind headline numbers.
CME Group Inc.
CME posts a solid 14.1% ROE, reflecting competent shareholder returns, yet its negative ROIC signals inefficient capital use. The stock trades at a neutral P/E of 24.3 but carries an unfavorable price-to-book ratio of 3.42, indicating possible valuation stretch. Dividends yield 1.83%, suggesting moderate cash return amid restrained reinvestment.
Cboe Global Markets, Inc.
Cboe demonstrates robust profitability with a 21.4% ROE and a favorable 15.3% ROIC, showing effective capital allocation. Its P/E stands neutral at 23.9, yet a high P/B of 5.11 flags valuation risk. The 1.08% dividend yield offers modest income, backed by strong operational efficiency and a healthy current ratio of 1.87.
Operational Efficiency Outweighs Valuation Concerns
Cboe leads with superior profitability and capital returns, offsetting its elevated book valuation. CME shows strengths in shareholder yield but struggles with capital efficiency. Cboe suits investors prioritizing operational excellence; CME appeals to those valuing steady dividends with caution on capital deployment.
Which one offers the Superior Shareholder Reward?
I see CME Group delivers a robust 4.3% dividend yield with a payout ratio near 100%, signaling full free cash flow distribution. Its aggressive buybacks amplify total returns. Cboe Global Markets pays a modest 1.1% yield with a 26% payout ratio, favoring reinvestment over dividends. Cboe’s buybacks are less intense but consistent. Historically, CME’s distribution model maximizes immediate shareholder reward but risks sustainability if free cash flow dips. Cboe’s conservative payout and reinvestment strategy support long-term growth and value creation. For 2026, I favor CME for higher total returns, weighing risk against reward carefully.
Comparative Score Analysis: The Strategic Profile
The radar chart reveals the fundamental DNA and trade-offs of CME Group Inc. and Cboe Global Markets, Inc., highlighting their operational strengths and valuation challenges:
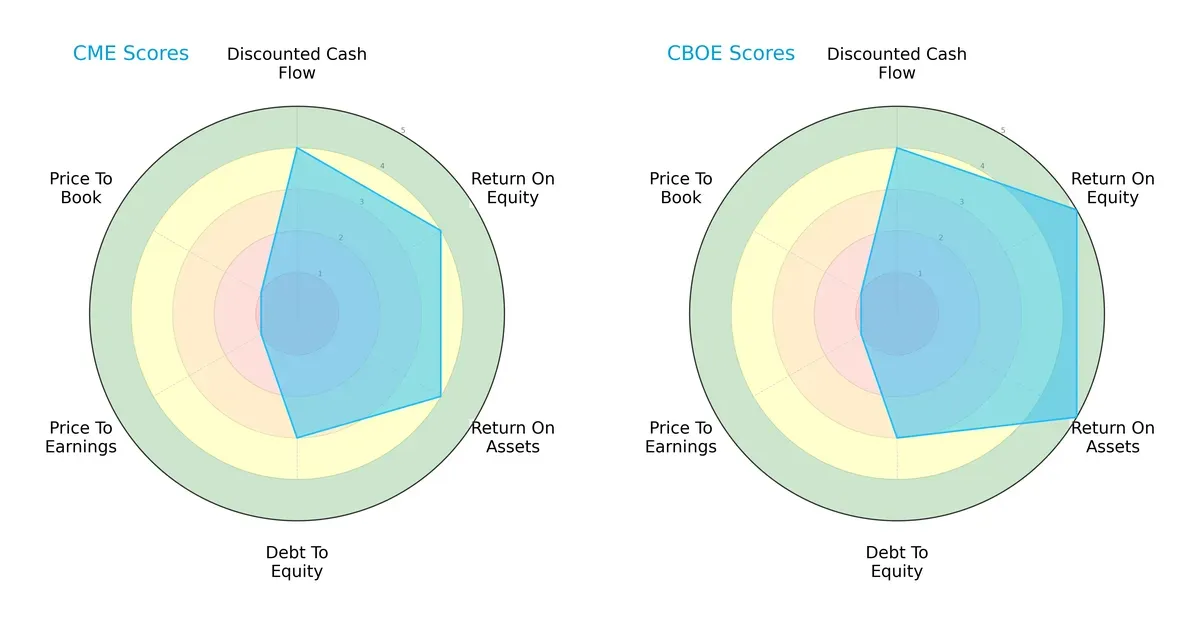
Both firms show strong discounted cash flow (DCF) scores of 4, reflecting solid future cash flow prospects. Cboe edges out CME with superior return on equity (5 vs. 4) and return on assets (5 vs. 4), indicating more efficient capital and asset use. Debt-to-equity scores are identical at 3, signaling moderate leverage risk for both. However, both firms suffer from very unfavorable valuation metrics (PE and PB scores at 1), suggesting market skepticism or potential undervaluation. CME presents a balanced profile, while Cboe relies more heavily on operational efficiency for its edge.
Bankruptcy Risk: Solvency Showdown
The Altman Z-Score delta reveals a stark contrast in solvency risk between CME and Cboe in this cycle:
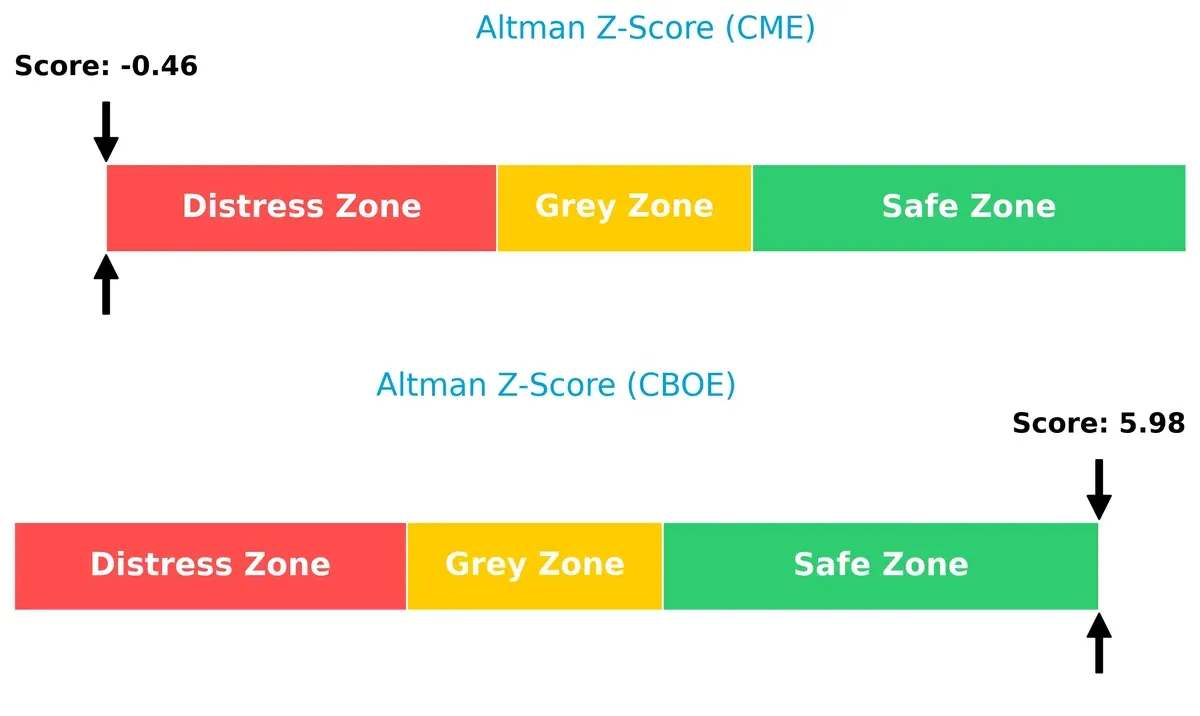
Cboe’s score at 5.98 places it securely in the safe zone, signaling low bankruptcy risk and strong financial stability. CME’s distress zone score of -0.46 signals high financial fragility and elevated bankruptcy probability. This divergence demands caution for CME investors amid economic uncertainty.
Financial Health: Quality of Operations
Piotroski F-Scores underscore operational quality and internal financial health differences between the two firms:
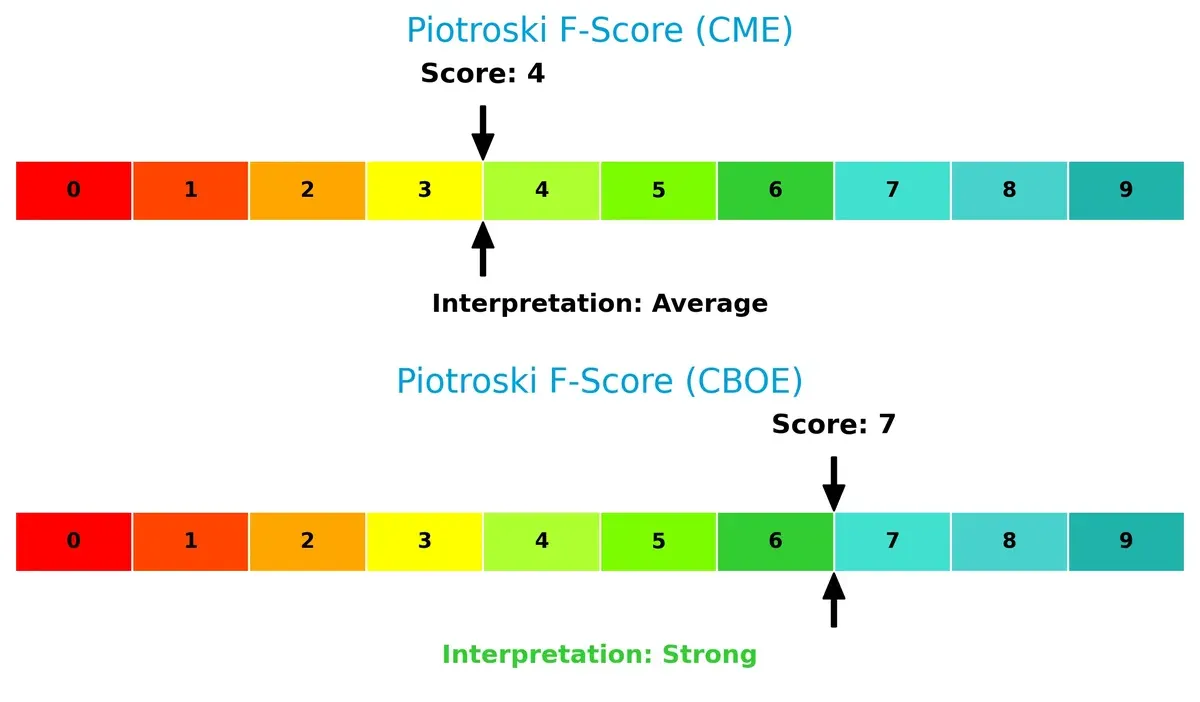
Cboe’s strong score of 7 reflects robust profitability, liquidity, and efficiency, marking it as a financially sound investment. CME’s average score of 4 signals some internal weaknesses and potential red flags in operational metrics. This gap suggests Cboe is better positioned to sustain value creation through market cycles.
How are the two companies positioned?
This section dissects the operational DNA of CME and CBOE by comparing their revenue distribution and internal dynamics. The goal is to confront their economic moats and determine which model offers the most resilient competitive advantage today.
Revenue Segmentation: The Strategic Mix
This visual comparison dissects how CME Group and Cboe Global Markets diversify their income streams and where their primary sector bets lie:
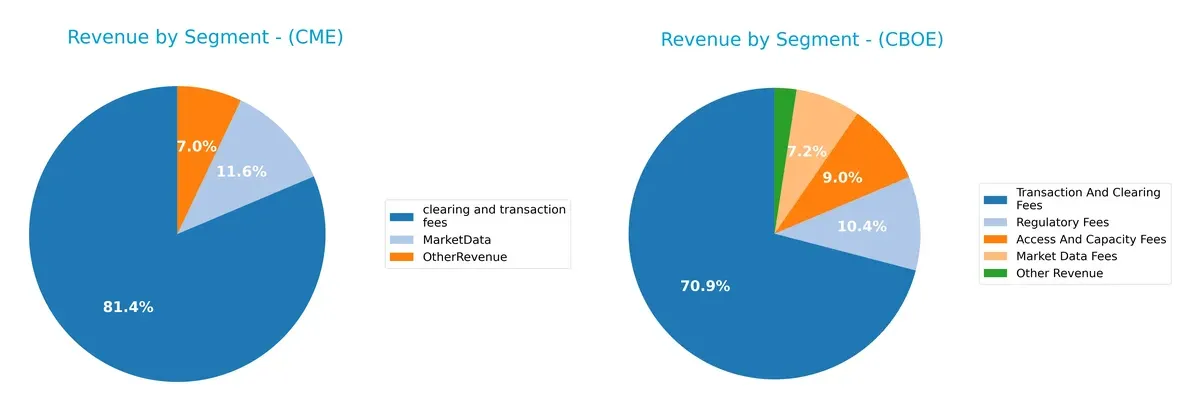
CME Group anchors its revenue with $4.99B from clearing and transaction fees, dwarfing its $710M Market Data and $432M Other Revenue segments. Cboe Global Markets shows a more diversified mix: $2.9B from Transaction and Clearing Fees, $426M Regulatory Fees, $370M Access and Capacity Fees, and $295M Market Data Fees. CME’s heavy reliance on clearing fees signals infrastructure dominance but raises concentration risk. Cboe’s spread suggests broader ecosystem lock-in and resilience.
Strengths and Weaknesses Comparison
This table compares the Strengths and Weaknesses of CME Group Inc. and Cboe Global Markets, Inc.:
CME Strengths
- High net margin at 62%
- Favorable WACC at 5.02%
- Low debt to assets at 1.7%
- Strong interest coverage at 42x
- Large clearing and transaction fees revenue (4.99B in 2024)
CBOE Strengths
- Favorable net margin at 23%
- Strong ROE 21% and ROIC 15%
- Favorable current and quick ratios at 1.87
- Diverse revenue streams including regulatory and market data fees
- Favorable fixed asset turnover at 19.3
CME Weaknesses
- Negative ROIC at -2% signals poor capital efficiency
- Unfavorable current and quick ratios at 0
- Low asset turnover at 0.03
- Unfavorable PB ratio at 3.42
- Neutral ROE at 14%
CBOE Weaknesses
- Unfavorable interest coverage at -29x raises solvency concerns
- High PB ratio at 5.11
- Neutral asset turnover at 0.51
- Lower dividend yield at 1.08%
CME’s strengths lie in profitability and low leverage but show weaknesses in capital efficiency and liquidity ratios. CBOE demonstrates stronger returns and solid liquidity yet faces solvency risks due to negative interest coverage. These contrasting profiles highlight differing operational and financial focuses for each company.
The Moat Duel: Analyzing Competitive Defensibility
A structural moat is the only reliable shield protecting long-term profits from relentless competition erosion. Let’s dissect the moats of two exchange giants:
CME Group Inc.: Intangible Assets and Market Scale
CME leverages deep intangible assets with extensive product diversity and market reach. However, its declining ROIC signals weakening capital efficiency, threatening margin stability and future moat strength in 2026.
Cboe Global Markets, Inc.: Efficient Capital Allocation and Niche Focus
Cboe’s moat stems from superior capital allocation and focused market segments, driving a robust ROIC well above WACC. Its growing profitability suggests expanding competitive advantages and market disruption potential.
Capital Efficiency vs. Market Breadth: Who Defends the Moat Better?
Cboe’s sustained ROIC growth and value creation mark a wider, deeper moat than CME’s eroding returns. Cboe is better positioned to defend and grow market share into 2026.
Which stock offers better returns?
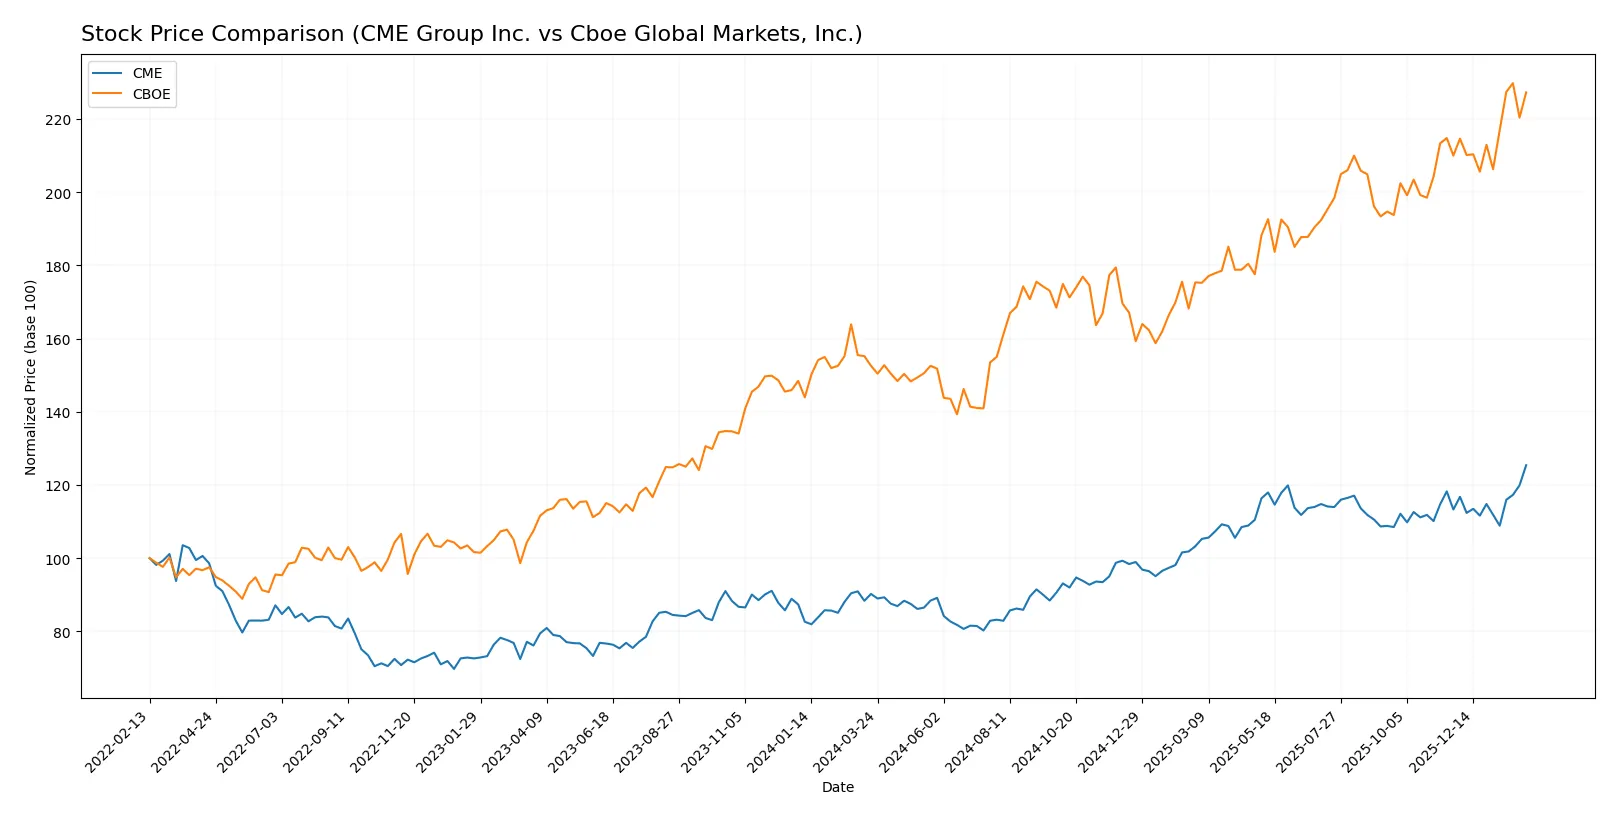
The past year shows strong bullish momentum for both stocks, with notable price acceleration and sustained buyer interest driving significant gains.
Trend Comparison
CME Group Inc. rose 39.0% over 12 months, exhibiting price acceleration and a high volatility level (std dev 29.7). The highest price hit 302.27, with a recent 10.7% gain signaling sustained strength.
Cboe Global Markets, Inc. gained 49.0% in the same period, also with accelerating momentum and slightly lower volatility (std dev 27.5). Its peak was 276.39, with an 8.2% rise recently, maintaining a bullish slope.
Cboe outperformed CME with a higher overall return of 49.0% versus 39.0%, despite CME’s stronger recent momentum. Both show robust buyer dominance and increasing volume trends.
Target Prices
Analysts present a positive consensus for CME Group Inc. and Cboe Global Markets, Inc., reflecting confidence in their growth prospects.
| Company | Target Low | Target High | Consensus |
|---|---|---|---|
| CME Group Inc. | 300 | 340 | 311.83 |
| Cboe Global Markets, Inc. | 240 | 295 | 274 |
CME’s target consensus of 311.83 modestly exceeds its current price of 302.27, signaling moderate upside. Cboe’s consensus at 274 aligns closely with its 273.09 market price, suggesting a balanced risk-reward outlook.

Don’t Let Luck Decide Your Entry Point
Optimize your entry points with our advanced ProRealTime indicators. You’ll get efficient buy signals with precise price targets for maximum performance. Start outperforming now!
How do institutions grade them?
CME Group Inc. Grades
The following table summarizes recent grades assigned to CME Group by major institutions.
| Grading Company | Action | New Grade | Date |
|---|---|---|---|
| TD Cowen | Maintain | Buy | 2026-02-05 |
| Morgan Stanley | Maintain | Overweight | 2026-02-05 |
| Barclays | Maintain | Equal Weight | 2026-02-05 |
| JP Morgan | Maintain | Underweight | 2026-02-05 |
| RBC Capital | Maintain | Sector Perform | 2026-02-05 |
Cboe Global Markets, Inc. Grades
The following table summarizes recent grades assigned to Cboe Global Markets by major institutions.
| Grading Company | Action | New Grade | Date |
|---|---|---|---|
| TD Cowen | Maintain | Hold | 2026-01-14 |
| Piper Sandler | Maintain | Overweight | 2026-01-14 |
| Barclays | Maintain | Overweight | 2026-01-08 |
| UBS | Maintain | Neutral | 2026-01-07 |
| Morgan Stanley | Maintain | Underweight | 2025-12-22 |
Which company has the best grades?
CME Group generally receives higher and more consistent grades, including Buy and Overweight ratings. Cboe’s grades show more Neutral and Hold ratings. Investors might view CME as having stronger institutional support.
Risks specific to each company
The following categories identify the critical pressure points and systemic threats facing both firms in the 2026 market environment:
1. Market & Competition
CME Group Inc.
- Dominates with a 108B market cap and broad futures/options portfolio, but faces asset turnover challenges.
Cboe Global Markets, Inc.
- Smaller 29B market cap, diversified segments, but higher beta suggests more market sensitivity.
2. Capital Structure & Debt
CME Group Inc.
- Strong balance sheet with low debt-to-equity (0.12) and excellent interest coverage (42x).
Cboe Global Markets, Inc.
- Higher leverage (0.33 D/E) and poor interest coverage (-29) raise financial stability concerns.
3. Stock Volatility
CME Group Inc.
- Low beta (0.28) signals defensive stock with steady price movement.
Cboe Global Markets, Inc.
- Slightly more volatile beta (0.36) indicates higher price fluctuations.
4. Regulatory & Legal
CME Group Inc.
- Operates global futures markets with regulatory compliance complexity.
Cboe Global Markets, Inc.
- Faces scrutiny across multiple regions and product lines, increasing legal risk.
5. Supply Chain & Operations
CME Group Inc.
- Operationally stable but low asset turnover (0.03) may signal inefficiencies.
Cboe Global Markets, Inc.
- Higher asset turnover (0.51) suggests better operational efficiency.
6. ESG & Climate Transition
CME Group Inc.
- Limited data, but traditional futures exposure may pressure ESG ratings.
Cboe Global Markets, Inc.
- Diverse global operations increase exposure to ESG regulatory changes.
7. Geopolitical Exposure
CME Group Inc.
- US-centric but with global contracts; moderate geopolitical risk.
Cboe Global Markets, Inc.
- Broader international footprint raises exposure to geopolitical instability.
Which company shows a better risk-adjusted profile?
Cboe’s most significant risk is its weak interest coverage, signaling financial strain despite favorable profitability metrics. CME’s primary concern is its distressed Altman Z-Score, indicating bankruptcy risk despite a stronger balance sheet. Overall, Cboe offers a better risk-adjusted profile, supported by a safe-zone Altman Z-Score and stronger Piotroski score. This contrast highlights CME’s urgent need to address liquidity and asset utilization inefficiencies in 2026.
Final Verdict: Which stock to choose?
CME Group Inc. stands out as a cash-generating powerhouse with superb operational margins and steady income growth. However, its declining ROIC signals a strategic challenge that investors must monitor closely. CME fits well into aggressive growth portfolios willing to accept some operational risk for strong cash flows.
Cboe Global Markets, Inc. boasts a robust strategic moat anchored in high returns on invested capital and a growing profitability trend. Its healthier balance sheet and favorable liquidity profile offer greater safety relative to CME. CBOE suits investors seeking growth at a reasonable price with a preference for financial stability.
If you prioritize cash flow strength and are comfortable navigating some efficiency headwinds, CME is the compelling choice due to its dominant revenue quality. However, if you seek durable competitive advantage combined with better stability, CBOE outshines with superior capital returns and a safer financial footing, commanding a premium for quality.
Disclaimer: Investment carries a risk of loss of initial capital. The past performance is not a reliable indicator of future results. Be sure to understand risks before making an investment decision.
Go Further
I encourage you to read the complete analyses of CME Group Inc. and Cboe Global Markets, Inc. to enhance your investment decisions: