In today’s fast-evolving technology landscape, cybersecurity and cloud infrastructure are crucial battlegrounds for innovation and market leadership. Palo Alto Networks, Inc. (PANW) and Cloudflare, Inc. (NET) both operate in the software infrastructure industry, offering advanced security solutions that protect enterprises worldwide. Their overlapping markets and differing innovation strategies make them compelling rivals. In this article, I will help you determine which company stands out as the more attractive investment opportunity.

Table of contents
Companies Overview
I will begin the comparison between Palo Alto Networks and Cloudflare by providing an overview of these two companies and their main differences.
Palo Alto Networks Overview
Palo Alto Networks, Inc. is a leading cybersecurity provider offering firewall appliances, software, and subscription services for threat prevention and network security. Founded in 2005 and headquartered in Santa Clara, CA, it serves medium to large enterprises, service providers, and government entities across various industries. The company focuses on cloud security, secure access, security analytics, and professional services, positioning itself as a comprehensive infrastructure security vendor.
Cloudflare Overview
Cloudflare, Inc. is a cloud services provider specializing in integrated cloud-based security and performance solutions. Established in 2009 and based in San Francisco, CA, Cloudflare offers cloud firewall, bot management, DDoS protection, content delivery, and developer tools. It serves a diverse customer base, including technology, healthcare, financial services, and government sectors, aiming to secure and accelerate internet properties and applications globally.
Key similarities and differences
Both Palo Alto Networks and Cloudflare operate in the Software – Infrastructure industry, focusing on cybersecurity solutions. While Palo Alto Networks emphasizes firewall appliances and comprehensive threat prevention for enterprises, Cloudflare offers cloud-native security combined with performance and reliability services. Palo Alto Networks has a larger workforce and market capitalization, whereas Cloudflare’s solutions extend more broadly into content delivery and developer platforms, reflecting differing business models within the cybersecurity space.
Income Statement Comparison
The table below compares the most recent fiscal year income statement figures for Palo Alto Networks, Inc. and Cloudflare, Inc., highlighting key financial metrics for investors.
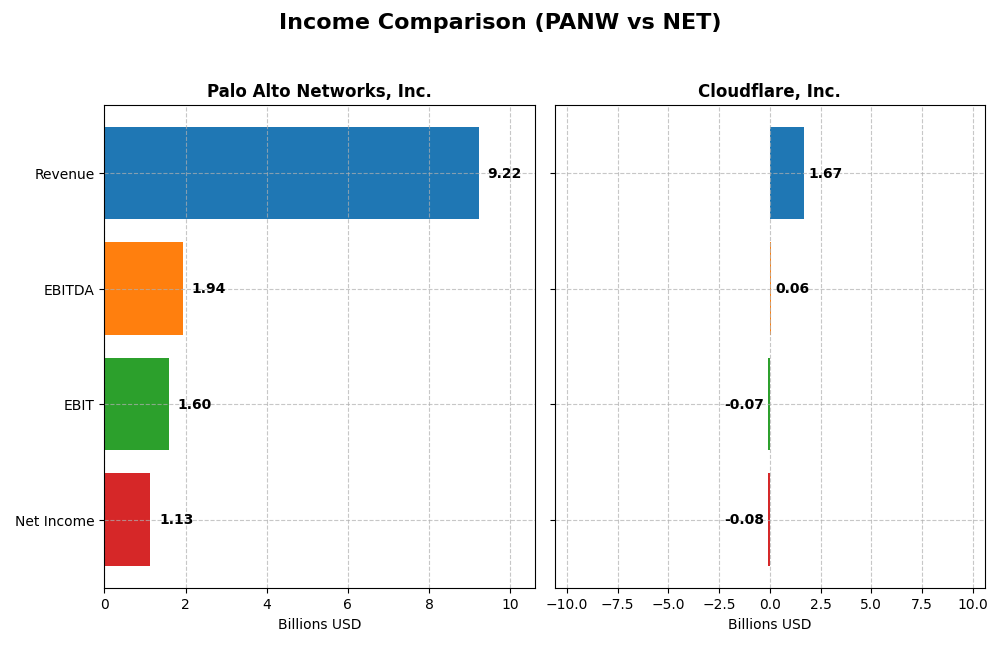
| Metric | Palo Alto Networks, Inc. | Cloudflare, Inc. |
|---|---|---|
| Market Cap | 128.4B | 64.5B |
| Revenue | 9.22B | 1.67B |
| EBITDA | 1.94B | 62M |
| EBIT | 1.60B | -66M |
| Net Income | 1.13B | -79M |
| EPS | 1.71 | -0.23 |
| Fiscal Year | 2025 | 2024 |
Income Statement Interpretations
Palo Alto Networks, Inc.
From 2021 to 2025, Palo Alto Networks exhibited strong revenue growth, surging from $4.3B to $9.2B, with net income rising from a loss of $499M in 2021 to $1.13B in 2025. Margins improved notably, with a gross margin of 73.4% and an EBIT margin of 17.3% in 2025. The latest year showed 14.9% revenue growth but a notable net margin decline of 61.7%.
Cloudflare, Inc.
Cloudflare’s revenue increased markedly from $431M in 2020 to $1.67B in 2024, with net losses narrowing from $119M to $78.8M in the same period. Its gross margin remained strong at 77.3%, though EBIT and net margins stayed negative at -3.9% and -4.7% respectively in 2024. The company posted a 28.8% revenue growth and a 66.7% improvement in net margin in its most recent year.
Which one has the stronger fundamentals?
Both companies display favorable overall income statement evaluations with 85.7% favorable metrics. Palo Alto Networks shows stronger profitability with positive net and EBIT margins and significant net income growth, despite a recent margin dip. Cloudflare demonstrates rapid revenue growth and margin improvements but remains unprofitable at the net and EBIT levels, indicating less mature fundamentals.
Financial Ratios Comparison
The table below compares the latest key financial ratios for Palo Alto Networks, Inc. and Cloudflare, Inc., providing a snapshot of their profitability, liquidity, leverage, and valuation metrics for fiscal year 2025 and 2024 respectively.
| Ratios | Palo Alto Networks, Inc. (2025) | Cloudflare, Inc. (2024) |
|---|---|---|
| ROE | 14.5% | -7.5% |
| ROIC | 5.7% | -6.1% |
| P/E | 101.4 | -466.5 |
| P/B | 14.7 | 35.1 |
| Current Ratio | 0.89 | 2.86 |
| Quick Ratio | 0.89 | 2.86 |
| D/E | 0.04 | 1.40 |
| Debt-to-Assets | 1.4% | 44.3% |
| Interest Coverage | 414.3 | -29.8 |
| Asset Turnover | 0.39 | 0.51 |
| Fixed Asset Turnover | 12.6 | 2.63 |
| Payout ratio | 0% | 0% |
| Dividend yield | 0% | 0% |
Interpretation of the Ratios
Palo Alto Networks, Inc.
Palo Alto Networks shows a slightly favorable profile with 43% favorable ratios, including strong interest coverage and low debt levels, but faces challenges with high price multiples (PE 101.43, PB 14.7) and a weak current ratio of 0.89. The company does not pay dividends, reflecting a focus on reinvestment and growth rather than shareholder distributions.
Cloudflare, Inc.
Cloudflare’s ratios indicate an unfavorable outlook with 57% unfavorable metrics, such as negative net margin (-4.72%) and return on equity (-7.53%), alongside high debt-to-equity (1.4) and poor interest coverage (-12.64). No dividends are paid, consistent with ongoing investments in R&D and expansion during its growth phase.
Which one has the best ratios?
Palo Alto Networks presents a stronger overall ratio profile with more favorable metrics and manageable debt compared to Cloudflare’s predominantly unfavorable ratios and higher leverage. However, both companies do not offer dividends, focusing on growth and reinvestment strategies.
Strategic Positioning
This section compares the strategic positioning of Palo Alto Networks and Cloudflare, covering Market position, Key segments, and Exposure to technological disruption:
Palo Alto Networks
- Leading cybersecurity provider with large market cap and moderate beta
- Focuses on firewall appliances, subscriptions, and support services for diverse industries
- Positioned in software infrastructure with exposure to evolving cybersecurity technologies
Cloudflare
- Cloud-based security and performance services with smaller market cap and higher beta
- Offers integrated cloud security, performance, reliability, and developer solutions
- Exposed to cloud innovation and emerging network security technologies like serverless and IoT
Palo Alto Networks vs Cloudflare Positioning
Palo Alto Networks has a diversified business with strong subscription and support revenue streams across multiple industries. Cloudflare concentrates on integrated cloud services, security, and performance solutions targeting broad digital platforms. Both face evolving tech disruptions but from different angles.
Which has the best competitive advantage?
Both firms are shedding value relative to their cost of capital but show improving profitability. Their slightly unfavorable MOAT ratings indicate ongoing challenges sustaining economic profits despite growth in ROIC, suggesting cautious evaluation of their competitive advantages.
Stock Comparison
The stock prices of Palo Alto Networks, Inc. (PANW) and Cloudflare, Inc. (NET) have shown significant bullish trends over the past 12 months, with both experiencing deceleration in upward momentum and recent declines in price.
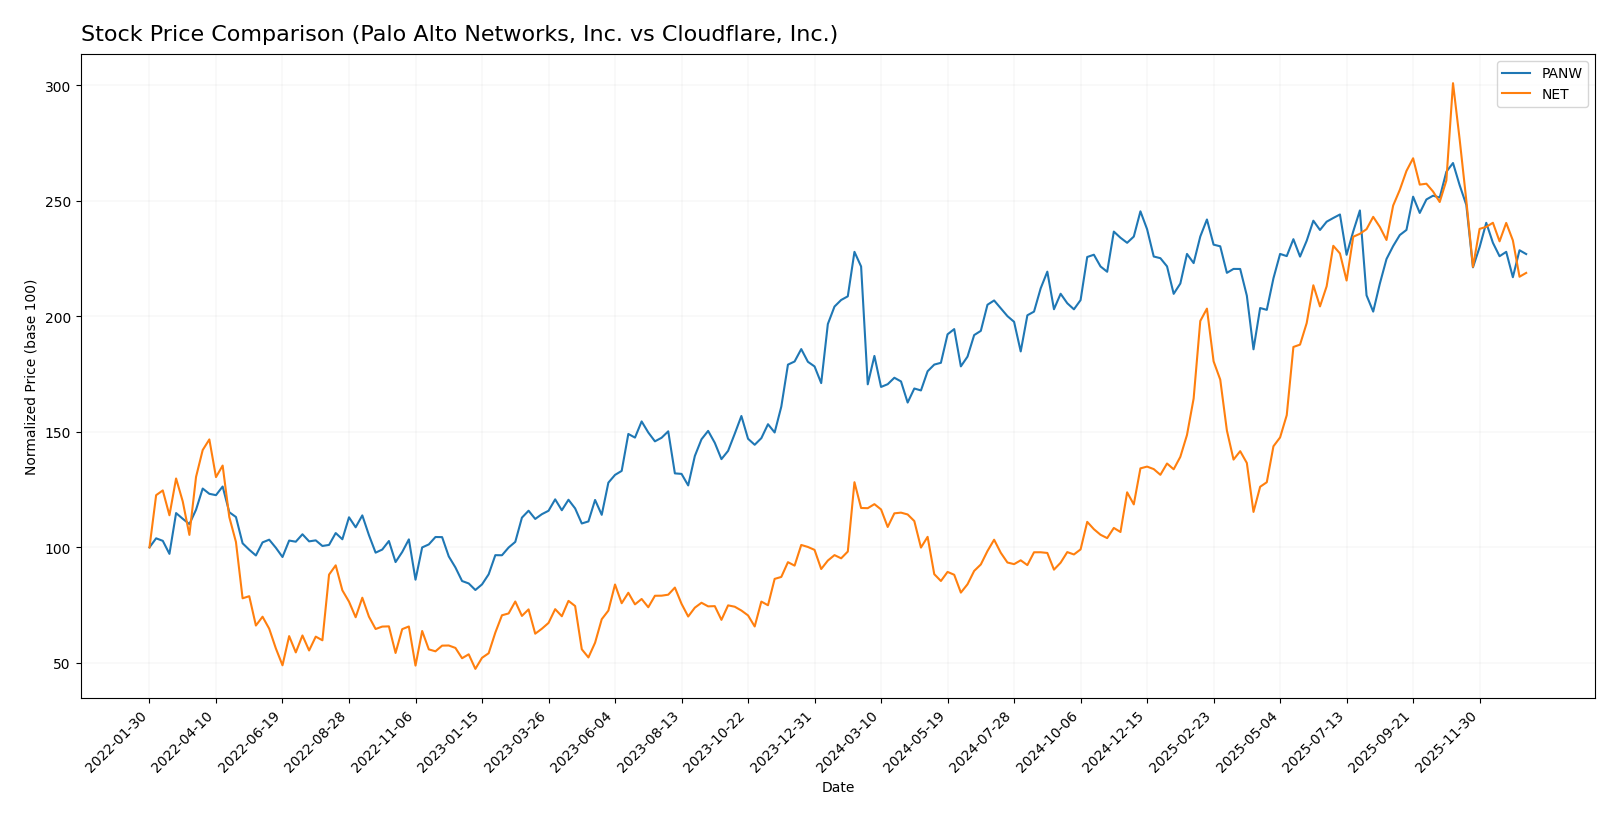
Trend Analysis
Palo Alto Networks, Inc. recorded a 33.05% price increase over the past 12 months, indicating a bullish trend with deceleration. The stock ranged from a low of 134.51 to a high of 220.24, with recent weeks showing a -14.79% decline.
Cloudflare, Inc. demonstrated a stronger bullish trend with an 87.07% rise over the same period, also decelerating. Its price fluctuated between 67.69 and 253.3, but recently dropped by -27.29%, reflecting increased volatility.
Comparing the two, Cloudflare, Inc. delivered the highest market performance with an 87.07% gain versus Palo Alto Networks’ 33.05% over the last year.
Target Prices
The current analyst consensus for target prices shows optimistic expectations for both Palo Alto Networks, Inc. and Cloudflare, Inc.
| Company | Target High | Target Low | Consensus |
|---|---|---|---|
| Palo Alto Networks, Inc. | 265 | 157 | 231.07 |
| Cloudflare, Inc. | 300 | 210 | 248.86 |
Analysts expect Palo Alto Networks’ price to rise from 187.66 to a consensus of 231.07, while Cloudflare’s price is forecasted to increase from 184.17 to 248.86, reflecting positive market sentiment.
Analyst Opinions Comparison
This section compares analysts’ ratings and financial scores for Palo Alto Networks, Inc. and Cloudflare, Inc.:
Rating Comparison
Palo Alto Networks, Inc. Rating
- Rating: B, indicating a very favorable standing.
- Discounted Cash Flow Score: 4, a favorable valuation.
- ROE Score: 4, showing strong profitability efficiency.
- ROA Score: 3, moderate asset utilization.
- Debt To Equity Score: 4, favorable financial stability.
- Overall Score: 3, moderate overall financial health.
Cloudflare, Inc. Rating
- Rating: D+, reflecting a very unfavorable standing.
- Discounted Cash Flow Score: 1, very unfavorable.
- ROE Score: 1, very unfavorable profitability.
- ROA Score: 1, very unfavorable asset utilization.
- Debt To Equity Score: 1, very unfavorable risk.
- Overall Score: 1, very unfavorable overall health.
Which one is the best rated?
Based strictly on the provided data, Palo Alto Networks is clearly better rated across every key financial score and overall rating compared to Cloudflare, which has very unfavorable scores in all categories.
Scores Comparison
The comparison of Palo Alto Networks and Cloudflare scores is as follows:
Palo Alto Networks Scores
- Altman Z-Score: 5.95, indicating a safe zone.
- Piotroski Score: 6, indicating average financial strength.
Cloudflare Scores
- Altman Z-Score: 9.47, indicating a safe zone.
- Piotroski Score: 2, indicating very weak financial strength.
Which company has the best scores?
Cloudflare has a higher Altman Z-Score, suggesting stronger bankruptcy safety, but Palo Alto Networks has a significantly better Piotroski Score, indicating stronger overall financial health based on profitability and efficiency.
Grades Comparison
Here is a detailed comparison of the latest reliable grades for Palo Alto Networks, Inc. and Cloudflare, Inc.:
Palo Alto Networks, Inc. Grades
This table summarizes recent grades and actions from reputable grading companies for Palo Alto Networks, Inc.:
| Grading Company | Action | New Grade | Date |
|---|---|---|---|
| UBS | maintain | Neutral | 2026-01-13 |
| Piper Sandler | maintain | Overweight | 2026-01-05 |
| Guggenheim | upgrade | Neutral | 2026-01-05 |
| Morgan Stanley | maintain | Overweight | 2025-12-18 |
| Goldman Sachs | maintain | Buy | 2025-11-21 |
| HSBC | downgrade | Reduce | 2025-11-21 |
| Needham | maintain | Buy | 2025-11-20 |
| WestPark Capital | maintain | Hold | 2025-11-20 |
| Bernstein | maintain | Outperform | 2025-11-20 |
| DA Davidson | maintain | Buy | 2025-11-20 |
Overall, Palo Alto Networks shows a generally positive grading trend, with several Buy and Overweight ratings, though HSBC’s Reduce rating introduces some caution.
Cloudflare, Inc. Grades
This table summarizes recent grades and actions from reputable grading companies for Cloudflare, Inc.:
| Grading Company | Action | New Grade | Date |
|---|---|---|---|
| UBS | maintain | Neutral | 2026-01-13 |
| Piper Sandler | maintain | Neutral | 2026-01-05 |
| Argus Research | maintain | Buy | 2025-11-10 |
| Citigroup | maintain | Buy | 2025-11-03 |
| Susquehanna | maintain | Neutral | 2025-11-03 |
| Stifel | maintain | Buy | 2025-10-31 |
| RBC Capital | maintain | Outperform | 2025-10-31 |
| Keybanc | maintain | Overweight | 2025-10-31 |
| Needham | maintain | Buy | 2025-10-31 |
| Mizuho | maintain | Outperform | 2025-10-31 |
Cloudflare’s grades consistently range from Neutral to Buy and Outperform, indicating stable positive sentiment across multiple firms.
Which company has the best grades?
Both companies have a consensus Buy rating; however, Palo Alto Networks shows a wider range from Reduce to Buy, while Cloudflare maintains steadier Buy and Outperform ratings. This suggests Cloudflare may currently enjoy more uniform positive analyst sentiment, potentially offering clearer signals to investors.
Strengths and Weaknesses
Below is a comparative overview of the strengths and weaknesses of Palo Alto Networks, Inc. (PANW) and Cloudflare, Inc. (NET) based on their financial performance, market position, and operational metrics as of 2026.
| Criterion | Palo Alto Networks, Inc. (PANW) | Cloudflare, Inc. (NET) |
|---|---|---|
| Diversification | Strong product and subscription mix; $1.8B product, $4.97B subscription revenue in 2025 | Single reportable segment with $1.67B revenue in 2024; less diversified |
| Profitability | Positive net margin (12.3%), ROIC 5.67%, but ROIC below WACC (7.37%) indicating slight value destruction | Negative net margin (-4.72%), negative ROIC (-6.06%), shedding value with high cost of capital (12.89%) |
| Innovation | Growing ROIC trend (+224%), indicating improving operational efficiency | Growing ROIC trend (+22%), but overall profitability remains negative |
| Global presence | Well-established global cybersecurity player with broad customer base | Expanding cloud services with increasing global footprint but less mature than PANW |
| Market Share | Significant share in cybersecurity with expanding subscription base | Growing presence in cloud infrastructure but smaller market share compared to PANW |
Key takeaways: Palo Alto Networks shows a more diversified and profitable business model with improving returns despite slight value destruction. Cloudflare is growing but remains unprofitable with higher financial risks. Investors should weigh innovation potential against current profitability risks.
Risk Analysis
Below is a comparative table of key risks for Palo Alto Networks, Inc. (PANW) and Cloudflare, Inc. (NET) based on the most recent data:
| Metric | Palo Alto Networks, Inc. (PANW) | Cloudflare, Inc. (NET) |
|---|---|---|
| Market Risk | Moderate (Beta 0.75, stable tech sector) | High (Beta 1.97, volatile stock) |
| Debt level | Low (Debt/Equity 0.04, favorable) | High (Debt/Equity 1.4, unfavorable) |
| Regulatory Risk | Moderate (cybersecurity regulations) | Moderate (cloud and data privacy regulations) |
| Operational Risk | Moderate (large enterprise exposure) | Moderate (smaller size, fast growth challenges) |
| Environmental Risk | Low (software-focused, minimal direct impact) | Low (cloud-based services, minimal footprint) |
| Geopolitical Risk | Moderate (global enterprise and government clients) | Moderate (global customer base, data sovereignty concerns) |
The most likely and impactful risks revolve around market volatility and debt management. Cloudflare’s elevated beta and high debt level increase its financial risk, while Palo Alto Networks benefits from a more stable market profile and low leverage. Both face moderate regulatory and geopolitical risks inherent in cybersecurity and cloud infrastructure sectors.
Which Stock to Choose?
Palo Alto Networks, Inc. (PANW) shows steady income growth with a 14.87% revenue increase in 2025 and a favorable net margin of 12.3%. Its financial ratios are slightly favorable, highlighting low debt (D/E 0.04) and strong interest coverage, though valuation multiples appear stretched. The company’s profitability is rising despite a slightly unfavorable MOAT rating, and it holds a solid B rating with a safe Altman Z-score.
Cloudflare, Inc. (NET) reports robust revenue growth of 28.76% in 2024 but continues to deliver negative net margins (-4.72%) and returns on equity (-7.53%). Financial ratios are mostly unfavorable, especially concerning high debt (D/E 1.4) and weak interest coverage. Despite a very unfavorable overall rating and very weak Piotroski score, NET’s Altman Z-score indicates financial stability, though its MOAT evaluation is also slightly unfavorable.
Investors prioritizing stability and a favorable financial profile might find PANW’s improving profitability and moderate valuation more aligned with risk-averse or quality investing strategies. Conversely, those with a higher risk tolerance and focus on high revenue growth could interpret NET’s performance as a potential growth opportunity despite its weaker profitability and financial ratios.
Disclaimer: Investment carries a risk of loss of initial capital. The past performance is not a reliable indicator of future results. Be sure to understand risks before making an investment decision.
Go Further
I encourage you to read the complete analyses of Palo Alto Networks, Inc. and Cloudflare, Inc. to enhance your investment decisions: