In the dynamic world of technology infrastructure, Oracle Corporation and Cloudflare, Inc. stand out as influential players shaping enterprise solutions and cloud services. Both companies operate in the software infrastructure sector, yet they differ in scale, innovation focus, and market approach. Comparing these industry leaders offers valuable insights for investors seeking growth and stability. Join me as we explore which company presents the most compelling investment opportunity in 2026.

Table of contents
Companies Overview
I will begin the comparison between Oracle Corporation and Cloudflare, Inc. by providing an overview of these two companies and their main differences.
Oracle Corporation Overview
Oracle Corporation focuses on providing enterprise information technology products and services worldwide. Its offerings include cloud software applications such as ERP, performance management, and supply chain solutions, as well as infrastructure technologies like the Oracle Database and Java. Founded in 1977 and headquartered in Austin, Texas, Oracle serves diverse industries with cloud, hardware, and consulting services, positioning itself as a comprehensive software infrastructure provider.
Cloudflare, Inc. Overview
Cloudflare, Inc. operates as a cloud services provider delivering integrated security and performance solutions globally. Its portfolio includes cloud firewalls, DDoS protection, content delivery, and developer tools tailored for multiple platforms like public and private clouds, SaaS, and IoT. Founded in 2009 and based in San Francisco, California, Cloudflare focuses on securing and optimizing internet applications for various sectors, including technology, healthcare, and government.
Key similarities and differences
Both Oracle and Cloudflare operate in the software infrastructure industry, offering cloud-based solutions to businesses worldwide. Oracle emphasizes comprehensive enterprise IT environments with a broad range of software and hardware products, while Cloudflare specializes in cloud security, performance, and reliability services. Oracle’s larger scale and diverse hardware portfolio contrast with Cloudflare’s focused approach on internet security and optimization technologies.
Income Statement Comparison
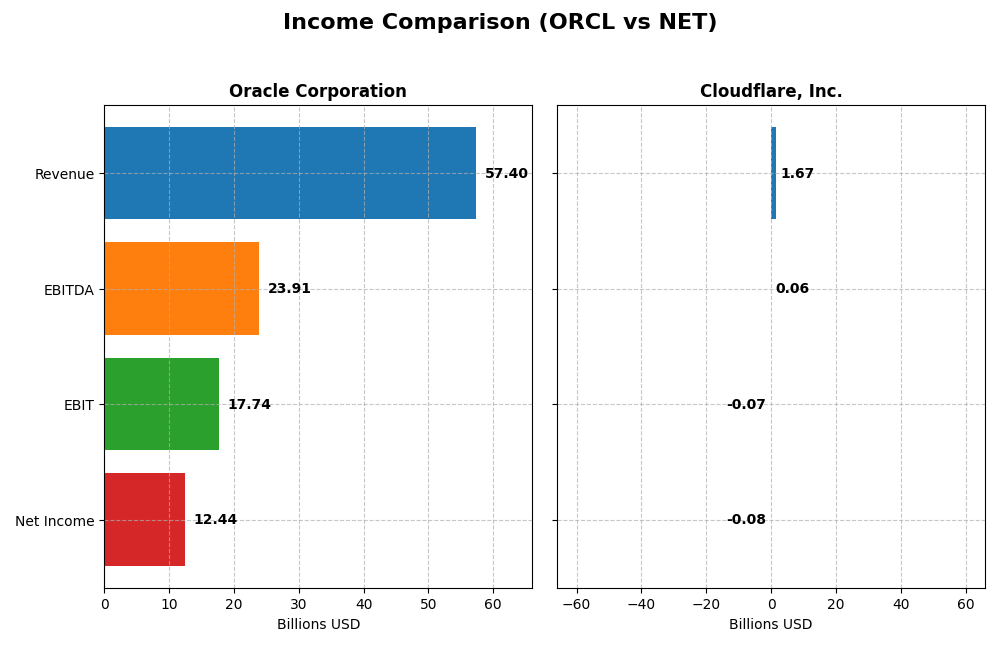
The table below compares key income statement metrics for Oracle Corporation and Cloudflare, Inc. for their most recent fiscal years, providing a snapshot of their financial performance.
| Metric | Oracle Corporation | Cloudflare, Inc. |
|---|---|---|
| Market Cap | 549B | 64.5B |
| Revenue | 57.4B | 1.67B |
| EBITDA | 23.9B | 62M |
| EBIT | 17.7B | -66M |
| Net Income | 12.4B | -79M |
| EPS | 4.46 | -0.23 |
| Fiscal Year | 2025 | 2024 |
Income Statement Interpretations
Oracle Corporation
Oracle’s revenue demonstrated a consistent upward trend from 2021 to 2025, growing from $40.5B to $57.4B, while net income showed volatility, peaking in 2021 and declining overall. Margins remained generally favorable, with a gross margin above 70% and net margin around 21.7% in 2025. The latest year saw revenue growth accelerate to 8.38%, alongside a 16.28% increase in EBIT and improved net margin.
Cloudflare, Inc.
Cloudflare’s revenue expanded rapidly from $431M in 2020 to $1.67B in 2024, with net income losses narrowing significantly. Despite a favorable gross margin of 77.3%, the company posted a negative EBIT margin of -3.9% and net margin of -4.7% in 2024. However, recent growth rates are robust, including a 28.8% revenue increase and a 66.7% improvement in net margin over the past year.
Which one has the stronger fundamentals?
Oracle shows strong margin stability and positive net income in recent years, reflecting mature profitability but with some net income decline over the period. Cloudflare exhibits impressive revenue and margin growth but remains unprofitable at the EBIT and net income levels. Oracle’s fundamentals emphasize profitability and margin strength, while Cloudflare focuses on rapid expansion with improving but negative earnings.
Financial Ratios Comparison
This table compares the most recent key financial ratios for Oracle Corporation (ORCL) and Cloudflare, Inc. (NET) based on fiscal year 2025 for ORCL and fiscal year 2024 for NET, providing a snapshot of their financial performance and stability.
| Ratios | Oracle Corporation (ORCL) | Cloudflare, Inc. (NET) |
|---|---|---|
| ROE | 60.84% | -7.53% |
| ROIC | 10.86% | -6.06% |
| P/E | 37.10 | -466.54 |
| P/B | 22.57 | 35.14 |
| Current Ratio | 0.75 | 2.86 |
| Quick Ratio | 0.75 | 2.86 |
| D/E (Debt to Equity) | 5.09 | 1.40 |
| Debt-to-Assets | 61.83% | 44.32% |
| Interest Coverage | 4.94 | -29.78 |
| Asset Turnover | 0.34 | 0.51 |
| Fixed Asset Turnover | 1.32 | 2.63 |
| Payout Ratio | 38.12% | 0% |
| Dividend Yield | 1.03% | 0% |
Interpretation of the Ratios
Oracle Corporation
Oracle shows strong profitability ratios with a net margin of 21.68% and a robust return on equity at 60.84%, indicating efficient capital use. However, liquidity ratios like the current ratio at 0.75 and high debt levels (debt-to-equity at 5.09) raise concerns. Oracle pays dividends, offering a 1.03% yield with moderate payout risks due to some unfavorable leverage metrics.
Cloudflare, Inc.
Cloudflare exhibits weak profitability, reflected in a negative net margin of -4.72% and return on equity at -7.53%, signaling ongoing losses. Its liquidity is strong, with a current ratio of 2.86, but high valuation multiples and negative returns on invested capital highlight risks. Cloudflare does not pay dividends, focusing on reinvestment in growth and R&D instead.
Which one has the best ratios?
Both companies have a similar mix of favorable and unfavorable ratios, each facing distinct challenges. Oracle demonstrates strong profitability but weaker liquidity and leverage concerns, while Cloudflare struggles with profitability despite healthy liquidity. Neither shows an overall favorable ratio profile, reflecting caution for investors analyzing financial health.
Strategic Positioning
This section compares the strategic positioning of Oracle Corporation and Cloudflare, Inc., including their market position, key segments, and exposure to technological disruption:
Oracle Corporation
- Established leader in software infrastructure with $549B market cap; faces competitive pressure in enterprise IT.
- Diversified revenue from cloud and license ($49B), hardware ($2.9B), and services ($5.2B) businesses.
- Provides cloud, database, middleware, hardware, and consulting; moderate disruption risk from cloud trends.
Cloudflare, Inc.
- Smaller $64.5B market cap cloud services provider; competes in cloud security and performance solutions market.
- Focused on integrated cloud security, performance, and developer solutions with $1.67B reported segment revenue.
- Innovates in cloud firewall, DDoS protection, and serverless computing; exposed to rapid cloud technology shifts.
Oracle Corporation vs Cloudflare, Inc. Positioning
Oracle maintains a diversified business across cloud, hardware, and services, providing broad enterprise IT solutions. Cloudflare concentrates on cloud security and performance, with a narrower but innovative product range, implying distinct market focus and operational scale differences.
Which has the best competitive advantage?
Both companies show slightly unfavorable MOAT status due to shedding value, but Cloudflare exhibits growing profitability, whereas Oracle’s profitability declines, indicating Cloudflare’s improving capital efficiency despite ongoing value destruction.
Stock Comparison
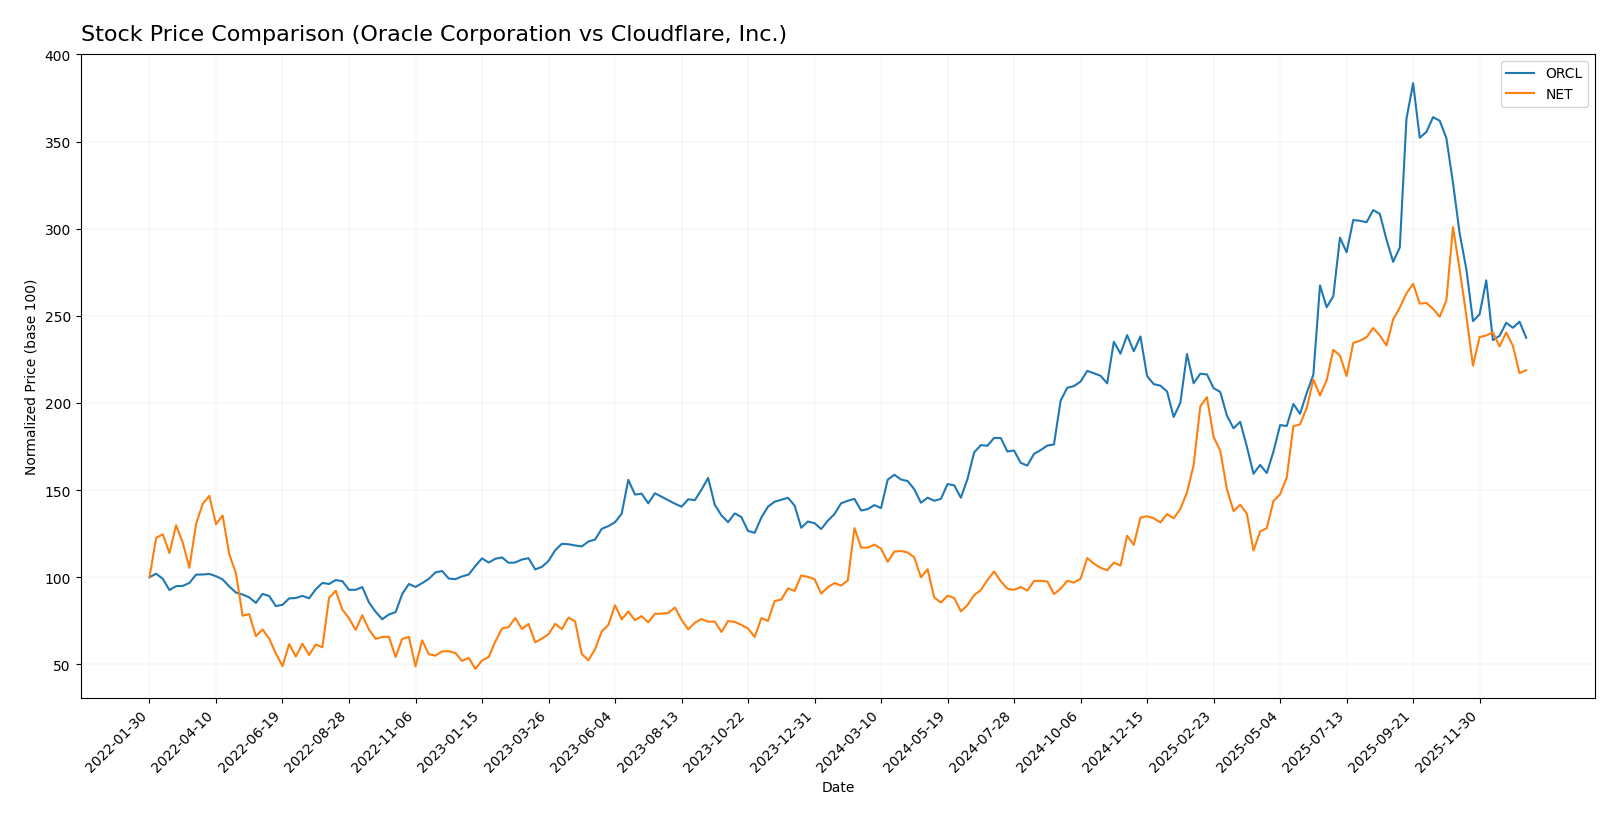
The stock price chart highlights significant bullish trends for Oracle Corporation and Cloudflare, Inc. over the past 12 months, with both showing decelerating upward momentum and recent declines in trading activity.
Trend Analysis
Oracle Corporation’s stock surged 70.69% over the past year, indicating a bullish trend with decelerating acceleration. It reached a high of 308.66 and a low of 111.95, showing notable volatility with a 49.0 standard deviation.
Cloudflare, Inc. experienced an 87.07% price increase over the past year, also bullish with deceleration. It had a high of 253.3 and a low of 67.69, exhibiting slightly higher volatility at 52.73 standard deviation.
Both stocks posted similar recent declines near -27%, with Oracle and Cloudflare showing slight seller dominance. Cloudflare led in overall performance with the higher annual gain of 87.07% compared to Oracle’s 70.69%.
Target Prices
The target price consensus for Oracle Corporation and Cloudflare, Inc. indicates analyst expectations for growth potential.
| Company | Target High | Target Low | Consensus |
|---|---|---|---|
| Oracle Corporation | 400 | 175 | 314.08 |
| Cloudflare, Inc. | 300 | 210 | 248.86 |
Analysts expect Oracle’s stock to rise significantly from its current price of 191.09 USD, while Cloudflare’s consensus target price also suggests upside potential versus its current 184.17 USD price.
Analyst Opinions Comparison
This section compares analysts’ ratings and grades for Oracle Corporation and Cloudflare, Inc.:
Rating Comparison
ORCL Rating
- Rated B, classified as Very Favorable overall.
- Discounted Cash Flow Score is 3, considered Moderate for valuation assessment.
- Return on Equity Score is 5, reflecting Very Favorable profit generation.
- Return on Assets Score is 4, marked as Favorable asset utilization.
- Debt to Equity Score is 1, signaling Very Unfavorable financial risk profile.
- Overall Score is 3, categorized as Moderate financial standing.
NET Rating
- Rated D+, classified as Very Favorable overall.
- Discounted Cash Flow Score is 1, indicating Very Unfavorable valuation metrics.
- Return on Equity Score is 1, showing Very Unfavorable profit efficiency.
- Return on Assets Score is 1, rated Very Unfavorable for asset use.
- Debt to Equity Score is 1, also Very Unfavorable for financial stability.
- Overall Score is 1, considered Very Unfavorable overall.
Which one is the best rated?
Oracle Corporation holds a significantly stronger rating profile than Cloudflare, Inc., with higher scores in valuation, profitability, and asset utilization. Although both show high financial risk, Oracle’s overall financial health is rated moderate versus Cloudflare’s very unfavorable standing.
Scores Comparison
The following table compares the Altman Z-Score and Piotroski Score of Oracle Corporation and Cloudflare, Inc.:
Oracle Scores
- Altman Z-Score: 2.43, in the grey zone indicating moderate bankruptcy risk.
- Piotroski Score: 5, classified as average financial strength.
Cloudflare Scores
- Altman Z-Score: 9.47, in the safe zone indicating low bankruptcy risk.
- Piotroski Score: 2, classified as very weak financial strength.
Which company has the best scores?
Cloudflare has a significantly higher Altman Z-Score placing it in the safe zone, while Oracle’s score is in the grey zone. However, Oracle’s Piotroski Score is stronger than Cloudflare’s, indicating better financial health by that metric.
Grades Comparison
Here is a detailed comparison of recent grades assigned to Oracle Corporation and Cloudflare, Inc.:
Oracle Corporation Grades
The table below summarizes recent grades from reputable grading companies for Oracle Corporation:
| Grading Company | Action | New Grade | Date |
|---|---|---|---|
| UBS | Maintain | Buy | 2026-01-05 |
| RBC Capital | Maintain | Sector Perform | 2026-01-05 |
| Jefferies | Maintain | Buy | 2026-01-05 |
| Goldman Sachs | Maintain | Neutral | 2025-12-12 |
| Keybanc | Maintain | Overweight | 2025-12-11 |
| UBS | Maintain | Buy | 2025-12-11 |
| Citigroup | Maintain | Buy | 2025-12-11 |
| JP Morgan | Maintain | Neutral | 2025-12-11 |
| DA Davidson | Maintain | Neutral | 2025-12-11 |
| Scotiabank | Maintain | Sector Outperform | 2025-12-11 |
Oracle’s grades generally trend toward Buy and Neutral ratings, with several firms maintaining Buy or Overweight positions, indicating moderate confidence in the stock’s performance.
Cloudflare, Inc. Grades
The following table presents recent grades from recognized grading companies for Cloudflare, Inc.:
| Grading Company | Action | New Grade | Date |
|---|---|---|---|
| UBS | Maintain | Neutral | 2026-01-13 |
| Piper Sandler | Maintain | Neutral | 2026-01-05 |
| Argus Research | Maintain | Buy | 2025-11-10 |
| Citigroup | Maintain | Buy | 2025-11-03 |
| Susquehanna | Maintain | Neutral | 2025-11-03 |
| Stifel | Maintain | Buy | 2025-10-31 |
| RBC Capital | Maintain | Outperform | 2025-10-31 |
| Keybanc | Maintain | Overweight | 2025-10-31 |
| Needham | Maintain | Buy | 2025-10-31 |
| Mizuho | Maintain | Outperform | 2025-10-31 |
Cloudflare’s ratings show a mix of Buy, Outperform, and Neutral grades, suggesting a cautiously optimistic outlook from analysts.
Which company has the best grades?
Both Oracle Corporation and Cloudflare, Inc. hold a consensus rating of Buy; however, Oracle has a larger number of Buy ratings (51 vs. 25) and fewer Hold recommendations, suggesting slightly stronger analyst conviction. This difference could impact investor perception of stability and growth potential.
Strengths and Weaknesses
Below is a comparison of key strengths and weaknesses for Oracle Corporation (ORCL) and Cloudflare, Inc. (NET) based on recent financial and operational data:
| Criterion | Oracle Corporation (ORCL) | Cloudflare, Inc. (NET) |
|---|---|---|
| Diversification | Highly diversified: Cloud & License $49.2B, Services $5.2B, Hardware $2.9B in 2025 | Less diversified: Single main segment ~$1.67B revenue in 2024 |
| Profitability | Strong profitability: Net margin 21.7%, ROIC 10.9%, ROE 60.8% (2025) | Negative profitability: Net margin -4.7%, ROIC -6.1%, ROE -7.5% (2024) |
| Innovation | Moderate: Established tech with steady cloud growth, but declining ROIC trend | High innovation: Growing ROIC, improving profitability trend despite current losses |
| Global presence | Extensive global operations and market penetration | Growing global presence but smaller scale compared to Oracle |
| Market Share | Large market share in enterprise software and cloud sectors | Emerging player in cloud security and performance services |
Oracle’s strengths lie in its diversified revenue streams and strong profitability metrics, although its ROIC trend is declining, signaling some efficiency challenges. Cloudflare, while currently unprofitable, shows promising growth in ROIC and innovation, positioning it as a fast-growing player with a focus on cloud security. Both companies exhibit an overall slightly unfavorable moat status, reflecting the competitive pressures in their industries.
Risk Analysis
Below is a comparison of key risks affecting Oracle Corporation and Cloudflare, Inc. as of their most recent fiscal years:
| Metric | Oracle Corporation (ORCL) | Cloudflare, Inc. (NET) |
|---|---|---|
| Market Risk | Beta 1.65, high valuation risks | Beta 1.97, volatile tech sector |
| Debt level | High debt-to-assets 61.8% | Moderate debt-to-assets 44.3% |
| Regulatory Risk | Moderate, US tech regulations | Moderate, global data/privacy laws |
| Operational Risk | Complex legacy & cloud transition | Rapid growth, integration risks |
| Environmental Risk | Moderate, hardware footprint | Low, cloud service focus |
| Geopolitical Risk | US-centric, some global exposure | Global CDN network, potential geo restrictions |
Oracle faces significant leverage risks with a debt-to-assets ratio near 62%, increasing financial vulnerability despite strong profitability. Cloudflare’s high beta signals elevated market risk, while its operational risks stem from fast expansion and integration challenges. Investors should closely monitor Oracle’s debt management and Cloudflare’s ability to sustain growth amid regulatory and geopolitical pressures.
Which Stock to Choose?
Oracle Corporation (ORCL) shows a favorable income evolution with 8.38% revenue growth in 2025 and strong profitability metrics, including a 21.68% net margin and 60.84% ROE. However, it faces financial challenges with a current ratio below 1, high debt levels (net debt to EBITDA 3.9), and a slightly unfavorable moat due to declining ROIC versus WACC. The overall rating is very favorable (B), but with some unfavorable financial ratios.
Cloudflare, Inc. (NET) exhibits robust revenue growth of 28.76% in 2024 and improving profitability, though still negative net margin (-4.72%) and ROE (-7.53%). It maintains a strong liquidity position with a current ratio of 2.86 but carries substantial debt risk (net debt to EBITDA 21.2) and a slightly unfavorable moat despite a growing ROIC trend. Ratings are very unfavorable (D+), reflecting financial instability and weakness in key ratios.
Investors focused on growth might find Cloudflare’s accelerating revenue and improving profitability appealing despite its financial risks, while those valuing established profitability and stronger ratings may view Oracle’s stable income and favorable margins as more attractive. The choice could depend on risk tolerance and investment strategy, with both companies showing some financial concerns.
Disclaimer: Investment carries a risk of loss of initial capital. The past performance is not a reliable indicator of future results. Be sure to understand risks before making an investment decision.
Go Further
I encourage you to read the complete analyses of Oracle Corporation and Cloudflare, Inc. to enhance your investment decisions: