In the dynamic world of technology infrastructure, Cloudflare, Inc. (NET) and Okta, Inc. (OKTA) stand out as innovators addressing critical aspects of digital security and cloud services. Both companies operate in the software infrastructure industry, with overlapping markets in cloud-based security and identity management. This comparison will help investors discern which company presents the most compelling opportunity for their portfolio in 2026. Let’s explore their strengths and potential risks together.

Table of contents
Companies Overview
I will begin the comparison between Cloudflare and Okta by providing an overview of these two companies and their main differences.
Cloudflare Overview
Cloudflare, Inc. is a cloud services provider focused on delivering integrated security and performance solutions globally. Its offerings include cloud firewall, DDoS protection, content delivery, and developer tools, serving industries like technology, healthcare, and finance. Founded in 2009 and headquartered in San Francisco, Cloudflare operates with around 4,400 employees and holds a market capitalization of approximately 68.7B USD.
Okta Overview
Okta, Inc. specializes in identity management solutions for enterprises, SMBs, universities, and governments internationally. Its Okta Identity Cloud platform provides services such as single sign-on, adaptive multi-factor authentication, and API access management. Headquartered in San Francisco with about 5,900 employees, Okta was founded in 2009 and has a market cap near 14.2B USD, trading on NASDAQ.
Key similarities and differences
Both Cloudflare and Okta operate within the software infrastructure industry and are headquartered in San Francisco. Cloudflare focuses broadly on cloud security and performance optimization, while Okta concentrates on identity and access management services. Cloudflare’s market cap and employee count exceed those of Okta, and their product portfolios reflect distinct enterprise needs—Cloudflare in network security and content delivery, Okta in user authentication and authorization.
Income Statement Comparison
Below is a comparison of key income statement metrics for Cloudflare, Inc. and Okta, Inc. based on their most recent fiscal years.

| Metric | Cloudflare, Inc. (2024) | Okta, Inc. (2025) |
|---|---|---|
| Market Cap | 68.7B | 14.2B |
| Revenue | 1.67B | 2.61B |
| EBITDA | 62.0M | 139.0M |
| EBIT | -65.7M | 51.0M |
| Net Income | -78.8M | 28.0M |
| EPS | -0.23 | 0.17 |
| Fiscal Year | 2024 | 2025 |
Income Statement Interpretations
Cloudflare, Inc.
Cloudflare’s revenue grew significantly from 431M in 2020 to 1.67B in 2024, with net losses steadily narrowing from -260M to -78.8M. Gross margins remained strong at 77.3%, but operating and net margins stayed negative, though improving. The 2024 results showed a solid 28.8% revenue increase and a 66.7% net margin growth, indicating margin improvement despite continuing losses.
Okta, Inc.
Okta’s revenue rose from 835M in 2021 to 2.61B in 2025, with net income swinging from -266M to a positive 28M in 2025. Gross margin was stable around 76.3%, while EBIT margin improved from negative to slightly positive 1.95%. The 2025 fiscal year marked a turnaround with positive net and EBIT margins, reflecting improved profitability and operational efficiency.
Which one has the stronger fundamentals?
Both Cloudflare and Okta demonstrate favorable revenue and gross margin growth, but Okta’s transition to positive net income and EBIT margin in 2025 contrasts with Cloudflare’s ongoing net losses despite improvements. Cloudflare shows faster revenue growth, while Okta exhibits stronger profitability metrics recently. Each company presents strengths, but Okta’s profitability gains stand out relative to Cloudflare’s margin challenges.
Financial Ratios Comparison
The table below provides a side-by-side comparison of key financial ratios for Cloudflare, Inc. (NET) and Okta, Inc. (OKTA) based on their most recent fiscal year data.
| Ratios | Cloudflare, Inc. (NET) 2024 | Okta, Inc. (OKTA) 2025 |
|---|---|---|
| ROE | -7.53% | 0.44% |
| ROIC | -6.06% | -0.61% |
| P/E | -466.54 | 570.60 |
| P/B | 35.14 | 2.49 |
| Current Ratio | 2.86 | 1.35 |
| Quick Ratio | 2.86 | 1.35 |
| D/E | 1.40 | 0.15 |
| Debt-to-Assets | 44.32% | 10.09% |
| Interest Coverage | -29.78 | -14.80 |
| Asset Turnover | 0.51 | 0.28 |
| Fixed Asset Turnover | 2.63 | 22.31 |
| Payout Ratio | 0 | 0 |
| Dividend Yield | 0 | 0 |
Interpretation of the Ratios
Cloudflare, Inc.
Cloudflare shows mostly unfavorable financial ratios including negative net margin (-4.72%), return on equity (-7.53%), and return on invested capital (-6.06%). Its current and quick ratios are favorable at 2.86, indicating decent short-term liquidity. The company does not pay dividends, likely due to ongoing losses and reinvestment in growth, with no share buybacks noted.
Okta, Inc.
Okta presents a mixed ratio profile with favorable debt metrics (debt-to-equity 0.15, interest coverage 10.2) and quick ratio (1.35), but suffers from low profitability margins (net margin 1.07%) and unfavorable returns on equity (0.44%). Okta does not pay dividends, consistent with a growth strategy focused on reinvestment and R&D rather than shareholder payouts.
Which one has the best ratios?
Between the two, Okta holds a more balanced ratio set with 42.86% favorable metrics versus Cloudflare’s 21.43%. Okta’s stronger capital structure and liquidity contrast with Cloudflare’s significant profitability and coverage challenges. However, both companies exhibit areas of concern, making their overall ratio assessments cautious.
Strategic Positioning
This section compares the strategic positioning of Cloudflare, Inc. and Okta, Inc., focusing on Market position, Key segments, and Exposure to technological disruption:
Cloudflare, Inc.
- Market position and competitive pressure
- Key segments and business drivers
- Exposure to technological disruption
Okta, Inc.
- Leading cloud services provider with broad infrastructure security, facing competitive tech industry pressures.
- Offers integrated cloud security, performance, reliability, and developer solutions across multiple industries.
- Operates in cloud security and performance, vulnerable to rapid innovation in cybersecurity and cloud services.
Cloudflare, Inc. vs Okta, Inc. Positioning
Cloudflare pursues a diversified strategy offering security, performance, and reliability solutions to various sectors. Okta concentrates on identity management with subscription-driven revenue. Cloudflare’s broader scope contrasts with Okta’s specialized focus, each presenting distinct market advantages and risks based on the data.
Which has the best competitive advantage?
Both companies show growing ROIC but are currently shedding value, indicating no clear competitive moat. Cloudflare and Okta face challenges in value creation despite improving profitability trends.
Stock Comparison
The past year exhibited marked divergence in price movements for Cloudflare, Inc. and Okta, Inc., with Cloudflare showing strong gains amid decelerating momentum, while Okta experienced a moderate decline coupled with steady bearishness.
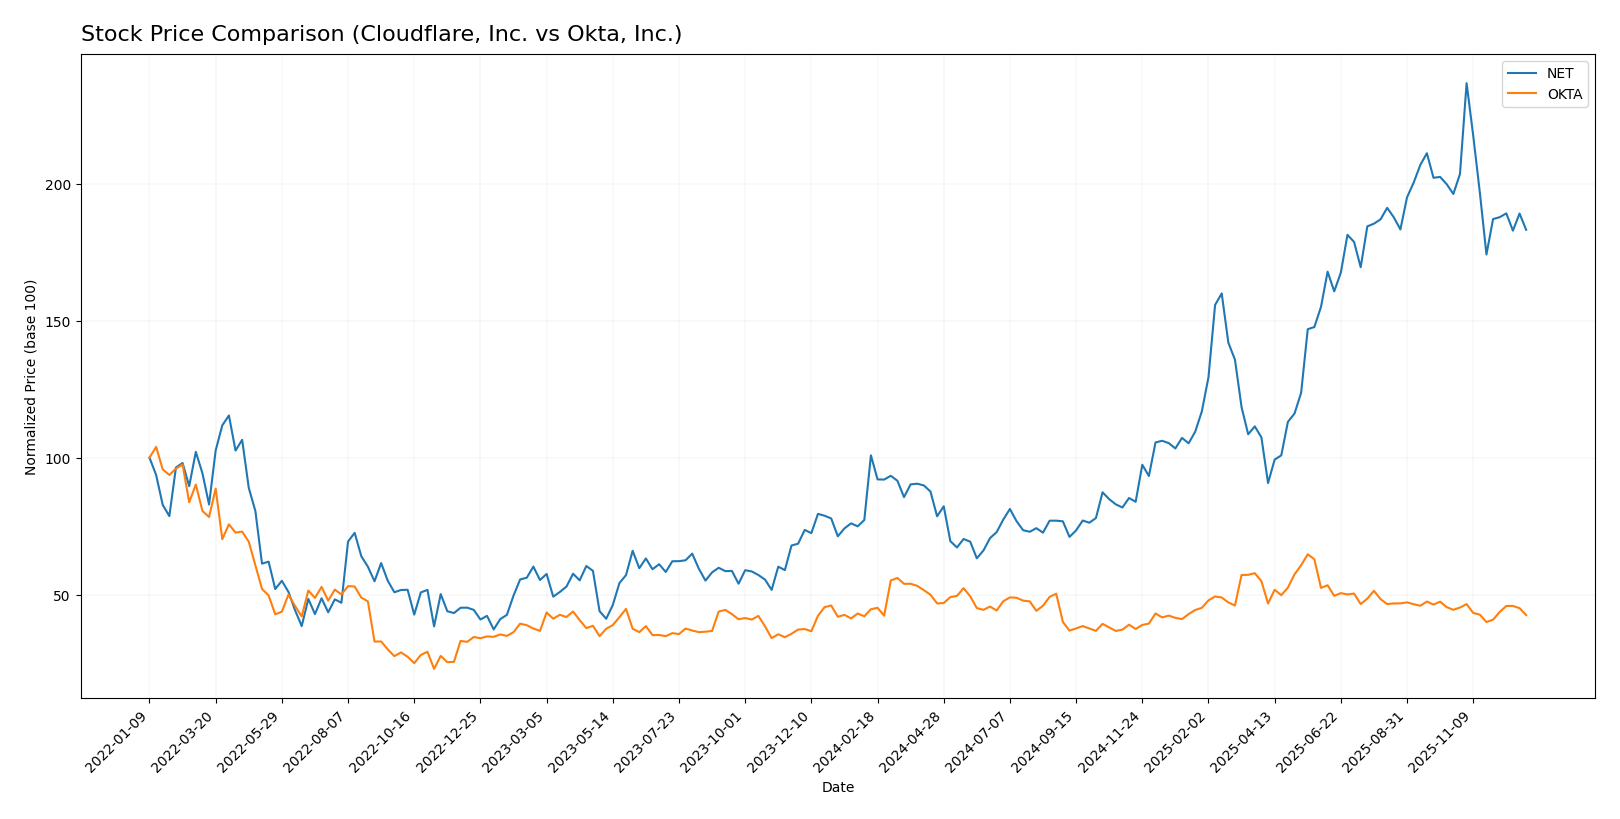
Trend Analysis
Cloudflare, Inc. (NET) posted an overall bullish trend with an 81.63% price increase over the past 12 months, showing deceleration and significant volatility (52.46 std deviation). The stock hit a high of 253.3 and a low of 67.69.
Okta, Inc. (OKTA) faced a bearish trend with a 4.79% price decline over the same period, also decelerating, and lower volatility at 11.39 std deviation. Its price ranged between 72.24 and 127.3.
Comparing the two, Cloudflare delivered the highest market performance with a strong upward price movement, whereas Okta showed a moderate downturn, reflecting contrasting investor sentiment and trading dynamics.
Target Prices
Analyst consensus sets clear target price ranges for Cloudflare, Inc. and Okta, Inc., reflecting moderate upside potential.
| Company | Target High | Target Low | Consensus |
|---|---|---|---|
| Cloudflare, Inc. | 300 | 224 | 253.43 |
| Okta, Inc. | 140 | 60 | 110.53 |
Cloudflare’s target consensus of 253.43 suggests a significant upside from its current price of 196.02. Okta’s consensus at 110.53 also indicates potential growth above its current 83.64 price. Both stocks show positive analyst expectations relative to market prices.
Analyst Opinions Comparison
This section compares analysts’ ratings and grades for Cloudflare, Inc. and Okta, Inc.:
Rating Comparison
Cloudflare, Inc. Rating
- Rating: D+, considered very favorable despite low scores.
- Discounted Cash Flow Score: 1, reflecting very unfavorable valuation.
- ROE Score: 1, showing very unfavorable efficiency in profit generation from equity.
- ROA Score: 1, very unfavorable asset utilization.
- Debt To Equity Score: 1, very unfavorable financial risk profile.
- Overall Score: 1, very unfavorable overall financial standing.
Okta, Inc. Rating
- Rating: B, regarded as very favorable with better scores.
- Discounted Cash Flow Score: 4, indicating a favorable valuation.
- ROE Score: 2, moderate efficiency in generating profit from equity.
- ROA Score: 3, moderate asset utilization effectiveness.
- Debt To Equity Score: 3, moderate financial risk profile.
- Overall Score: 3, moderate overall financial standing.
Which one is the best rated?
Based strictly on the provided data, Okta, Inc. holds a better rating (B) compared to Cloudflare’s D+. Okta outperforms Cloudflare across all key financial scores, indicating a stronger financial position.
Scores Comparison
Here is a comparison of the Altman Z-Score and Piotroski Score for Cloudflare, Inc. and Okta, Inc.:
Cloudflare, Inc. Scores
- Altman Z-Score: 9.94, indicating a strong safe zone status.
- Piotroski Score: 2, classified as very weak financial health.
Okta, Inc. Scores
- Altman Z-Score: 3.74, also in the safe zone but lower.
- Piotroski Score: 8, classified as very strong financial health.
Which company has the best scores?
Okta shows a strong Piotroski Score of 8 compared to Cloudflare’s very weak 2, while both are in the safe zone for Altman Z-Score. Based on these scores, Okta demonstrates overall stronger financial health.
Grades Comparison
The following is a comparison of the most recent grades assigned to Cloudflare, Inc. and Okta, Inc.:
Cloudflare, Inc. Grades
This table summarizes recent grades from major financial analysts for Cloudflare, Inc.:
| Grading Company | Action | New Grade | Date |
|---|---|---|---|
| Argus Research | Maintain | Buy | 2025-11-10 |
| Citigroup | Maintain | Buy | 2025-11-03 |
| Susquehanna | Maintain | Neutral | 2025-11-03 |
| Mizuho | Maintain | Outperform | 2025-10-31 |
| Cantor Fitzgerald | Maintain | Neutral | 2025-10-31 |
| UBS | Maintain | Neutral | 2025-10-31 |
| Stifel | Maintain | Buy | 2025-10-31 |
| RBC Capital | Maintain | Outperform | 2025-10-31 |
| Wells Fargo | Maintain | Overweight | 2025-10-31 |
| Piper Sandler | Maintain | Neutral | 2025-10-31 |
Cloudflare’s grades predominantly indicate a positive outlook, with multiple “Buy” and “Outperform” ratings maintained across reputable firms.
Okta, Inc. Grades
Below are the latest grades from recognized grading institutions for Okta, Inc.:
| Grading Company | Action | New Grade | Date |
|---|---|---|---|
| Jefferies | Upgrade | Buy | 2025-12-16 |
| Needham | Maintain | Buy | 2025-12-12 |
| BTIG | Maintain | Buy | 2025-12-04 |
| Guggenheim | Maintain | Buy | 2025-12-03 |
| JP Morgan | Maintain | Overweight | 2025-12-03 |
| BTIG | Maintain | Buy | 2025-12-03 |
| BMO Capital | Maintain | Market Perform | 2025-12-03 |
| Citigroup | Maintain | Neutral | 2025-12-03 |
| Piper Sandler | Maintain | Neutral | 2025-12-03 |
| Susquehanna | Maintain | Neutral | 2025-12-03 |
Okta’s ratings mostly reflect a favorable view, with several “Buy” grades and one recent upgrade by Jefferies.
Which company has the best grades?
Okta, Inc. has received slightly stronger recent upgrades, including a notable buy rating upgrade, compared to Cloudflare, Inc., which has consistently positive but more mixed “Neutral” and “Buy” ratings. This suggests investors may perceive Okta as having a marginally more optimistic outlook in the near term.
Strengths and Weaknesses
Below is a comparative overview of Cloudflare, Inc. (NET) and Okta, Inc. (OKTA) based on their recent performance and key investment criteria.
| Criterion | Cloudflare, Inc. (NET) | Okta, Inc. (OKTA) |
|---|---|---|
| Diversification | Mainly focused on cloud services, limited product scope | More diversified with subscription and technology services |
| Profitability | Negative net margin (-4.72%) and ROIC (-6.06%), shedding value but improving | Slightly positive net margin (1.07%), ROIC slightly negative (-0.61%), shedding value but improving |
| Innovation | Growing ROIC trend indicating improving efficiency and innovation | Strong ROIC growth trend (+92%), indicating rapid profitability improvements |
| Global presence | Strong global cloud infrastructure presence | Global identity and access management services with expanding reach |
| Market Share | Significant in cloud security and CDN market | Leading in identity management with growing subscription revenue |
Key takeaways: Both companies are currently shedding value as their ROIC remains below WACC, though they show improving profitability trends. Okta’s broader product diversification and strong ROIC growth suggest a more balanced risk profile, whereas Cloudflare’s focused cloud services offer potential upside if profitability continues to improve. Caution and continued monitoring of financial health are advised.
Risk Analysis
Below is a comparison table highlighting key risks for Cloudflare, Inc. (NET) and Okta, Inc. (OKTA) based on the most recent data from 2025-2026.
| Metric | Cloudflare, Inc. (NET) | Okta, Inc. (OKTA) |
|---|---|---|
| Market Risk | High beta of 1.95, indicating strong sensitivity to market swings | Moderate beta of 0.78, less volatile than NET |
| Debt level | Debt-to-Equity ratio of 1.4 (unfavorable), interest coverage negative (-12.64) | Low Debt-to-Equity of 0.15 (favorable), strong interest coverage (10.2) |
| Regulatory Risk | Moderate, as a cloud security provider subject to data privacy and cybersecurity laws | Moderate, identity management services also face regulatory scrutiny |
| Operational Risk | Unfavorable margins and returns, indicating profitability and efficiency challenges | Margins near breakeven, operational efficiency moderate but improving |
| Environmental Risk | Low direct exposure, typical for software infrastructure firms | Low direct exposure, limited environmental impact |
| Geopolitical Risk | Moderate, global cloud services subject to international data regulations and tensions | Moderate, global client base and data sovereignty concerns |
Synthesis: Cloudflare faces high market volatility and financial stress, with unfavorable debt levels and weak profitability posing significant risks. Okta shows better financial health with lower debt and stronger operational scores but has a sky-high P/E, indicating valuation risk. Market and financial risks are most impactful for NET, while OKTA’s risks center on valuation and moderate operational challenges.
Which Stock to Choose?
Cloudflare, Inc. (NET) has shown strong revenue growth of 28.76% in the last year and a favorable income statement overall, despite negative profitability ratios and significant debt. Its financial ratios remain mostly unfavorable, with a high debt-to-equity ratio and negative returns on equity and capital. The company’s rating is very unfavorable despite a favorable global income statement view.
Okta, Inc. (OKTA) exhibits moderate revenue growth of 15.33% and a generally favorable income statement with neutral net margin and EBIT margin. Financial ratios are balanced with a moderate overall stance, showing favorable debt management and interest coverage, though profitability ratios remain weak. The company holds a moderate rating with a very strong Piotroski score and solid Altman Z-score.
For investors, Okta may appear more stable given its moderate rating, stronger financial health scores, and balanced debt metrics, while Cloudflare’s high growth but unfavorable financial ratios and very unfavorable rating could be seen as higher risk. Growth-oriented investors might find Cloudflare’s revenue momentum appealing, whereas those preferring a more moderate risk profile could view Okta’s financial stability and improving profitability as favorable.
Disclaimer: Investment carries a risk of loss of initial capital. The past performance is not a reliable indicator of future results. Be sure to understand risks before making an investment decision.
Go Further
I encourage you to read the complete analyses of Cloudflare, Inc. and Okta, Inc. to enhance your investment decisions: