In today’s fast-evolving tech landscape, choosing the right infrastructure software company to invest in can be challenging. Cloudflare, Inc. (NET) and Oddity Tech Ltd. (ODD) both operate within the software infrastructure sector but target distinct markets—Cloudflare focuses on cloud security and performance solutions, while Oddity Tech innovates in consumer tech with digital-first beauty and wellness brands. This article will help you determine which company presents a more compelling investment opportunity in 2026.

Table of contents
Companies Overview
I will begin the comparison between Cloudflare and Oddity Tech by providing an overview of these two companies and their main differences.
Cloudflare Overview
Cloudflare, Inc. is a US-based cloud services provider focused on delivering integrated cloud-based security and performance solutions. Its offerings span cloud firewall, bot management, and content delivery, securing diverse platforms from public clouds to IoT devices. Founded in 2009 and headquartered in San Francisco, Cloudflare serves industries including technology, healthcare, and financial services, positioning itself as a leader in software infrastructure with a market cap of $64.5B.
Oddity Tech Overview
Oddity Tech Ltd., headquartered in Tel Aviv-Jaffa, Israel, operates as a consumer-tech company specializing in beauty and wellness products powered by proprietary PowerMatch technology. The company builds and scales digital-first brands to transform traditionally offline industries. Established in 2013, Oddity Tech trades on NASDAQ with a market cap of $2B, focusing on product lines under IL MAKIAGE and SpoiledChild, targeting global consumer markets in the software infrastructure sector.
Key similarities and differences
Both Cloudflare and Oddity Tech operate within the software infrastructure industry but differ sharply in market focus and scale. Cloudflare emphasizes cloud security and performance solutions for enterprise clients across multiple sectors, while Oddity Tech targets consumer wellness and beauty through digital brand innovation. Cloudflare’s much larger market capitalization and broader service portfolio contrast with Oddity’s niche consumer product approach and smaller workforce, highlighting distinct business models within the technology sector.
Income Statement Comparison
The table below compares key income statement metrics for Cloudflare, Inc. and Oddity Tech Ltd. based on their most recent fiscal year data.
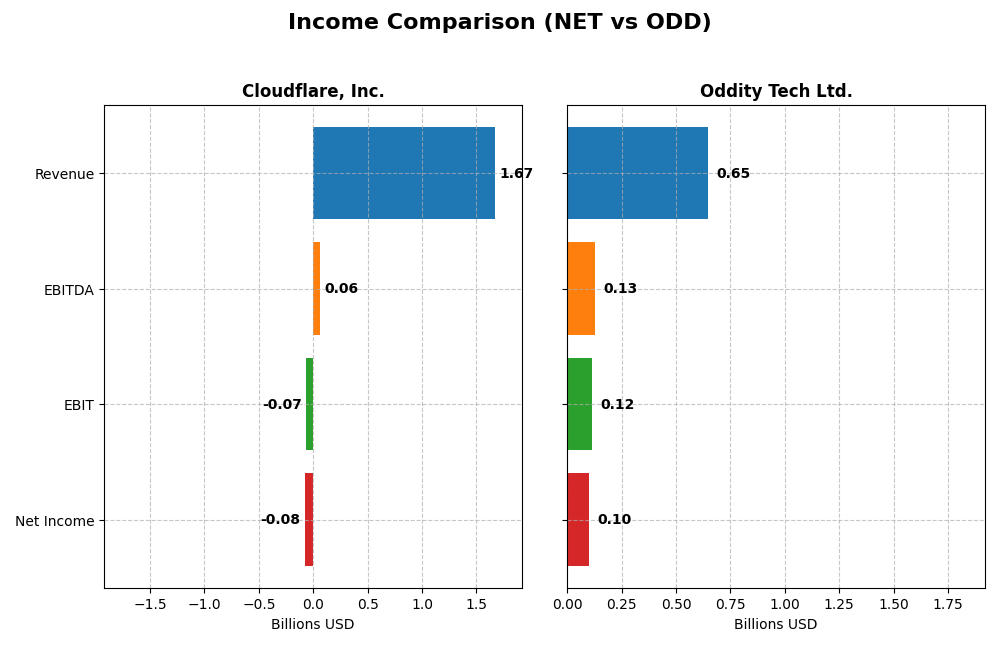
| Metric | Cloudflare, Inc. (NET) | Oddity Tech Ltd. (ODD) |
|---|---|---|
| Market Cap | 64.5B | 2.01B |
| Revenue | 1.67B | 647M |
| EBITDA | 62M | 125M |
| EBIT | -66M | 116M |
| Net Income | -79M | 101M |
| EPS | -0.23 | 1.78 |
| Fiscal Year | 2024 | 2024 |
Income Statement Interpretations
Cloudflare, Inc.
Cloudflare’s revenue surged from $431M in 2020 to $1.67B in 2024, reflecting a strong growth trajectory. Despite improved gross margins at 77.3%, the company reported net losses each year, though net losses narrowed significantly in 2024. Operating income remains negative, but recent improvements suggest operational efficiencies and margin expansion, with net income loss shrinking by over 57% from 2023 to 2024.
Oddity Tech Ltd.
Oddity Tech demonstrated robust revenue growth, increasing from $111M in 2020 to $647M in 2024. Net income rose substantially, reaching $101M in 2024, supported by a strong net margin of 15.7%. Both gross and EBIT margins improved, reflecting operational scalability. The company’s growth in revenue and profitability accelerated in 2024, with net income and EPS posting double-digit percentage increases year-over-year.
Which one has the stronger fundamentals?
Oddity Tech exhibits stronger fundamentals with consistent profitability, positive EBIT and net margins, and significant income growth over the period. Cloudflare shows impressive revenue growth and margin improvement but continues to report net losses despite narrowing deficits. Oddity’s profitability and margin stability provide a more favorable income statement profile compared to Cloudflare’s ongoing operational challenges.
Financial Ratios Comparison
The table below presents a side-by-side comparison of key financial ratios for Cloudflare, Inc. (NET) and Oddity Tech Ltd. (ODD) based on their latest fiscal year data from 2024.
| Ratios | Cloudflare, Inc. (NET) | Oddity Tech Ltd. (ODD) |
|---|---|---|
| ROE | -7.53% | 35.95% |
| ROIC | -6.06% | 28.56% |
| P/E | -466.5 | 23.75 |
| P/B | 35.14 | 8.54 |
| Current Ratio | 2.86 | 1.79 |
| Quick Ratio | 2.86 | 0.99 |
| D/E | 1.40 | 0.08 |
| Debt-to-Assets | 44.32% | 5.17% |
| Interest Coverage | -29.78 | 1521.05 |
| Asset Turnover | 0.51 | 1.47 |
| Fixed Asset Turnover | 2.63 | 19.38 |
| Payout ratio | 0 | 0 |
| Dividend yield | 0% | 0% |
Interpretation of the Ratios
Cloudflare, Inc.
Cloudflare shows a predominantly unfavorable ratio profile, with negative net margin (-4.72%) and return on equity (-7.53%), indicating operational and profitability challenges. The high price-to-book ratio (35.14) and negative interest coverage further highlight financial stress. The current and quick ratios are strong at 2.86, suggesting liquidity strength. The company does not pay dividends, likely due to ongoing losses and reinvestment priorities.
Oddity Tech Ltd.
Oddity Tech exhibits a mostly favorable financial ratio set, with strong net margin (15.69%), return on equity (35.95%), and return on invested capital (28.56%), reflecting solid profitability and efficient capital use. The low debt-to-equity ratio (0.08) and excellent interest coverage (1521.05) underscore financial stability. Despite no dividend payments, this may result from a growth-focused strategy or reinvestment in the business.
Which one has the best ratios?
Oddity Tech Ltd. presents a clearly more favorable ratio profile with multiple strong profitability and liquidity metrics, contrasting with Cloudflare’s predominantly unfavorable ratios and financial challenges. Oddity’s low leverage and high returns enhance its financial health compared to Cloudflare, which struggles with losses and high valuation multiples.
Strategic Positioning
This section compares the strategic positioning of Cloudflare, Inc. and Oddity Tech Ltd., focusing on market position, key segments, and exposure to technological disruption:
Cloudflare, Inc.
- Large market cap of 64.5B in cloud infrastructure, facing significant competition.
- Provides integrated cloud security, performance, and developer solutions worldwide.
- Operates in a rapidly evolving cloud services sector with ongoing technological innovation.
Oddity Tech Ltd.
- Smaller market cap of 2B, operating in consumer-tech beauty and wellness sectors.
- Focuses on digital-first beauty and wellness brands using PowerMatch technology.
- Disrupts offline beauty/wellness markets with digital technology but less tech disruption risk.
Cloudflare, Inc. vs Oddity Tech Ltd. Positioning
Cloudflare shows a diversified approach with broad cloud infrastructure services, supporting multiple industries globally. Oddity adopts a concentrated strategy focusing on digital beauty and wellness brands, leveraging niche technology for market disruption.
Which has the best competitive advantage?
Oddity Tech demonstrates a very favorable moat with growing ROIC above WACC, indicating durable competitive advantage. Cloudflare’s slightly unfavorable moat shows value destruction despite improving profitability, suggesting weaker competitive advantage.
Stock Comparison
The past year’s stock price movements reveal a strong bullish trend with decelerating momentum for Cloudflare, Inc. (NET), contrasting with a bearish, decelerating trend for Oddity Tech Ltd. (ODD), both showing notable price fluctuations and shifting trading volumes.
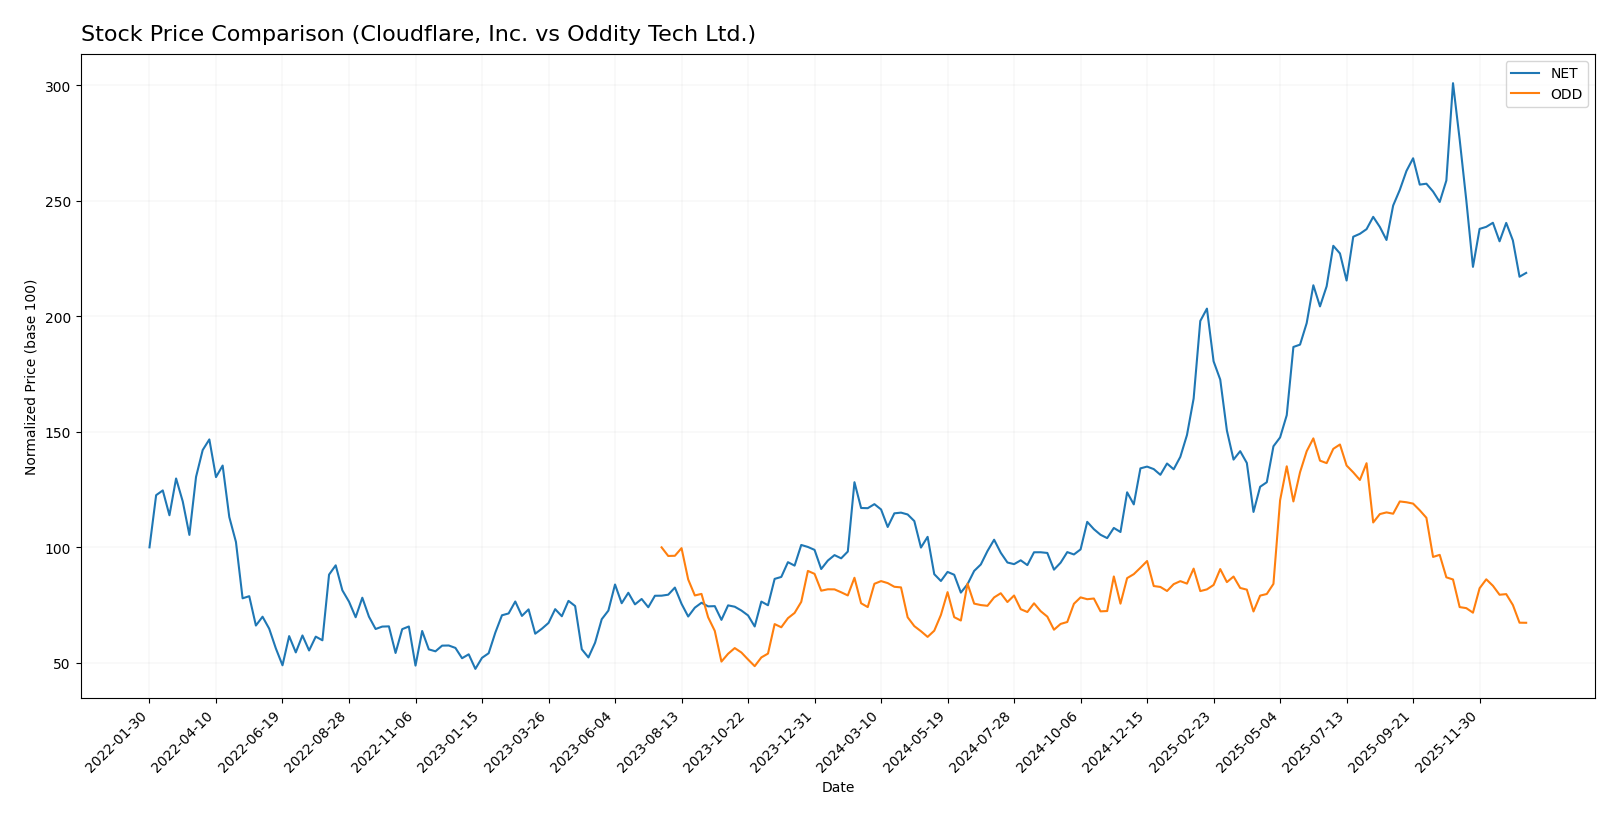
Trend Analysis
Cloudflare, Inc. (NET) experienced an 87.07% price increase over the past 12 months, indicating a bullish trend with deceleration in momentum. The stock ranged between 67.69 and 253.3, with recent volatility showing a 27.29% decline.
Oddity Tech Ltd. (ODD) recorded a 9.16% price decrease over the past year, reflecting a bearish trend with deceleration. Its price fluctuated between 32.19 and 77.35, with a recent 21.77% drop accompanied by low volatility.
Comparing the two, Cloudflare’s stock delivered the highest market performance with a significant positive gain, while Oddity Tech showed a consistent negative trend, underperforming relative to Cloudflare.
Target Prices
The current analyst consensus indicates promising upside potential for both Cloudflare, Inc. and Oddity Tech Ltd.
| Company | Target High | Target Low | Consensus |
|---|---|---|---|
| Cloudflare, Inc. | 300 | 210 | 248.86 |
| Oddity Tech Ltd. | 80 | 40 | 66.33 |
Analysts expect Cloudflare’s stock to appreciate significantly from its current price of $184.17, while Oddity Tech’s consensus target of $66.33 suggests a strong rebound from $35.40. Both show potential for notable gains.
Analyst Opinions Comparison
This section compares analysts’ ratings and grades for Cloudflare, Inc. and Oddity Tech Ltd.:
Rating Comparison
Cloudflare, Inc. Rating
- Rating: D+, considered very favorable overall
- Discounted Cash Flow Score: 1, very unfavorable
- ROE Score: 1, very unfavorable
- ROA Score: 1, very unfavorable
- Debt To Equity Score: 1, very unfavorable
- Overall Score: 1, very unfavorable
Oddity Tech Ltd. Rating
- Rating: B+, considered very favorable overall
- Discounted Cash Flow Score: 4, favorable
- ROE Score: 5, very favorable
- ROA Score: 4, favorable
- Debt To Equity Score: 3, moderate
- Overall Score: 3, moderate
Which one is the best rated?
Based strictly on the provided data, Oddity Tech Ltd. is better rated than Cloudflare, Inc. across all key financial scores, showing higher ratings in cash flow, profitability, and financial stability.
Scores Comparison
The following table compares the Altman Z-Score and Piotroski Score for Cloudflare, Inc. and Oddity Tech Ltd.:
Cloudflare, Inc. Scores
- Altman Z-Score of 9.47, indicating a strong safe zone rating
- Piotroski Score of 2, classified as very weak financial strength
Oddity Tech Ltd. Scores
- Altman Z-Score of 3.78, also in the safe zone but lower
- Piotroski Score of 6, reflecting average financial strength
Which company has the best scores?
Cloudflare has a significantly higher Altman Z-Score, placing it firmly in the safe zone, but a very weak Piotroski Score. Oddity Tech has a lower Altman Z-Score, still safe, and a stronger Piotroski Score indicating better financial strength.
Grades Comparison
Here is a detailed comparison of the grades for Cloudflare, Inc. and Oddity Tech Ltd.:
Cloudflare, Inc. Grades
The table below summarizes recent grades from well-known financial institutions for Cloudflare, Inc.:
| Grading Company | Action | New Grade | Date |
|---|---|---|---|
| Citigroup | Maintain | Buy | 2026-01-16 |
| UBS | Maintain | Neutral | 2026-01-13 |
| Piper Sandler | Maintain | Neutral | 2026-01-05 |
| Argus Research | Maintain | Buy | 2025-11-10 |
| Susquehanna | Maintain | Neutral | 2025-11-03 |
| Citigroup | Maintain | Buy | 2025-11-03 |
| Cantor Fitzgerald | Maintain | Neutral | 2025-10-31 |
| Stifel | Maintain | Buy | 2025-10-31 |
| UBS | Maintain | Neutral | 2025-10-31 |
| Keybanc | Maintain | Overweight | 2025-10-31 |
Cloudflare’s grades show a consistent pattern of buy and neutral ratings, indicating moderate confidence from analysts.
Oddity Tech Ltd. Grades
The table below summarizes recent grades from reputable financial firms for Oddity Tech Ltd.:
| Grading Company | Action | New Grade | Date |
|---|---|---|---|
| Keybanc | Maintain | Overweight | 2026-01-08 |
| JP Morgan | Maintain | Overweight | 2025-12-12 |
| JP Morgan | Maintain | Overweight | 2025-11-21 |
| Barclays | Maintain | Equal Weight | 2025-11-21 |
| Morgan Stanley | Maintain | Equal Weight | 2025-11-21 |
| Needham | Maintain | Buy | 2025-11-20 |
| Keybanc | Maintain | Overweight | 2025-10-08 |
| JMP Securities | Maintain | Market Outperform | 2025-09-23 |
| Morgan Stanley | Maintain | Equal Weight | 2025-08-06 |
| JMP Securities | Maintain | Market Outperform | 2025-08-05 |
Oddity Tech’s grades predominantly reflect overweight and market outperform ratings, showing positive analyst sentiment.
Which company has the best grades?
Both Cloudflare, Inc. and Oddity Tech Ltd. have a consensus “Buy” rating, but Oddity Tech has more frequent overweight and market outperform grades, suggesting stronger analyst conviction. This difference may influence investors seeking more aggressive growth potential.
Strengths and Weaknesses
Below is a comparison of key strengths and weaknesses for Cloudflare, Inc. (NET) and Oddity Tech Ltd. (ODD) based on the most recent financial and operational data available.
| Criterion | Cloudflare, Inc. (NET) | Oddity Tech Ltd. (ODD) |
|---|---|---|
| Diversification | Moderate, primarily in internet security and CDN services with $1.67B revenue (2024) | Limited public data; likely focused on core tech segments |
| Profitability | Negative net margin (-4.72%) and ROIC (-6.06%), value destroying but improving ROIC trend | Strong profitability with 15.69% net margin, 28.56% ROIC, value creating |
| Innovation | Growing ROIC trend suggests improving operational efficiency and innovation efforts | Very favorable moat status indicates durable competitive advantage and innovation |
| Global presence | Significant global footprint as a major cloud services provider | Likely international but less documented than NET |
| Market Share | Large presence in cloud and internet security markets but facing profitability challenges | Smaller but growing market share with strong financial health |
Key takeaways: Oddity Tech Ltd. demonstrates a robust financial position with strong profitability and an excellent competitive moat, making it a potentially safer investment. Cloudflare, while showing improving profitability trends, currently struggles with value destruction and financial inefficiencies, requiring cautious evaluation before investment.
Risk Analysis
Below is a comparative table summarizing key risks for Cloudflare, Inc. (NET) and Oddity Tech Ltd. (ODD) based on their latest 2024 financial and market data:
| Metric | Cloudflare, Inc. (NET) | Oddity Tech Ltd. (ODD) |
|---|---|---|
| Market Risk | High beta at 1.97, volatile price range (89.42-260) | Very high beta at 3.18, volatile price range (33.06-79.18) |
| Debt level | Moderate debt to assets 44.3%, Debt/Equity 1.4 (unfavorable) | Low debt to assets 5.17%, Debt/Equity 0.08 (favorable) |
| Regulatory Risk | US tech sector, moderate regulatory scrutiny | Israeli consumer tech, potential foreign regulatory hurdles |
| Operational Risk | Negative net margin (-4.7%) and returns (ROE -7.5%) | Strong profitability, net margin 15.7%, ROE 36% |
| Environmental Risk | Moderate; cloud infrastructure has energy demands | Lower direct environmental impact, consumer product focus |
| Geopolitical Risk | US-based, relatively stable | Based in Israel, exposed to Middle East geopolitical risks |
The most likely and impactful risks for Cloudflare are its high market volatility and operational challenges marked by consistent losses and elevated debt burden, raising financial stability concerns. Oddity Tech shows strong financial health but faces significant market risk due to extreme price swings and geopolitical exposure given its location. Investors should weigh Cloudflare’s financial weakness against Oddity’s geopolitical risk when managing portfolio risk.
Which Stock to Choose?
Cloudflare, Inc. (NET) shows strong revenue growth of 287% from 2020 to 2024, but struggles with profitability, posting negative returns on equity (-7.53%) and assets (-2.39%). Its debt level is relatively high with a debt-to-equity ratio of 1.4, and financial ratios overall are unfavorable despite a solid current ratio of 2.86. The rating is very unfavorable with a D+ grade.
Oddity Tech Ltd. (ODD) demonstrates robust profitability with a 15.69% net margin and 35.95% return on equity. The company maintains low debt (debt-to-equity 0.08) and favorable financial ratios, although weighted average cost of capital is somewhat high at 18.68%. The rating is very favorable at B+, reflecting a healthier financial profile.
For investors prioritizing value creation and financial stability, Oddity’s very favorable rating and positive income statement might suggest it is more suitable. Conversely, those focused on growth could find Cloudflare’s strong revenue expansion and improving profitability indicators of potential, despite its current challenges.
Disclaimer: Investment carries a risk of loss of initial capital. The past performance is not a reliable indicator of future results. Be sure to understand risks before making an investment decision.
Go Further
I encourage you to read the complete analyses of Cloudflare, Inc. and Oddity Tech Ltd. to enhance your investment decisions: