In the dynamic world of software infrastructure, Cloudflare, Inc. (NET) and Nutanix, Inc. (NTNX) stand out as key players offering innovative cloud solutions. Both companies serve a broad range of industries with cutting-edge technology, but they differ in focus and market approach. This comparison will help investors understand which company presents a more compelling opportunity for their portfolio in 2026. Let’s dive into their strengths and potential.

Table of contents
Companies Overview
I will begin the comparison between Cloudflare and Nutanix by providing an overview of these two companies and their main differences.
Cloudflare Overview
Cloudflare, Inc. is a cloud services provider focused on delivering integrated security, performance, and reliability solutions across various platforms including public and private clouds, on-premises, SaaS applications, and IoT devices. Headquartered in San Francisco, it serves diverse industries such as technology, healthcare, and financial services. Founded in 2009, Cloudflare operates with a market cap of $64.5B and employs approximately 4,400 people.
Nutanix Overview
Nutanix, Inc. offers an enterprise cloud platform emphasizing virtualization, storage, networking, and cloud-native management solutions. The company provides a wide array of products including hypervisors, Kubernetes management, hybrid cloud orchestration, and desktop-as-a-service. Based in San Jose and incorporated in 2009, Nutanix has a market cap of $12.4B and employs roughly 7,150 people, serving global markets across multiple sectors.
Key similarities and differences
Both Cloudflare and Nutanix operate in the software infrastructure industry, delivering cloud-based solutions to enterprises worldwide. While Cloudflare focuses on security, performance, and reliability services across diverse platforms, Nutanix prioritizes virtualization, hybrid cloud management, and application lifecycle automation. Cloudflare’s market capitalization and beta are significantly higher, reflecting differing market perceptions and risk profiles between the two companies.
Income Statement Comparison
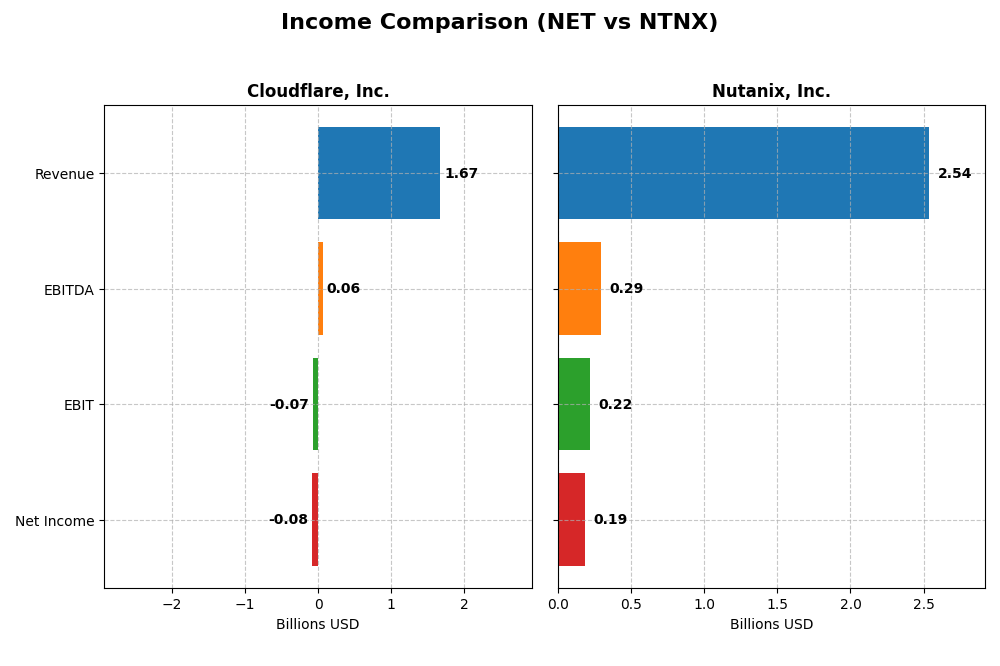
The table below presents a side-by-side comparison of key income statement metrics for Cloudflare, Inc. and Nutanix, Inc. for their most recent fiscal years.
| Metric | Cloudflare, Inc. (NET) | Nutanix, Inc. (NTNX) |
|---|---|---|
| Market Cap | 64.5B | 12.4B |
| Revenue | 1.67B | 2.54B |
| EBITDA | 62M | 293M |
| EBIT | -66M | 220M |
| Net Income | -79M | 188M |
| EPS | -0.23 | 0.70 |
| Fiscal Year | 2024 | 2025 |
Income Statement Interpretations
Cloudflare, Inc.
Cloudflare’s revenue rose significantly from $431M in 2020 to $1.67B in 2024, marking a 287% growth over five years. Despite strong gross margins at 77.3%, the company reported consistent net losses, though the net margin improved to -4.7% in 2024. The latest year showed improved profitability metrics, including a 28.8% revenue increase and a 66.7% net margin growth, indicating operational progress.
Nutanix, Inc.
Nutanix’s revenue increased steadily from $1.39B in 2021 to $2.54B in 2025, reflecting an 82% growth over the period. The company maintained excellent gross margins near 86.8%, with a positive net margin of 7.4% in 2025, a notable turnaround from prior losses. The most recent year exhibited strong earnings growth, with net income surging 227.8% and EBIT margin reaching 8.7%, signaling improved operational efficiency.
Which one has the stronger fundamentals?
Nutanix displays stronger fundamentals with sustained profitability, positive net margins, and higher gross margins compared to Cloudflare, which, despite rapid revenue growth, remains unprofitable. Nutanix’s consistent margin expansion and net income growth contrast with Cloudflare’s ongoing losses, although Cloudflare shows promising improvement trends. Both companies demonstrate favorable revenue growth, but Nutanix leads in profitability metrics.
Financial Ratios Comparison
This table summarizes the most recent financial ratios for Cloudflare, Inc. (NET) and Nutanix, Inc. (NTNX) as of their latest fiscal years, providing a side-by-side view of key performance, liquidity, leverage, and valuation metrics.
| Ratios | Cloudflare, Inc. (2024) | Nutanix, Inc. (2025) |
|---|---|---|
| ROE | -7.53% | -27.12% |
| ROIC | -6.06% | 8.11% |
| P/E | -466.5 | 106.7 |
| P/B | 35.14 | -28.95 |
| Current Ratio | 2.86 | 1.72 |
| Quick Ratio | 2.86 | 1.72 |
| D/E | 1.40 | -2.14 |
| Debt-to-Assets | 44.32% | 45.16% |
| Interest Coverage | -29.78 | 8.75 |
| Asset Turnover | 0.51 | 0.77 |
| Fixed Asset Turnover | 2.63 | 9.15 |
| Payout ratio | 0 | 0 |
| Dividend yield | 0 | 0 |
Interpretation of the Ratios
Cloudflare, Inc.
Cloudflare’s ratios show significant weaknesses with negative net margin (-4.72%) and return on equity (-7.53%), indicating profitability struggles. The company maintains a strong liquidity position with a current ratio of 2.86 but faces unfavorable leverage and interest coverage ratios. Cloudflare does not pay dividends, likely reflecting reinvestment priorities or ongoing growth challenges.
Nutanix, Inc.
Nutanix displays a mixed ratio profile, with a positive net margin of 7.42% and favorable weighted average cost of capital (5.89%), but suffers from a deeply negative return on equity (-27.12%). Liquidity ratios are solid with a current ratio of 1.72, and the company also does not pay dividends, suggesting focus on growth and reinvestment over shareholder payouts.
Which one has the best ratios?
Nutanix demonstrates a more balanced financial profile with half of its ratios favorable and a slightly favorable overall rating, while Cloudflare exhibits predominantly unfavorable ratios and a weaker profitability outlook. Nutanix’s stronger liquidity and interest coverage further support its comparative advantage in ratio analysis.
Strategic Positioning
This section compares the strategic positioning of Cloudflare, Inc. and Nutanix, Inc. in terms of market position, key segments, and exposure to technological disruption:
Cloudflare, Inc.
- Large market cap of 64.5B in cloud services facing high competition in software infrastructure.
- Focuses on integrated cloud-based security, performance, and reliability solutions across multiple platforms globally.
- Exposure to disruption via evolving cloud security and performance technologies, addressing diverse platforms and IoT.
Nutanix, Inc.
- Smaller market cap of 12.4B in enterprise cloud platform with moderate competitive pressure.
- Offers enterprise cloud platform with virtualization, storage, automation, and hybrid cloud orchestration services worldwide.
- Faces disruption from advances in virtualization, Kubernetes automation, and hybrid cloud management technologies.
Cloudflare, Inc. vs Nutanix, Inc. Positioning
Cloudflare’s approach is concentrated on integrated cloud security and performance, serving multiple industries globally, while Nutanix adopts a diversified enterprise cloud platform strategy with broad virtualization and automation offerings across many sectors. Cloudflare’s larger scale contrasts with Nutanix’s wider service variety.
Which has the best competitive advantage?
Nutanix demonstrates a very favorable moat with growing ROIC exceeding WACC, indicating durable competitive advantage and efficient capital use. Cloudflare has a slightly unfavorable moat, shedding value despite improving profitability, signaling weaker competitive sustainability.
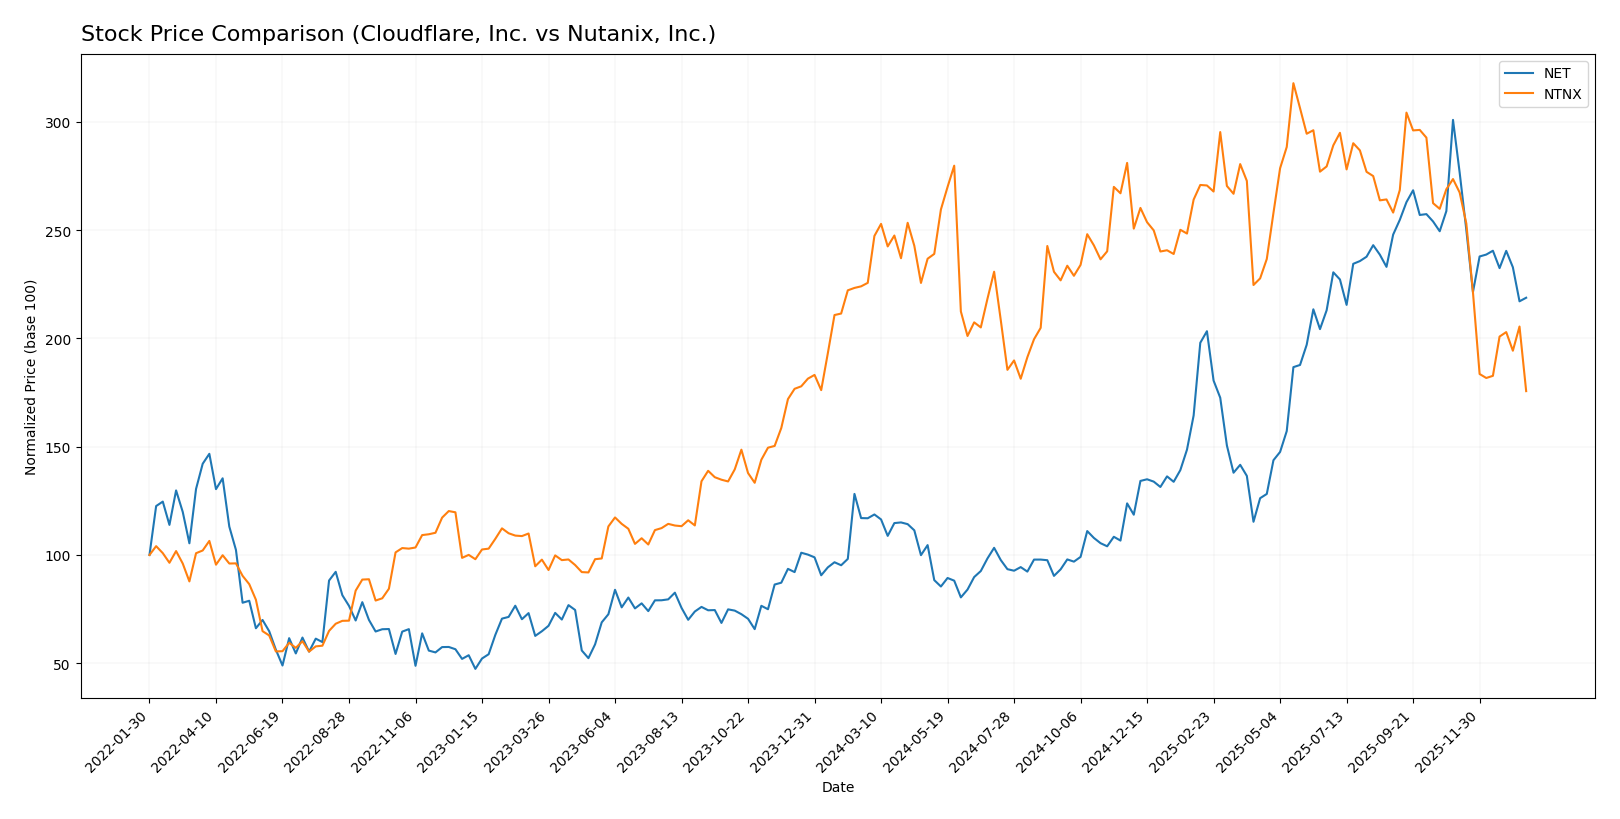
Stock Comparison
The stock price movements of Cloudflare, Inc. (NET) and Nutanix, Inc. (NTNX) over the past year show contrasting dynamics, with NET exhibiting a strong overall upward trend despite recent weakness, while NTNX has faced sustained declines with increasing seller pressure.
Trend Analysis
Cloudflare, Inc. (NET) demonstrated a bullish trend over the past 12 months with an 87.07% price increase, though recent months show a decelerating downtrend with a -27.29% drop and higher volatility indicated by a 52.73 standard deviation. Nutanix, Inc. (NTNX) experienced a bearish trend with a -22.16% price change over 12 months, continuing with a recent accelerated decline of -35.79% and lower volatility at 8.67 standard deviation. Comparing both, Cloudflare, Inc. (NET) delivered the highest market performance, outperforming Nutanix, Inc. (NTNX) significantly despite recent price corrections.
Target Prices
The current analyst consensus presents a positive outlook with varied target ranges for Cloudflare, Inc. and Nutanix, Inc.
| Company | Target High | Target Low | Consensus |
|---|---|---|---|
| Cloudflare, Inc. | 300 | 210 | 248.86 |
| Nutanix, Inc. | 90 | 53 | 64.67 |
Analysts expect Cloudflare’s stock price to rise significantly above its current 184.17 USD, while Nutanix shows moderate upside potential from its present 45.74 USD.
Analyst Opinions Comparison
This section compares analysts’ ratings and grades for Cloudflare, Inc. and Nutanix, Inc.:
Rating Comparison
Cloudflare, Inc. Rating
- Rating: D+ with a very favorable evaluation
- Discounted Cash Flow Score: 1, very unfavorable
- ROE Score: 1, very unfavorable
- ROA Score: 1, very unfavorable
- Debt To Equity Score: 1, very unfavorable
- Overall Score: 1, very unfavorable
Nutanix, Inc. Rating
- Rating: C+ with a very favorable evaluation
- Discounted Cash Flow Score: 4, favorable
- ROE Score: 1, very unfavorable
- ROA Score: 4, favorable
- Debt To Equity Score: 1, very unfavorable
- Overall Score: 2, moderate
Which one is the best rated?
Based strictly on the provided data, Nutanix has a higher overall score (2 vs 1) and better discounted cash flow and ROA scores compared to Cloudflare, indicating a comparatively stronger rating.
Scores Comparison
Here is a comparison of the Altman Z-Score and Piotroski Score for Cloudflare, Inc. and Nutanix, Inc.:
Cloudflare, Inc. Scores
- Altman Z-Score: 9.47, indicating a safe zone.
- Piotroski Score: 2, categorized as very weak.
Nutanix, Inc. Scores
- Altman Z-Score: 1.48, indicating distress zone.
- Piotroski Score: 6, categorized as average.
Which company has the best scores?
Cloudflare, Inc. has a much higher Altman Z-Score, placing it in the safe zone, while Nutanix, Inc. falls in the distress zone. However, Nutanix has a stronger Piotroski Score, rated average versus Cloudflare’s very weak rating.
Grades Comparison
The following is a comparison of recent grades provided by reputable financial institutions for Cloudflare, Inc. and Nutanix, Inc.:
Cloudflare, Inc. Grades
This table summarizes recent grades and actions from major financial firms for Cloudflare, Inc.:
| Grading Company | Action | New Grade | Date |
|---|---|---|---|
| Citigroup | Maintain | Buy | 2026-01-16 |
| UBS | Maintain | Neutral | 2026-01-13 |
| Piper Sandler | Maintain | Neutral | 2026-01-05 |
| Argus Research | Maintain | Buy | 2025-11-10 |
| Susquehanna | Maintain | Neutral | 2025-11-03 |
| Citigroup | Maintain | Buy | 2025-11-03 |
| Cantor Fitzgerald | Maintain | Neutral | 2025-10-31 |
| Stifel | Maintain | Buy | 2025-10-31 |
| UBS | Maintain | Neutral | 2025-10-31 |
| Keybanc | Maintain | Overweight | 2025-10-31 |
Cloudflare’s grades predominantly reflect a Buy or Neutral consensus, showing steady confidence with no recent downgrades.
Nutanix, Inc. Grades
This table summarizes recent grades and actions from major financial firms for Nutanix, Inc.:
| Grading Company | Action | New Grade | Date |
|---|---|---|---|
| Barclays | Downgrade | Equal Weight | 2026-01-15 |
| Morgan Stanley | Downgrade | Equal Weight | 2026-01-12 |
| RBC Capital | Maintain | Outperform | 2026-01-05 |
| Goldman Sachs | Maintain | Buy | 2025-11-28 |
| JP Morgan | Maintain | Overweight | 2025-11-26 |
| Needham | Maintain | Buy | 2025-11-26 |
| Wells Fargo | Maintain | Equal Weight | 2025-11-26 |
| Morgan Stanley | Maintain | Overweight | 2025-11-26 |
| Keybanc | Maintain | Overweight | 2025-11-26 |
| Piper Sandler | Maintain | Overweight | 2025-11-26 |
Nutanix displays a range of ratings mostly between Buy, Overweight, and Equal Weight, but with recent downgrades by Barclays and Morgan Stanley.
Which company has the best grades?
Cloudflare, Inc. has received a more consistent Buy and Neutral grade profile, whereas Nutanix, Inc. shows a mixed pattern including recent downgrades to Equal Weight. Investors might interpret Cloudflare’s steadier grades as a sign of stable analyst confidence compared to Nutanix’s more varied outlook.
Strengths and Weaknesses
Below is a comparison of Cloudflare, Inc. (NET) and Nutanix, Inc. (NTNX) based on key criteria reflecting their current market and financial status.
| Criterion | Cloudflare, Inc. (NET) | Nutanix, Inc. (NTNX) |
|---|---|---|
| Diversification | Focused on cloud security and CDN; limited product range with $1.67B revenue in 2024 | Broad portfolio: subscription, professional services, and non-subscription products; $2.05B revenue in 2024 |
| Profitability | Negative net margin (-4.72%) and ROIC (-6.06%); currently shedding value | Positive net margin (7.42%) and ROIC (8.11%); creating value with strong profitability growth |
| Innovation | Growing ROIC trend but overall value destruction; strong R&D focus | Very favorable ROIC trend (117% growth); durable competitive advantage through innovation |
| Global presence | Strong global CDN network with wide reach | Global cloud software presence but less expansive than NET’s CDN |
| Market Share | Leading player in cloud security and performance | Growing share in hybrid cloud and enterprise software markets |
The key takeaway is that Nutanix shows a more favorable financial and value creation profile with diversified revenue streams and strong profitability trends. Cloudflare, despite its innovation and global network, currently struggles with profitability and value destruction but demonstrates improving ROIC. Investors should weigh growth potential against current financial health carefully.
Risk Analysis
Below is a comparative risk table for Cloudflare, Inc. (NET) and Nutanix, Inc. (NTNX) based on the most recent available data:
| Metric | Cloudflare, Inc. (NET) | Nutanix, Inc. (NTNX) |
|---|---|---|
| Market Risk | High beta (1.97) indicates elevated volatility and sensitivity to market swings. | Low beta (0.49) suggests lower volatility and market risk. |
| Debt level | Debt-to-equity ratio of 1.4, signaling moderate to high leverage. | Negative debt-to-equity ratio (-2.14) reflecting favorable leverage conditions. |
| Regulatory Risk | Moderate, given global cloud security operations and compliance demands. | Moderate, with multinational operations in cloud infrastructure. |
| Operational Risk | Exposure to cybersecurity threats and cloud infrastructure reliability. | Risks tied to cloud platform integration and service delivery. |
| Environmental Risk | Limited direct environmental impact but dependent on energy-intensive data centers. | Similar data center-related environmental considerations. |
| Geopolitical Risk | Global presence exposes to geopolitical tensions impacting cloud services. | Also exposed globally, with risks in supply chain and data sovereignty. |
The most significant risks for Cloudflare center on its high market volatility and unfavorable leverage, which may impact financial stability despite a strong Altman Z-Score indicating low bankruptcy risk. Nutanix, while showing better debt management and lower market risk, faces distress-level bankruptcy risk per Altman Z-Score and operational challenges in integrating complex cloud services. Investors should weigh Cloudflare’s market sensitivity against Nutanix’s financial distress signs when managing portfolio risk.
Which Stock to Choose?
Cloudflare, Inc. (NET) shows strong income growth with a 287% revenue increase from 2020 to 2024, though profitability ratios remain unfavorable, including negative ROE and ROIC. The company carries moderate debt, a solid current ratio of 2.86, but its overall rating is very unfavorable despite a favorable income statement.
Nutanix, Inc. (NTNX) reports favorable income growth and profitability metrics with a positive net margin and ROIC above WACC, indicating value creation. The company maintains moderate debt levels, a current ratio of 1.72, and a slightly favorable global financial ratios evaluation, supported by a moderate overall rating.
Investors seeking growth with improving profitability might see Nutanix’s favorable ROIC and income trends as attractive, while those valuing Cloudflare’s robust revenue expansion but cautious about its financial health could interpret the contrasting ratings and debt metrics accordingly.
Disclaimer: Investment carries a risk of loss of initial capital. The past performance is not a reliable indicator of future results. Be sure to understand risks before making an investment decision.
Go Further
I encourage you to read the complete analyses of Cloudflare, Inc. and Nutanix, Inc. to enhance your investment decisions: