Home > Comparison > Technology > NET vs FTNT
The strategic rivalry between Cloudflare, Inc. and Fortinet, Inc. shapes the cybersecurity and infrastructure software landscape. Cloudflare operates a cloud-based, integrated security and performance platform, while Fortinet focuses on broad, hardware-driven cybersecurity solutions. This head-to-head reflects a clash between innovative cloud integration and established network protection. This analysis aims to identify which company presents a superior risk-adjusted opportunity for a diversified portfolio in the evolving tech sector.

Table of contents
Companies Overview
Cloudflare, Inc. and Fortinet, Inc. are key players in the software infrastructure market, shaping cybersecurity and cloud services globally.
Cloudflare, Inc.: Integrated Cloud Security Leader
Cloudflare dominates as a cloud services provider specializing in integrated cloud-based security solutions. It generates revenue by protecting platforms like public and private clouds, SaaS, and IoT devices with products such as cloud firewalls and DDoS mitigation. In 2026, its strategic focus remains on expanding performance and reliability solutions, including intelligent routing and serverless computing.
Fortinet, Inc.: Comprehensive Cybersecurity Innovator
Fortinet stands out as a cybersecurity powerhouse delivering broad, integrated security hardware and software. Its revenue engine centers on FortiGate firewalls and a suite of secure networking products, including endpoint protection and multi-factor authentication. The company’s 2026 strategy emphasizes automated security solutions and scaling its management systems to support diverse industries worldwide.
Strategic Collision: Similarities & Divergences
Both companies target enterprise cybersecurity but diverge in approach: Cloudflare favors a cloud-native, software-centric ecosystem, while Fortinet integrates hardware and software tightly. Their primary battleground is network security for complex IT environments. Cloudflare appeals to users seeking flexible cloud performance, whereas Fortinet attracts those demanding comprehensive, hardware-accelerated security stacks. Their investment profiles reflect this strategic duality in scale and specialization.
Income Statement Comparison
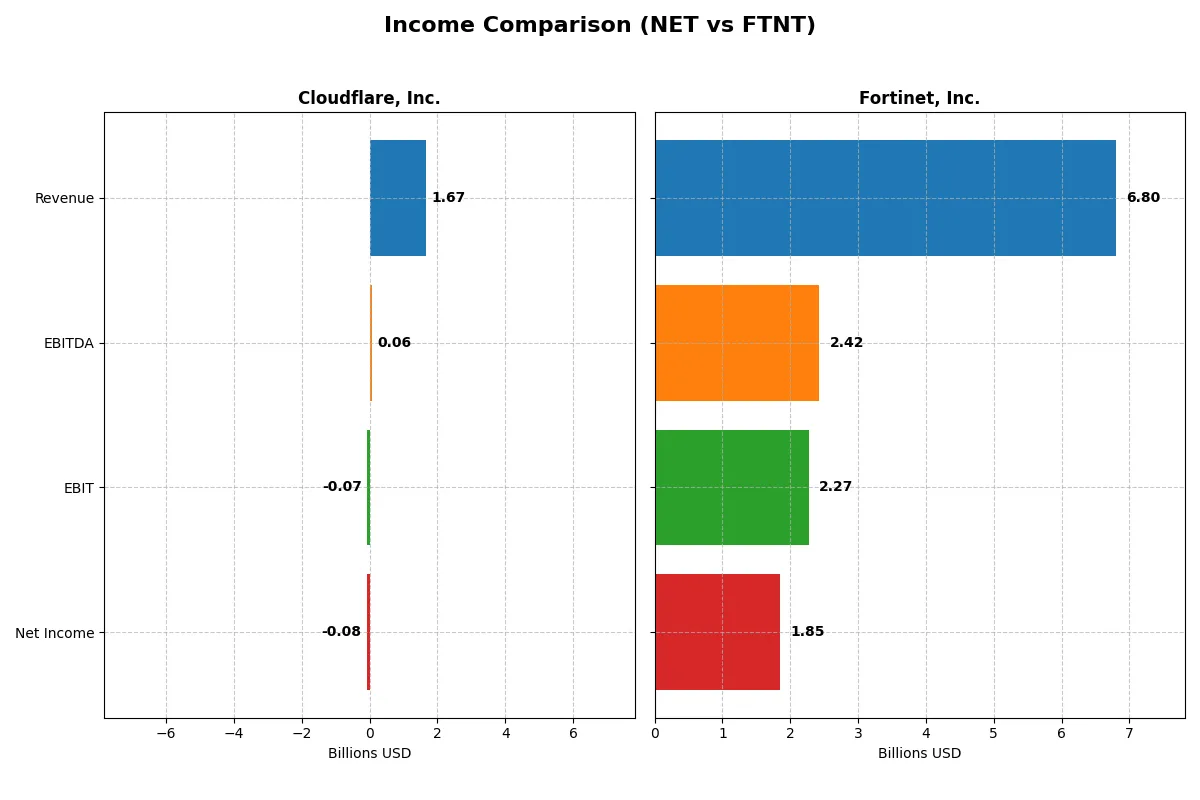
The following data dissects the core profitability and scalability of both corporate engines to reveal who dominates the bottom line:
| Metric | Cloudflare, Inc. (NET) | Fortinet, Inc. (FTNT) |
|---|---|---|
| Revenue | 1.67B | 6.80B |
| Cost of Revenue | 379M | 1.30B |
| Operating Expenses | 1.45B | 3.42B |
| Gross Profit | 1.29B | 5.50B |
| EBITDA | 62M | 2.42B |
| EBIT | -66M | 2.27B |
| Interest Expense | 5.2M | 20.1M |
| Net Income | -79M | 1.85B |
| EPS | -0.23 | 2.44 |
| Fiscal Year | 2024 | 2025 |
Income Statement Analysis: The Bottom-Line Duel
This income statement comparison reveals which company runs a more efficient and profitable business engine, highlighting their core financial strengths.
Cloudflare, Inc. Analysis
Cloudflare’s revenue surged from 431M in 2020 to 1.67B in 2024, reflecting strong top-line growth. Despite a robust 77% gross margin, the company posted net losses each year, narrowing its net loss to -78M in 2024. Operating expenses grew but maintained pace with revenue, showing improving operational efficiency and momentum toward profitability.
Fortinet, Inc. Analysis
Fortinet’s revenue climbed steadily from 3.34B in 2021 to nearly 6.8B in 2025, with a consistently high gross margin above 80%. The firm sustained strong profitability, posting a 27% net margin and 2.4B net income in 2025. Fortinet’s disciplined cost control and stable EBIT margins around 33% demonstrate a mature, highly profitable business model with solid growth momentum.
Margin Power vs. Revenue Scale
Fortinet clearly leads with superior profitability and margin efficiency, delivering strong net income and consistent EBIT margins. Cloudflare impresses with rapid revenue growth and improving margins but remains unprofitable at the net income level. Investors focused on earnings strength may favor Fortinet, while those prioritizing growth might watch Cloudflare’s potential trajectory.
Financial Ratios Comparison
These vital ratios act as a diagnostic tool to expose the underlying fiscal health, valuation premiums, and capital efficiency of the companies compared below:
| Ratios | Cloudflare, Inc. (NET) | Fortinet, Inc. (FTNT) |
|---|---|---|
| ROE | -7.53% | 149.77% |
| ROIC | -6.06% | 28.76% |
| P/E | -466.54 | 32.48 |
| P/B | 35.14 | 48.64 |
| Current Ratio | 2.86 | 1.17 |
| Quick Ratio | 2.86 | 1.09 |
| D/E | 1.40 | 0.81 |
| Debt-to-Assets | 44.32% | 9.59% |
| Interest Coverage | -29.78 | 103.72 |
| Asset Turnover | 0.51 | 0.65 |
| Fixed Asset Turnover | 2.63 | 4.20 |
| Payout ratio | 0 | 0 |
| Dividend yield | 0 | 0 |
| Fiscal Year | 2024 | 2025 |
Efficiency & Valuation Duel: The Vital Signs
Financial ratios serve as a company’s DNA, unveiling hidden risks and operational strengths vital to investor insight.
Cloudflare, Inc.
Cloudflare displays unfavorable profitability with negative ROE (-7.53%) and net margin (-4.72%). Its valuation appears stretched, featuring a negative P/E yet a high P/B of 35.14. The firm retains earnings for R&D, allocating 25.2% of revenue to innovation, reflecting a growth-focused reinvestment rather than shareholder payouts.
Fortinet, Inc.
Fortinet commands strong profitability with a robust ROE of 149.77% and healthy net margin of 27.26%. Its valuation is expensive, marked by a P/E of 32.48 and elevated P/B at 48.64. Despite zero dividend yield, Fortinet generates ample free cash flow, signaling capacity for future buybacks or reinvestment to sustain growth.
Profitability Strength vs. Growth Reinvestment
Fortinet offers superior profitability and operational efficiency, balancing risk with a premium valuation. Cloudflare’s negative returns and heavy R&D spending suggest greater risk but potential for long-term innovation-led growth. Investors seeking stability lean toward Fortinet; those favoring aggressive expansion may consider Cloudflare’s profile.
Which one offers the Superior Shareholder Reward?
Cloudflare (NET) pays no dividends and generates negative net income, with a high debt load and no share buybacks. Fortinet (FTNT) also pays no dividends but delivers strong net margins (~27%) and robust free cash flow (~2.9/share in 2025), supported by active buybacks that amplify total returns. I view Fortinet’s capital allocation—focused on buybacks and profitable growth—as a more sustainable and rewarding model for long-term investors in 2026. Fortinet clearly offers the superior total shareholder reward.
Comparative Score Analysis: The Strategic Profile
The radar chart reveals the fundamental DNA and trade-offs of Cloudflare, Inc. and Fortinet, Inc., highlighting their core financial strengths and weaknesses:
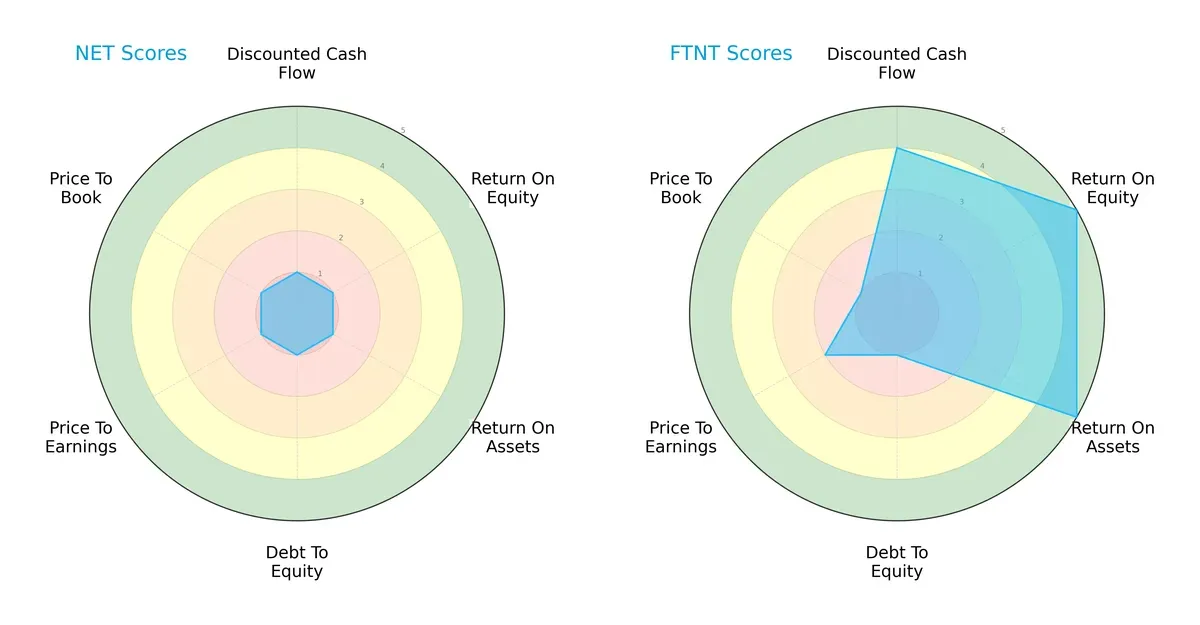
Fortinet exhibits a more balanced financial profile with strong returns on equity (5) and assets (5), and a favorable discounted cash flow score (4). Cloudflare scores uniformly low (1) across all metrics, indicating broad challenges. Fortinet’s moderate overall score (3) contrasts with Cloudflare’s very unfavorable (1), showing Fortinet relies on operational efficiency while Cloudflare lacks a clear edge.
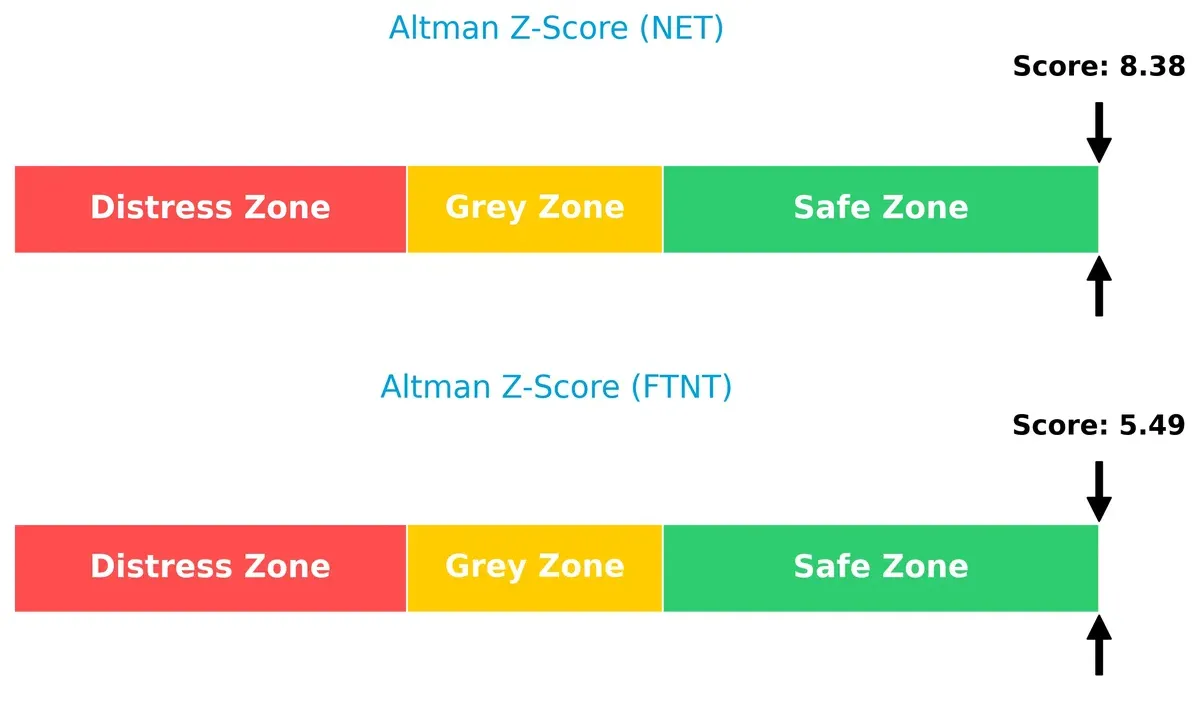
Bankruptcy Risk: Solvency Showdown
Fortinet’s Altman Z-Score (5.49) and Cloudflare’s (8.38) both place them safely above distress thresholds, signaling strong long-term survival prospects in this cycle:
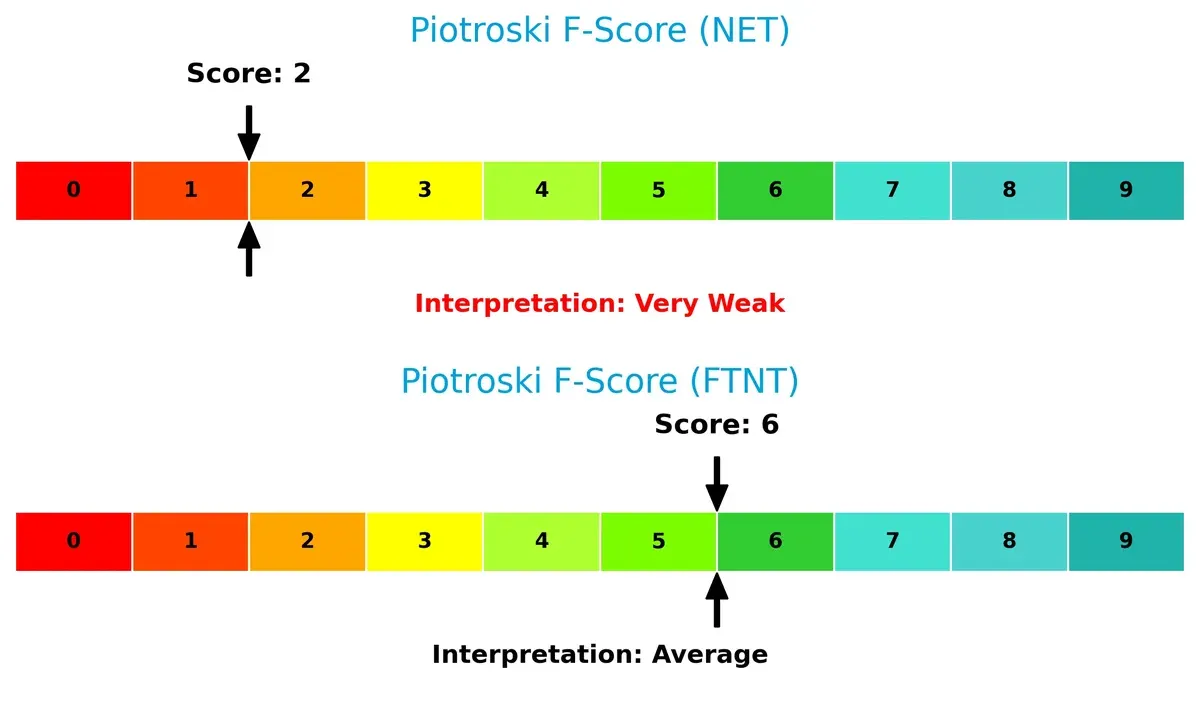
Financial Health: Quality of Operations
Fortinet’s Piotroski F-Score of 6 indicates healthy financial operations, while Cloudflare’s 2 raises red flags about internal weaknesses and potential risks:
How are the two companies positioned?
This section dissects Cloudflare and Fortinet’s operational DNA by comparing revenue distribution and internal strengths and weaknesses. The goal is to confront their economic moats and identify which model offers the most resilient, sustainable competitive advantage today.
Revenue Segmentation: The Strategic Mix
The following visual comparison dissects how Cloudflare, Inc. and Fortinet, Inc. diversify their income streams and where their primary sector bets lie:
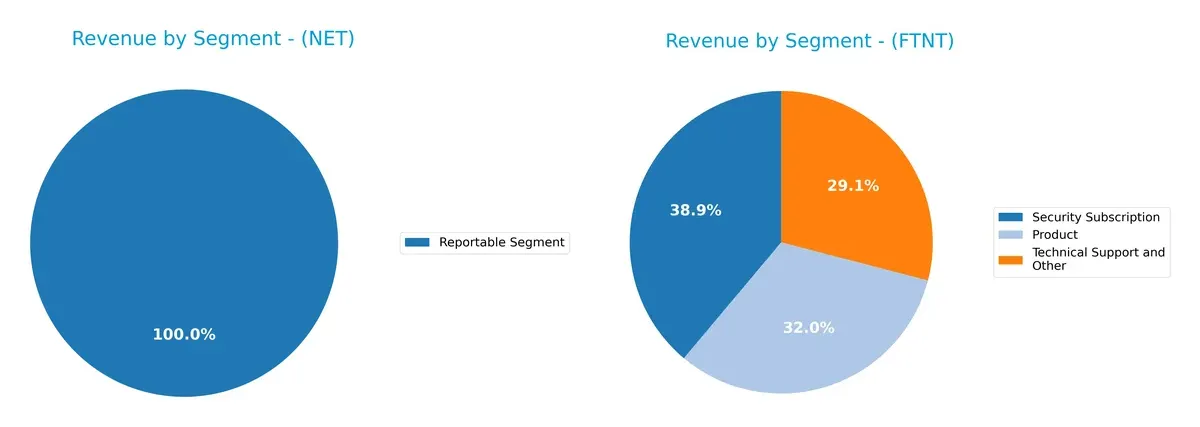
Cloudflare reports a single segment totaling $1.67B, indicating a concentrated revenue base. Fortinet diversifies across three segments: Security Subscription at $2.32B, Product at $1.91B, and Technical Support at $1.73B. Fortinet’s mix dwarfs Cloudflare’s by spreading risk across multiple offerings, anchoring its ecosystem lock-in. Cloudflare’s reliance on one segment suggests higher concentration risk, but potentially sharper strategic focus.
Strengths and Weaknesses Comparison
This table compares the strengths and weaknesses of Cloudflare, Inc. and Fortinet, Inc.:
Cloudflare, Inc. Strengths
- Strong current and quick ratios at 2.86 each
- Neutral asset and fixed asset turnover ratios
- Global presence with diversified revenue from US, EMEA, Asia Pacific
Fortinet, Inc. Strengths
- High profitability with 27.26% net margin and 149.77% ROE
- Favorable debt-to-assets ratio at 9.59%
- Strong interest coverage at 113
- Diversified revenue streams across Product, Security Subscription, and Technical Support
Cloudflare, Inc. Weaknesses
- Negative profitability metrics: net margin -4.72%, ROE -7.53%, ROIC -6.06%
- High WACC at 12.87%
- High debt-to-equity at 1.4 and unfavorable interest coverage
- Elevated PB ratio at 35.14
Fortinet, Inc. Weaknesses
- Elevated PB ratio at 48.64 and unfavorable PE of 32.48
- Moderate current ratio at 1.17 and debt-to-equity at 0.81
- Dividend yield is zero for both companies
Both companies show global operations but differ in profitability and financial health. Cloudflare struggles with losses and leverage, while Fortinet demonstrates strong profitability and lower leverage, impacting their strategic financial positioning.
The Moat Duel: Analyzing Competitive Defensibility
A structural moat is the only true barrier protecting long-term profits from relentless competitive erosion in dynamic markets:
Cloudflare, Inc.: Network Effects and Platform Integration
Cloudflare leverages powerful network effects and platform integration, reflected in rapid revenue growth but still negative net margins. Its rising ROIC hints at improving profitability, yet value destruction persists. Expansion into edge computing and IoT security in 2026 could deepen its moat or intensify capital demands.
Fortinet, Inc.: Cost Advantage and Integrated Security Ecosystem
Fortinet’s moat stems from a cost-efficient, integrated cybersecurity ecosystem, surpassing Cloudflare with a very favorable ROIC-WACC spread. Its consistent EBIT margin above 30% proves strong capital allocation. Continued product innovation and global expansion in 2026 solidify its competitive edge.
Moat Strength Face-off: Network Effects vs. Cost Leadership
Fortinet’s wider moat, evidenced by a 20% ROIC premium over WACC and sustained margin leadership, outmatches Cloudflare’s still-negative value creation despite momentum. Fortinet stands better equipped to defend market share amid intensifying cybersecurity competition.
Which stock offers better returns?
The past 12 months reveal strong price gains for Cloudflare, Inc. and Fortinet, Inc., with distinct dynamics and recent shifts in momentum shaping their trading profiles.
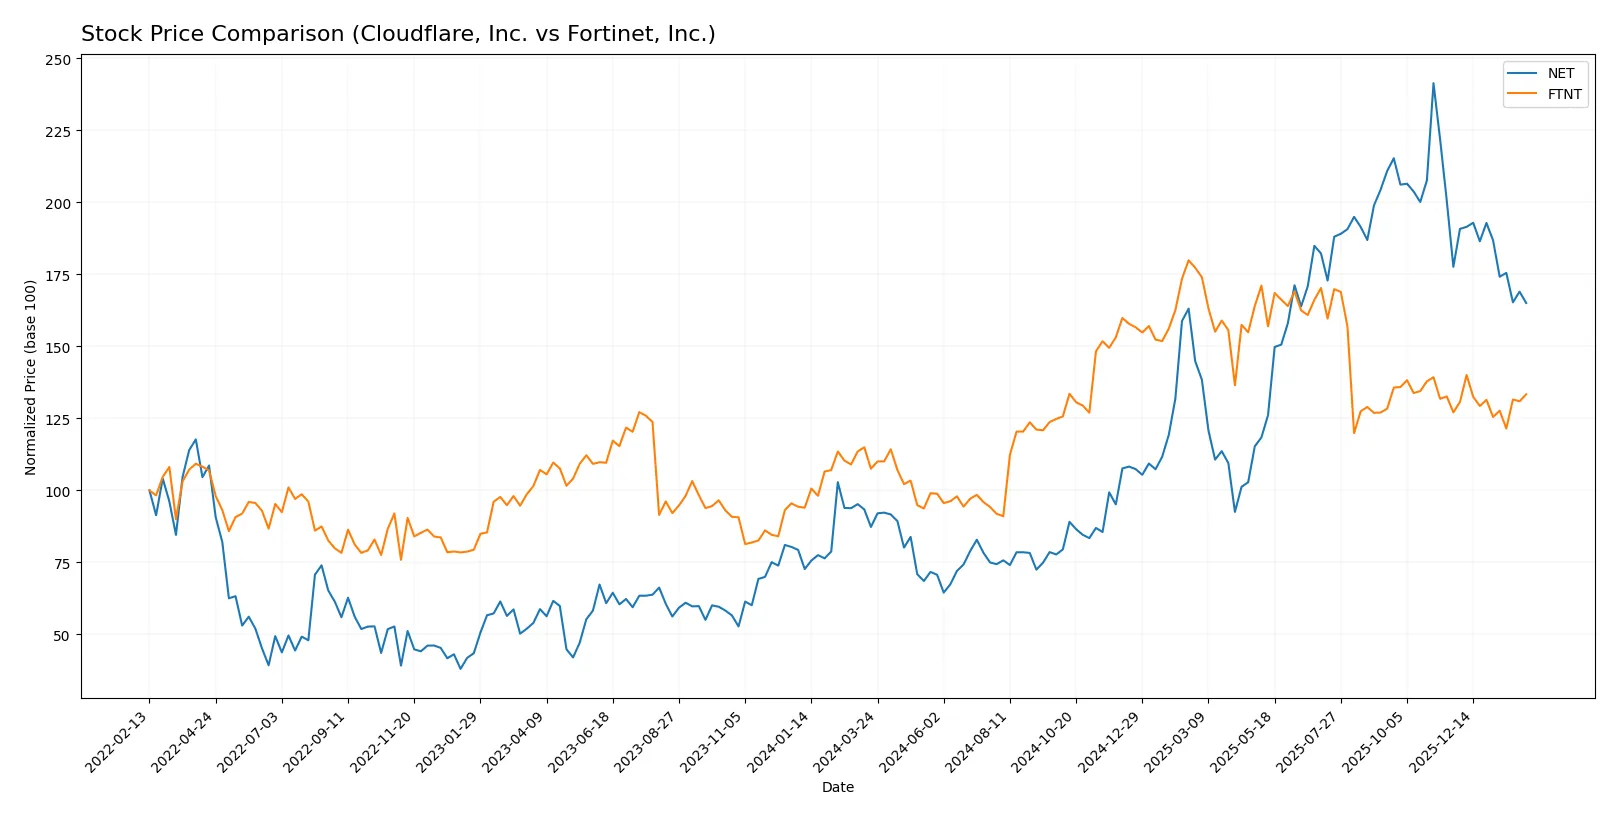
Trend Comparison
Cloudflare, Inc. posted an 89.09% price increase over the past year, signaling a bullish trend with decelerating growth. The stock ranged between 67.69 and 253.3, showing high volatility (52.75 std deviation). Recently, it reversed with a 7.07% decline.
Fortinet, Inc. gained 24.04% over 12 months, also bullish but with deceleration. Its range was 56.51 to 111.64, with moderate volatility (15.07 std deviation). The recent 4.95% rise shows a near-neutral slope (-0.12).
Cloudflare’s returns substantially outpaced Fortinet’s despite recent weakness, delivering the highest market performance over the analyzed period.
Target Prices
Analysts present a bullish consensus for Cloudflare, Inc. and Fortinet, Inc., suggesting meaningful upside from current prices.
| Company | Target Low | Target High | Consensus |
|---|---|---|---|
| Cloudflare, Inc. | 185 | 300 | 242.53 |
| Fortinet, Inc. | 70 | 90 | 85 |
Cloudflare’s consensus target is 40% above its current price of $173.35, signaling strong growth expectations. Fortinet’s target consensus at $85 also exceeds its current $82.76 price, indicating moderate upside potential.

Don’t Let Luck Decide Your Entry Point
Optimize your entry points with our advanced ProRealTime indicators. You’ll get efficient buy signals with precise price targets for maximum performance. Start outperforming now!
How do institutions grade them?
Cloudflare, Inc. Grades
The following table summarizes recent institutional grades for Cloudflare, Inc.:
| Grading Company | Action | New Grade | Date |
|---|---|---|---|
| BTIG | Upgrade | Buy | 2026-02-04 |
| Mizuho | Maintain | Outperform | 2026-01-21 |
| Citigroup | Maintain | Buy | 2026-01-16 |
| UBS | Maintain | Neutral | 2026-01-13 |
| Piper Sandler | Maintain | Neutral | 2026-01-05 |
| Argus Research | Maintain | Buy | 2025-11-10 |
| Susquehanna | Maintain | Neutral | 2025-11-03 |
| Citigroup | Maintain | Buy | 2025-11-03 |
| Needham | Maintain | Buy | 2025-10-31 |
| UBS | Maintain | Neutral | 2025-10-31 |
Fortinet, Inc. Grades
The following table summarizes recent institutional grades for Fortinet, Inc.:
| Grading Company | Action | New Grade | Date |
|---|---|---|---|
| Rosenblatt | Maintain | Buy | 2026-02-06 |
| Mizuho | Maintain | Underperform | 2026-02-06 |
| JP Morgan | Maintain | Underweight | 2026-02-06 |
| RBC Capital | Maintain | Sector Perform | 2026-02-06 |
| Wedbush | Maintain | Outperform | 2026-02-06 |
| Scotiabank | Downgrade | Sector Perform | 2026-02-02 |
| JP Morgan | Maintain | Underweight | 2026-01-30 |
| Rosenblatt | Upgrade | Buy | 2026-01-29 |
| TD Cowen | Upgrade | Buy | 2026-01-23 |
| Citigroup | Maintain | Neutral | 2026-01-13 |
Which company has the best grades?
Cloudflare holds a stronger consensus with multiple Buy and Outperform ratings, including recent upgrades. Fortinet shows mixed ratings with some underperform and underweight grades despite Buy upgrades. This disparity may influence investor confidence and portfolio positioning.
Risks specific to each company
The following categories highlight critical pressure points and systemic threats facing Cloudflare, Inc. and Fortinet, Inc. within the 2026 market environment:
1. Market & Competition
Cloudflare, Inc.
- Faces intense competition in cloud security; negative margins reflect pricing pressure.
Fortinet, Inc.
- Strong market position with broad cybersecurity suite; robust profitability supports competitive moat.
2. Capital Structure & Debt
Cloudflare, Inc.
- Debt-to-equity ratio is high at 1.4, raising financial risk concerns.
Fortinet, Inc.
- Lower debt-to-equity at 0.81, indicating a more conservative and manageable capital structure.
3. Stock Volatility
Cloudflare, Inc.
- Beta near 1.98 signals high stock price volatility relative to the market.
Fortinet, Inc.
- Beta of 1.05 suggests moderate volatility and lower market risk.
4. Regulatory & Legal
Cloudflare, Inc.
- Operates globally with exposure to evolving cloud privacy and security regulations.
Fortinet, Inc.
- Broad international presence increases regulatory complexity but benefits from established compliance systems.
5. Supply Chain & Operations
Cloudflare, Inc.
- Relies heavily on cloud infrastructure; potential exposure to data center disruptions.
Fortinet, Inc.
- Diversified hardware and software supply chains mitigate operational risks.
6. ESG & Climate Transition
Cloudflare, Inc.
- Technology sector pressure to improve energy efficiency in data centers is significant.
Fortinet, Inc.
- Larger scale may enable better ESG investments, but footprint remains a challenge.
7. Geopolitical Exposure
Cloudflare, Inc.
- US-based but global customer base exposes it to international trade tensions.
Fortinet, Inc.
- Global footprint is broader, increasing sensitivity to geopolitical shifts, especially in APAC and EMEA.
Which company shows a better risk-adjusted profile?
Fortinet carries the more impactful risk in capital structure due to moderate debt but benefits from superior profitability and stable stock volatility. Cloudflare’s greatest risk lies in its unprofitable operations and high leverage, leading to greater financial fragility. Fortinet’s safer Altman Z-Score and stronger Piotroski score confirm a more balanced risk-adjusted profile in 2026.
Final Verdict: Which stock to choose?
Cloudflare, Inc. (NET) stands out for its rapid revenue growth and strong cash position, signaling a potential cash-generating machine in the making. Yet, its current value destruction and persistent losses remain points of vigilance. It suits aggressive growth portfolios willing to tolerate short-term volatility.
Fortinet, Inc. (FTNT) boasts a solid strategic moat anchored in cybersecurity leadership with consistent value creation and high profitability metrics. Its financial health and stable returns offer better safety relative to Cloudflare. FTNT fits well within GARP portfolios seeking growth balanced with reasonable risk.
If you prioritize rapid growth with an appetite for risk, Cloudflare might be the compelling choice due to its expanding market footprint despite current profitability challenges. However, if you seek superior stability and strong capital efficiency, Fortinet offers a more reliable investment scenario backed by a durable moat and consistent returns.
Disclaimer: Investment carries a risk of loss of initial capital. The past performance is not a reliable indicator of future results. Be sure to understand risks before making an investment decision.
Go Further
I encourage you to read the complete analyses of Cloudflare, Inc. and Fortinet, Inc. to enhance your investment decisions: