Home > Comparison > Technology > NET vs FFIV
The strategic rivalry between Cloudflare, Inc. and F5, Inc. shapes the evolution of the technology sector’s software infrastructure landscape. Cloudflare operates as a cloud-centric, integrated security and performance platform, while F5 delivers multi-cloud application security with a mix of hardware and software solutions. This analysis pits Cloudflare’s innovative agility against F5’s established enterprise foothold to identify which offers superior risk-adjusted returns for a diversified portfolio.

Table of contents
Companies Overview
Cloudflare and F5 stand as major contenders in the software infrastructure market, shaping digital security and performance.
Cloudflare, Inc.: Integrated Cloud Security Leader
Cloudflare dominates as a cloud services provider, generating revenue through its integrated cloud-based security solutions. Its products secure public and private clouds, SaaS, IoT devices, and more. In 2026, Cloudflare strategically focuses on expanding its performance and reliability solutions, including content delivery and intelligent routing, to strengthen its competitive edge in diverse industries.
F5, Inc.: Multi-Cloud Application Security Specialist
F5 leads in multi-cloud application security and delivery, monetizing through hardware and software products that ensure network application performance and availability. Its 2026 strategy emphasizes broadening partnerships with major cloud providers and enhancing its application security suite. F5 targets large enterprises and governments to solidify its market presence across global regions.
Strategic Collision: Similarities & Divergences
Both firms prioritize software infrastructure but diverge in approach: Cloudflare emphasizes a cloud-native integrated platform, while F5 leverages a hybrid model combining hardware and software. Their primary battleground lies in securing complex, multi-cloud environments. Cloudflare appeals to a broad, scalable SaaS model, whereas F5 caters to enterprise-grade, customizable solutions, defining distinct investment profiles in technology infrastructure.
Income Statement Comparison
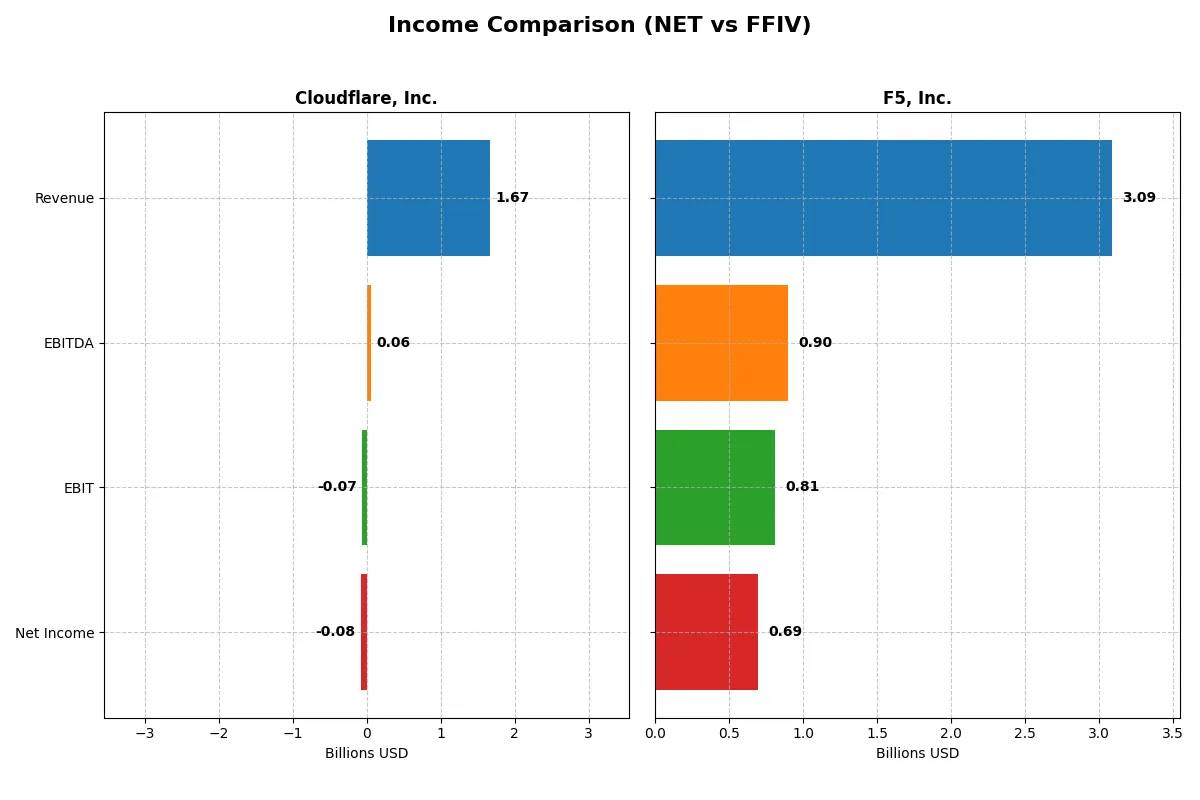
This data dissects the core profitability and scalability of both corporate engines to reveal who dominates the bottom line:
| Metric | Cloudflare, Inc. (NET) | F5, Inc. (FFIV) |
|---|---|---|
| Revenue | 1.67B | 3.09B |
| Cost of Revenue | 379M | 564M |
| Operating Expenses | 1.45B | 1.76B |
| Gross Profit | 1.29B | 2.52B |
| EBITDA | 62M | 901M |
| EBIT | -66M | 808M |
| Interest Expense | 5.2M | 0 |
| Net Income | -79M | 692M |
| EPS | -0.23 | 11.95 |
| Fiscal Year | 2024 | 2025 |
Income Statement Analysis: The Bottom-Line Duel
This income statement comparison reveals which company operates with greater efficiency and delivers stronger profitability in their business model.
Cloudflare, Inc. Analysis
Cloudflare’s revenue surged from 431M in 2020 to 1.67B in 2024, showing robust growth momentum. Despite a favorable gross margin above 77%, Cloudflare struggles with negative net income, narrowing losses to -78M in 2024. Operating expenses scale with revenue, leading to persistent net margin deficits near -4.7%, reflecting ongoing investments and margin pressure.
F5, Inc. Analysis
F5 displays steady revenue growth from 2.6B in 2021 to 3.1B in 2025, with a strong gross margin of 81.7%. The company maintains high profitability, posting net income of 692M in 2025 and a net margin exceeding 22%. EBIT margin at 26.2% signals efficient cost control and capital allocation, sustaining solid earnings momentum despite moderate revenue growth.
Margin Strength vs. Growth Trajectory
F5 clearly outperforms Cloudflare in profitability and margin efficiency, delivering consistent net income and strong returns on revenue. Cloudflare excels in rapid revenue expansion but still incurs losses due to heavy operating costs. Investors seeking stable earnings will favor F5, while growth-focused investors may watch Cloudflare’s improving trajectory cautiously.
Financial Ratios Comparison
These vital ratios act as a diagnostic tool to expose the underlying fiscal health, valuation premiums, and capital efficiency of each company:
| Ratios | Cloudflare, Inc. (NET) | F5, Inc. (FFIV) |
|---|---|---|
| ROE | -7.53% | 19.28% |
| ROIC | -6.06% | 13.99% |
| P/E | -467 | 26.91 |
| P/B | 35.14 | 5.19 |
| Current Ratio | 2.86 | 1.56 |
| Quick Ratio | 2.86 | 1.51 |
| D/E | 1.40 | 0.06 |
| Debt-to-Assets | 44.32% | 3.65% |
| Interest Coverage | -29.78 | 0 (not reported) |
| Asset Turnover | 0.51 | 0.49 |
| Fixed Asset Turnover | 2.63 | 9.02 |
| Payout ratio | 0 | 0 |
| Dividend yield | 0 | 0 |
| Fiscal Year | 2024 | 2025 |
Efficiency & Valuation Duel: The Vital Signs
Financial ratios serve as a company’s DNA, exposing hidden risks and revealing operational strengths and weaknesses.
Cloudflare, Inc.
Cloudflare posts unfavorable profitability with a negative ROE of -7.53% and a net margin of -4.72%, signaling operational challenges. Its valuation appears stretched despite a negative P/E, with a high price-to-book ratio of 35.14. The company retains earnings, investing heavily in R&D rather than distributing dividends, reflecting a growth-focused reinvestment strategy.
F5, Inc.
F5 demonstrates strong profitability, boasting a 19.28% ROE and a net margin of 22.42%, underpinning efficient operations. Its valuation is moderately expensive at a P/E of 26.91 and P/B of 5.19. F5 maintains a robust balance sheet with low debt and good liquidity, yet it offers no dividends, likely prioritizing free cash flow for strategic growth or buybacks.
Premium Valuation vs. Operational Safety
F5 delivers superior profitability and financial health with a favorable ratio profile, albeit at a higher valuation. Cloudflare struggles with profitability and valuation metrics, reflecting higher risk. Investors seeking operational safety and consistent returns might prefer F5, while aggressive growth seekers may tolerate Cloudflare’s risk.
Which one offers the Superior Shareholder Reward?
Cloudflare, Inc. (NET) pays no dividends and has no buybacks, reinvesting heavily in growth and R&D. F5, Inc. (FFIV) also pays no dividends but executes robust buybacks, with a free cash flow per share of 15.7 and a free cash flow yield supporting this. I see F5’s buyback-driven distribution as more sustainable and rewarding in 2026, offering a clearer path to shareholder value than Cloudflare’s growth-only model.
Comparative Score Analysis: The Strategic Profile
The radar chart reveals the fundamental DNA and trade-offs of Cloudflare, Inc. and F5, Inc., highlighting their financial strengths and vulnerabilities:
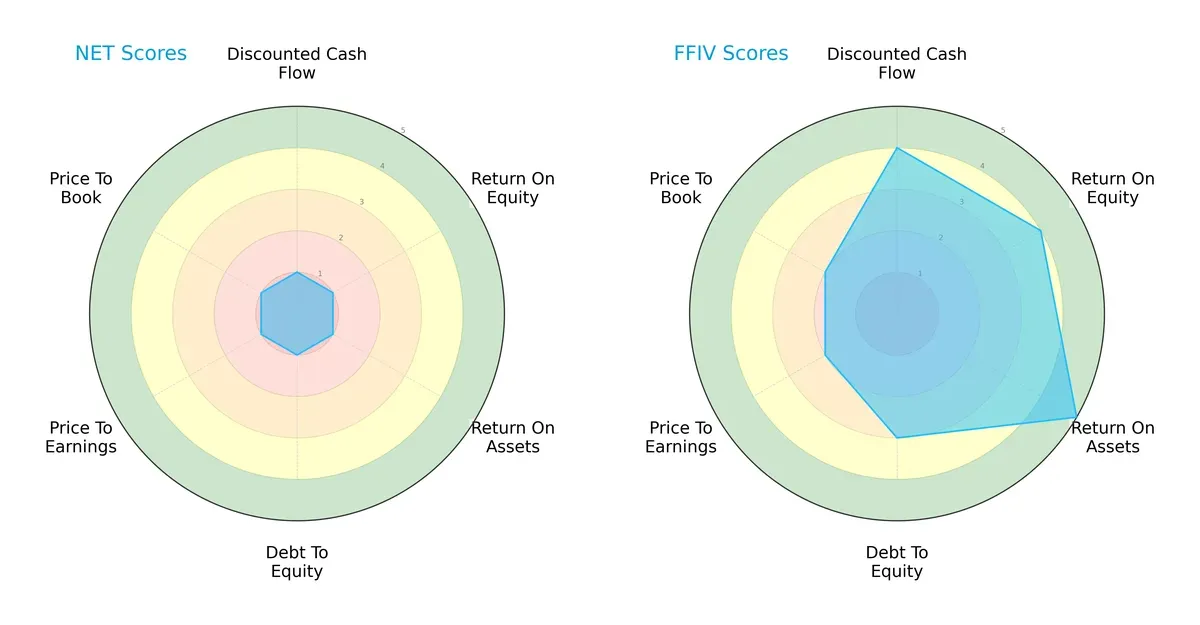
F5, Inc. dominates with a balanced profile, excelling in ROE (4 vs. 1), ROA (5 vs. 1), and DCF (4 vs. 1), signaling efficient capital allocation and strong cash flow. Cloudflare lags with uniformly low scores, indicating broad operational and valuation weaknesses. F5’s moderate debt-to-equity and valuation scores suggest prudent risk management, while Cloudflare’s consistent low scores highlight elevated financial stress.
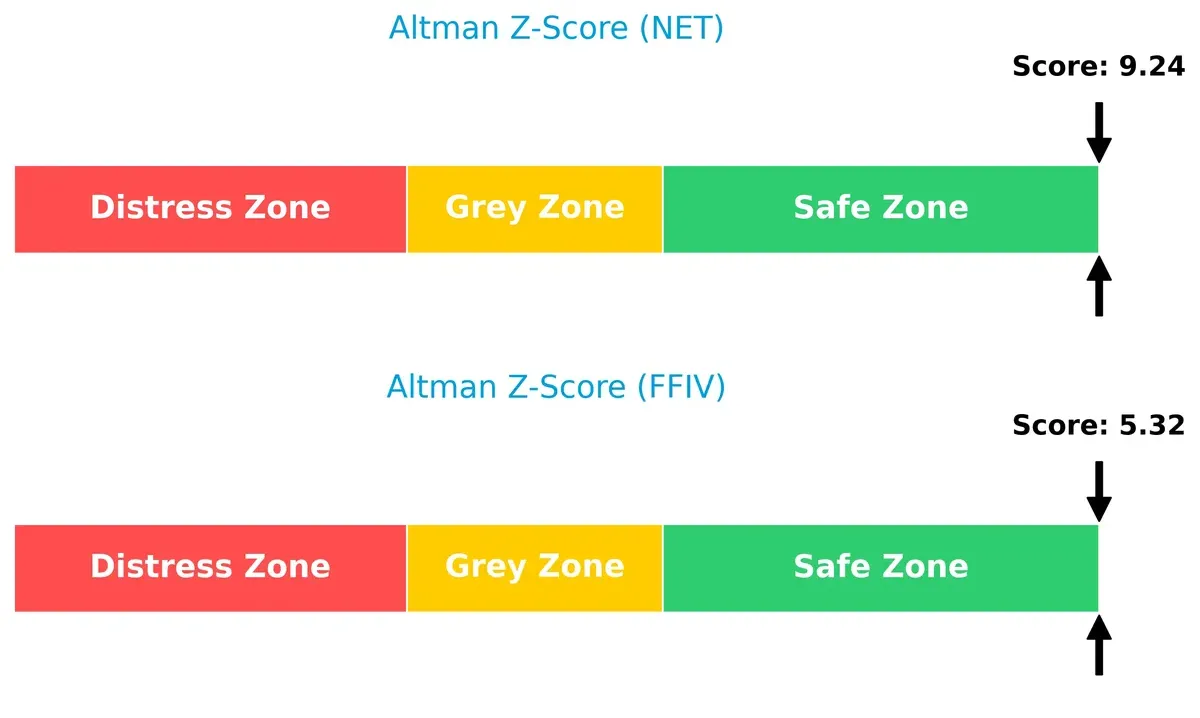
Bankruptcy Risk: Solvency Showdown
F5’s Altman Z-Score of 5.3 versus Cloudflare’s 9.2 signals both operate well within the safe zone, but Cloudflare’s exceptionally high score suggests a stronger cushion against bankruptcy risks in this cycle:
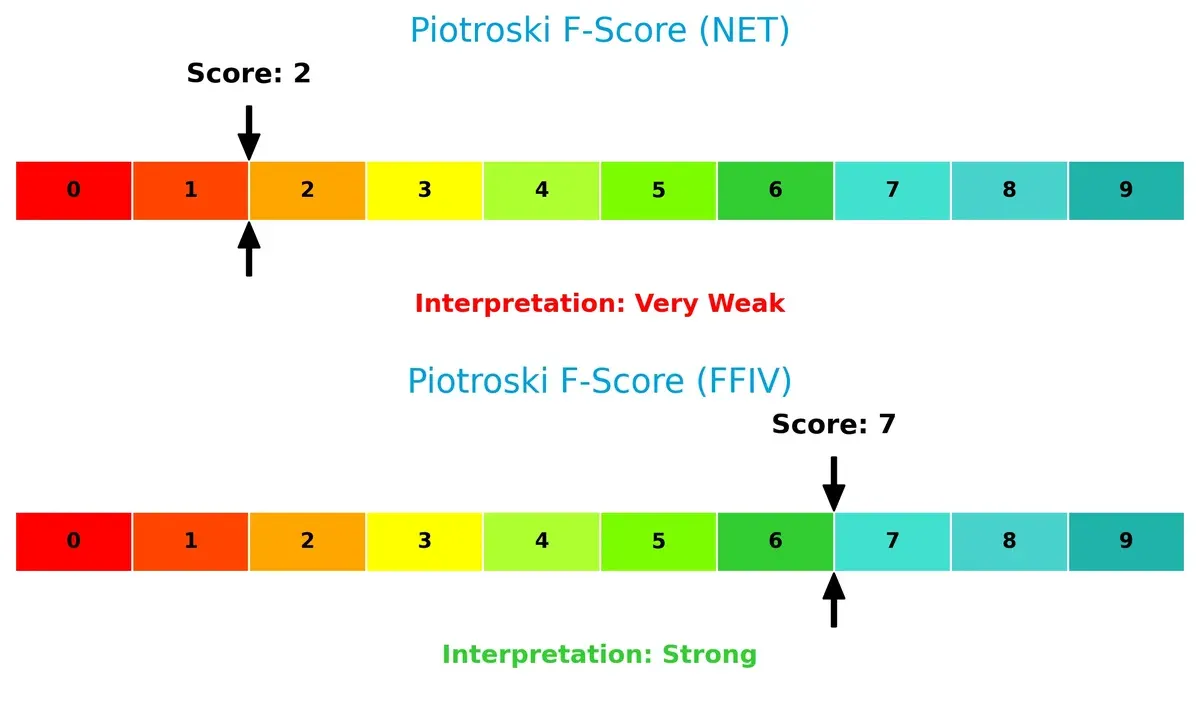
Financial Health: Quality of Operations
F5 scores a robust 7 versus Cloudflare’s weak 2 on the Piotroski F-Score, reflecting superior internal financial quality and operational efficiency. Cloudflare’s low score flags internal red flags and potential distress in profitability and liquidity metrics:
How are the two companies positioned?
This section dissects Cloudflare and F5’s operational DNA by comparing their revenue distribution and internal dynamics. The goal is to confront their economic moats to identify the most resilient and sustainable competitive advantage today.
Revenue Segmentation: The Strategic Mix
This comparison dissects how Cloudflare, Inc. and F5, Inc. diversify their income streams and reveals where each places its primary sector bets:
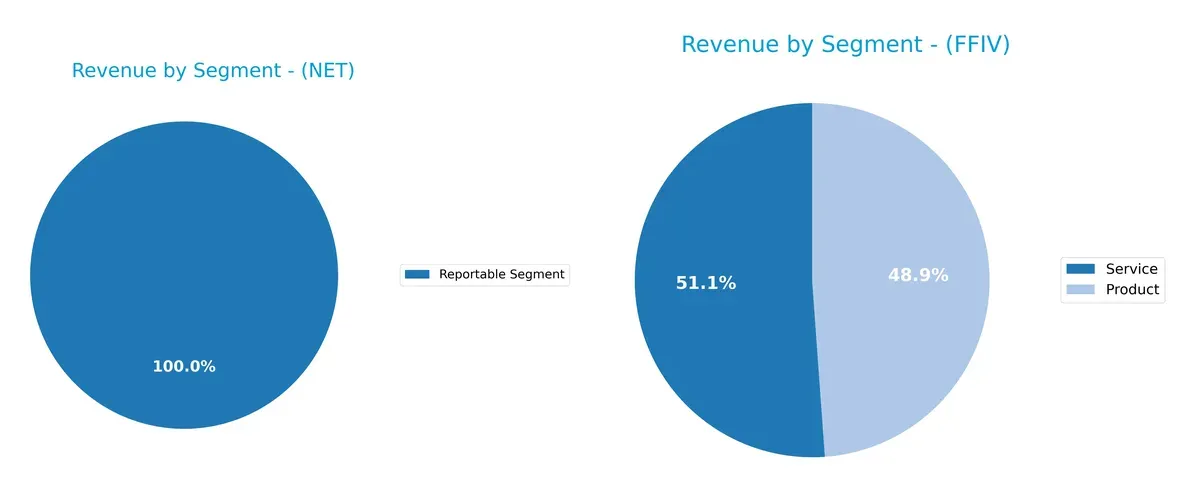
Cloudflare anchors its $1.67B revenue almost entirely in a single segment, signaling sharp focus but heightened concentration risk. In contrast, F5 splits $1.51B in Products and $1.58B in Services, maintaining a balanced mix that reduces dependency on one source. F5’s diversification suggests resilience through ecosystem lock-in, while Cloudflare’s concentration emphasizes infrastructure dominance but demands vigilance against market shifts.
Strengths and Weaknesses Comparison
This table compares the strengths and weaknesses of Cloudflare, Inc. and F5, Inc.:
Cloudflare, Inc. Strengths
- Strong global presence with diversified revenue across US, EMEA, Asia Pacific
- High current and quick ratios indicate solid short-term liquidity
- Neutral asset turnover and fixed asset turnover support operational efficiency
F5, Inc. Strengths
- Favorable profitability with strong net margin, ROE, and ROIC
- Low debt levels and excellent interest coverage enhance financial stability
- Diverse revenue streams across products and services
- Significant global reach, especially in Americas and EMEA
Cloudflare, Inc. Weaknesses
- Negative profitability metrics including net margin, ROE, and ROIC
- High WACC and debt-to-equity ratio raise cost of capital concerns
- Unfavorable interest coverage and high price-to-book ratio
- No dividend yield
F5, Inc. Weaknesses
- Unfavorable price-to-earnings and price-to-book ratios may reflect valuation risks
- Asset turnover is lower than ideal, suggesting less efficient asset use
- No dividend yield despite strong earnings
Overall, F5, Inc. demonstrates stronger profitability and financial health, supporting sustainable growth. Cloudflare’s liquidity and global reach are positives, but its profitability and capital cost challenges require strategic focus.
The Moat Duel: Analyzing Competitive Defensibility
A durable structural moat protects long-term profits from relentless competitive pressures and market entry risks. Let’s dissect the moats of two tech infrastructure firms:
Cloudflare, Inc.: Innovation-Driven Network Effects
Cloudflare’s primary moat stems from expanding network effects and integrated cloud security. Despite negative ROIC vs. WACC, rising profitability signals improving capital efficiency. New product launches in serverless computing could deepen its moat in 2026.
F5, Inc.: Proven Cost and Performance Advantage
F5’s moat centers on cost advantage through proprietary hardware-software integration, unlike Cloudflare’s software-based network effects. It sustains a strong ROIC above WACC and growing margins, positioning it well to capitalize on multi-cloud expansion and security demand.
Moat Strength Showdown: Network Effects vs. Hardware Integration
F5 holds a wider, more durable moat, demonstrated by superior ROIC and margin stability. Cloudflare’s improving profitability is promising but still trails. F5 is better equipped to defend market share amid intensifying cloud infrastructure competition.
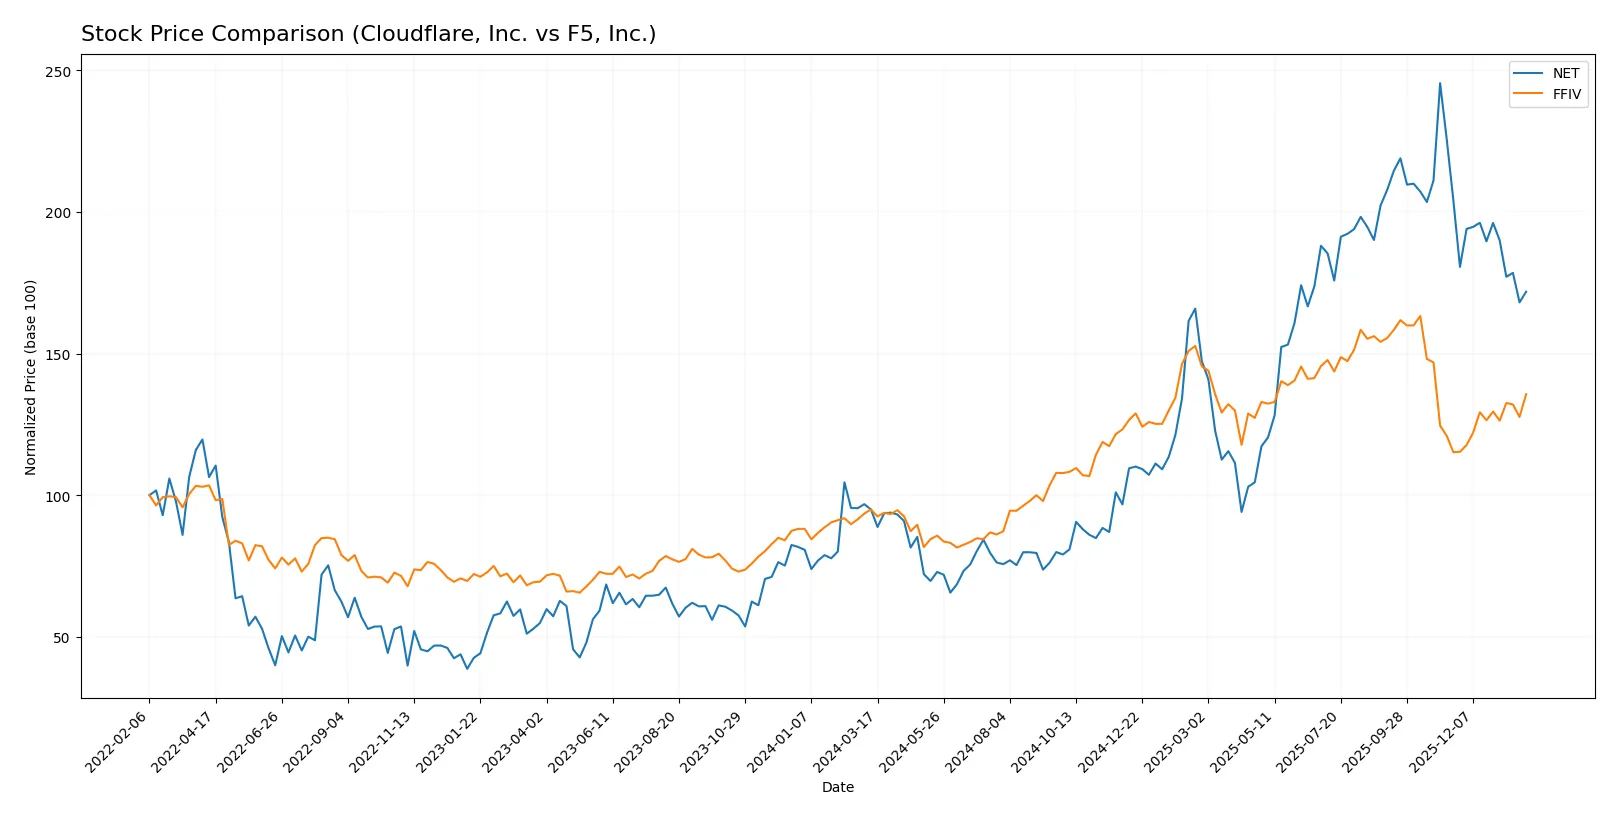
Which stock offers better returns?
Over the past year, Cloudflare, Inc. and F5, Inc. showed notable price movements, with Cloudflare’s strong gains slowing recently and F5 accelerating its upward momentum.
Trend Comparison
Cloudflare, Inc. gained 81.0% over the past year, marking a bullish trend but with decelerating momentum recently, including a 15.8% pullback since November 2025. Volatility remains high, with a 52.8% standard deviation.
F5, Inc. rose 42.9% in the same period, sustaining a bullish trend with accelerating gains. Its recent 17.8% increase since November 2025 shows buyer dominance and rising volume, supported by a 48.5% volatility measure.
Cloudflare delivered higher total returns but with recent weakness. F5 shows steadier acceleration and stronger buyer volume, indicating more consistent market performance recently.
Target Prices
Analysts set optimistic target price ranges for Cloudflare, Inc. and F5, Inc., signaling strong growth expectations.
| Company | Target Low | Target High | Consensus |
|---|---|---|---|
| Cloudflare, Inc. | 210 | 300 | 247.75 |
| F5, Inc. | 295 | 352 | 330.67 |
The consensus targets for both stocks exceed current prices by 30-50%, reflecting bullish forecasts amid robust cloud infrastructure demand.

Don’t Let Luck Decide Your Entry Point
Optimize your entry points with our advanced ProRealTime indicators. You’ll get efficient buy signals with precise price targets for maximum performance. Start outperforming now!
How do institutions grade them?
Cloudflare, Inc. Grades
The table below summarizes Cloudflare’s recent institutional grades from top firms.
| Grading Company | Action | New Grade | Date |
|---|---|---|---|
| Mizuho | maintain | Outperform | 2026-01-21 |
| Citigroup | maintain | Buy | 2026-01-16 |
| UBS | maintain | Neutral | 2026-01-13 |
| Piper Sandler | maintain | Neutral | 2026-01-05 |
| Argus Research | maintain | Buy | 2025-11-10 |
| Citigroup | maintain | Buy | 2025-11-03 |
| Susquehanna | maintain | Neutral | 2025-11-03 |
| UBS | maintain | Neutral | 2025-10-31 |
| Cantor Fitzgerald | maintain | Neutral | 2025-10-31 |
| Mizuho | maintain | Outperform | 2025-10-31 |
F5, Inc. Grades
Below are F5’s recent institutional grades from leading analysts.
| Grading Company | Action | New Grade | Date |
|---|---|---|---|
| Needham | maintain | Hold | 2026-01-28 |
| Piper Sandler | maintain | Overweight | 2026-01-28 |
| Goldman Sachs | maintain | Neutral | 2026-01-28 |
| Barclays | maintain | Equal Weight | 2026-01-28 |
| RBC Capital | maintain | Outperform | 2026-01-28 |
| JP Morgan | upgrade | Overweight | 2026-01-15 |
| Piper Sandler | upgrade | Overweight | 2026-01-05 |
| RBC Capital | upgrade | Outperform | 2026-01-05 |
| Morgan Stanley | maintain | Equal Weight | 2025-12-17 |
| Morgan Stanley | maintain | Equal Weight | 2025-10-28 |
Which company has the best grades?
Cloudflare consistently receives higher ratings, mainly Buy and Outperform, from multiple top-tier firms. F5’s grades cluster around Neutral, Equal Weight, and Overweight, indicating more cautious institutional views. This divergence may influence investor sentiment and portfolio positioning.
Risks specific to each company
The following categories identify the critical pressure points and systemic threats facing both firms in the 2026 market environment:
1. Market & Competition
Cloudflare, Inc.
- Faces fierce competition in cloud security and infrastructure with rapid innovation cycles.
F5, Inc.
- Competes with established multi-cloud application delivery and security providers, leveraging hardware-software integration.
2. Capital Structure & Debt
Cloudflare, Inc.
- High debt-to-equity ratio at 1.4 signals leverage risk and weak interest coverage.
F5, Inc.
- Low debt-to-equity at 0.06 and strong interest coverage reduce financial risk.
3. Stock Volatility
Cloudflare, Inc.
- Beta near 1.97 indicates high sensitivity to market swings and elevated volatility.
F5, Inc.
- Beta around 0.98 implies stock moves roughly in line with the market, lower volatility.
4. Regulatory & Legal
Cloudflare, Inc.
- Subject to evolving cybersecurity regulations and data privacy laws globally.
F5, Inc.
- Also exposed to multi-jurisdictional regulations but benefits from longer market presence and compliance experience.
5. Supply Chain & Operations
Cloudflare, Inc.
- Relies heavily on cloud infrastructure and network uptime; potential operational risks in scaling.
F5, Inc.
- Depends on hardware manufacturing and software delivery, with risk from supply chain disruptions.
6. ESG & Climate Transition
Cloudflare, Inc.
- ESG data limited; energy consumption in data centers poses transition risk.
F5, Inc.
- Increasing focus on sustainability in product development and operations.
7. Geopolitical Exposure
Cloudflare, Inc.
- Global footprint exposes it to US-China tensions and international data sovereignty issues.
F5, Inc.
- Broad international operations face similar geopolitical risks but with more diversified client base.
Which company shows a better risk-adjusted profile?
F5, Inc. demonstrates a stronger risk-adjusted profile, chiefly due to its conservative capital structure and stable profitability. Cloudflare’s primary concern is its high leverage coupled with negative returns, which amplifies risk amid market volatility. F5’s recent strong Altman Z-score and Piotroski score underscore financial resilience, while Cloudflare’s weak profitability metrics highlight vulnerability.
Final Verdict: Which stock to choose?
Cloudflare, Inc. (NET) shines with its rapid revenue growth and expanding gross margins, demonstrating a potent growth engine. Its main point of vigilance remains its negative returns on invested capital, signaling value destruction despite improving profitability. NET fits an aggressive growth portfolio willing to weather volatility in pursuit of market share gains.
F5, Inc. (FFIV) boasts a durable moat with solid returns on invested capital comfortably above its cost of capital. Its strong profitability, sound balance sheet, and consistent free cash flow offer better stability than NET. FFIV suits a GARP portfolio, balancing growth prospects with financial resilience and less execution risk.
If you prioritize high-growth opportunities with potential for market disruption, Cloudflare’s dynamic expansion makes it a compelling choice despite its valuation and profitability challenges. However, if you seek a stock that outshines peers in value creation and offers better stability, F5 commands a premium for its durable competitive advantage and financial strength.
Disclaimer: Investment carries a risk of loss of initial capital. The past performance is not a reliable indicator of future results. Be sure to understand risks before making an investment decision.
Go Further
I encourage you to read the complete analyses of Cloudflare, Inc. and F5, Inc. to enhance your investment decisions: