Home > Comparison > Technology > NET vs CPAY
The strategic rivalry between Cloudflare, Inc. and Corpay, Inc. shapes the future of the technology sector’s software infrastructure industry. Cloudflare operates as a cloud services provider focused on integrated security and performance solutions, while Corpay specializes in payment management for businesses and consumers. This head-to-head contrasts a cloud security innovator against a payments infrastructure leader. This analysis aims to identify which trajectory offers the best risk-adjusted return for a diversified portfolio.

Table of contents
Companies Overview
Cloudflare and Corpay stand as pivotal players in the software infrastructure sector, each shaping distinct market niches.
Cloudflare, Inc.: Integrated Cloud Security and Performance Leader
Cloudflare dominates as a cloud services provider securing and optimizing digital platforms worldwide. It generates revenue through a suite of cloud-based security solutions and performance services, including firewalls, DDoS protection, and content delivery networks. In 2026, its strategic focus sharpens on enhancing developer tools and expanding secure connectivity across public and private cloud environments.
Corpay, Inc.: Corporate Payments and Expense Management Specialist
Corpay defines itself as a payments company facilitating vehicle, lodging, and corporate payment solutions globally. Its core revenue derives from automated accounts payable, virtual cards, and cross-border corporate payments. The firm’s 2026 strategy centers on broadening its corporate payment ecosystem and streamlining expense management for business clients across multiple continents.
Strategic Collision: Similarities & Divergences
Both companies operate in infrastructure software but diverge in purpose: Cloudflare builds a security-first cloud network, while Corpay crafts a comprehensive corporate payments platform. They compete indirectly by addressing enterprise operational needs—Cloudflare secures digital assets; Corpay manages financial workflows. Their investment profiles differ markedly—Cloudflare emphasizes scalable tech innovation, Corpay relies on transactional volume and client retention.
Income Statement Comparison
This data dissects the core profitability and scalability of both corporate engines to reveal who dominates the bottom line:

| Metric | Cloudflare, Inc. (NET) | Corpay, Inc. (CPAY) |
|---|---|---|
| Revenue | 1.67B | 4.53B |
| Cost of Revenue | 379M | 1.36B |
| Operating Expenses | 1.45B | 1.21B |
| Gross Profit | 1.29B | 3.17B |
| EBITDA | 62M | 2.34B |
| EBIT | -66M | 1.95B |
| Interest Expense | 5.2M | 404M |
| Net Income | -79M | 1.07B |
| EPS | -0.23 | 15.25 |
| Fiscal Year | 2024 | 2025 |
Income Statement Analysis: The Bottom-Line Duel
This income statement comparison reveals which company runs its business with greater financial efficiency and profitability momentum.
Cloudflare, Inc. Analysis
Cloudflare’s revenue surged from 656M in 2021 to 1.67B in 2024, reflecting robust growth. Despite a strong gross margin of 77%, it struggles with negative net income, although losses narrowed to -78M in 2024 from -260M in 2021. Operating margins remain below zero, but improving EBIT and net margin trends highlight operational progress and cost discipline.
Corpay, Inc. Analysis
Corpay commands scale with revenue climbing steadily from 2.83B in 2021 to 4.53B in 2025. Its gross margin holds firm near 70%, while EBIT margin impresses at 43% in 2025. Net income rose to 1.07B, showing solid profitability despite a higher interest expense ratio. Corpay’s stable margins and consistent earnings growth underscore strong capital allocation and operational leverage.
Growth Momentum vs. Profit Power
Cloudflare excels in rapid revenue and margin expansion but still faces net losses, signaling ongoing investment and scale-building. Corpay delivers commanding profit margins and positive net income, reflecting mature operational strength. For investors prioritizing immediate profitability, Corpay’s profile appears more attractive. Those focused on growth potential may find Cloudflare’s improving trajectory compelling despite current losses.
Financial Ratios Comparison
These vital ratios act as a diagnostic tool to expose the underlying fiscal health, valuation premiums, and capital efficiency of the companies compared below:
| Ratios | Cloudflare, Inc. (NET) | Corpay, Inc. (CPAY) |
|---|---|---|
| ROE | -7.5% | 27.5% |
| ROIC | -6.1% | 8.8% |
| P/E | -467 | 19.7 |
| P/B | 35.1 | 5.4 |
| Current Ratio | 2.86 | 0.98 |
| Quick Ratio | 2.86 | 0.98 |
| D/E (Debt-to-Equity) | 1.40 | 2.58 |
| Debt-to-Assets | 44.3% | 37.9% |
| Interest Coverage | -29.8 | 4.8 |
| Asset Turnover | 0.51 | 0.17 |
| Fixed Asset Turnover | 2.63 | 9.59 |
| Payout ratio | 0 | 0 |
| Dividend yield | 0 | 0 |
| Fiscal Year | 2024 | 2025 |
Efficiency & Valuation Duel: The Vital Signs
Financial ratios serve as a company’s DNA, unveiling hidden risks and operational excellence beyond surface-level figures.
Cloudflare, Inc.
Cloudflare’s profitability tells a cautionary tale with negative ROE (-7.53%) and net margin (-4.72%), signaling operational struggles. Its valuation ratios are stretched: an extreme negative P/E and a high P/B of 35.14. The company retains earnings for growth, focusing heavily on R&D (25.2% of revenue), foregoing dividends to fuel expansion.
Corpay, Inc.
Corpay delivers robust profitability with a strong ROE of 27.55% and net margin of 23.62%, indicating efficient capital use. Its P/E of 19.73 shows a fair valuation relative to earnings, albeit with a high P/B of 5.43. Corpay reinvests cash flow into operations and maintains no dividend, prioritizing business growth over payouts.
Premium Valuation vs. Operational Safety
Cloudflare’s stretched valuation contrasts with Corpay’s solid profitability and reasonable earnings multiple. Corpay offers a better risk-reward balance, combining operational efficiency with fair valuation. Investors seeking growth with stronger fundamentals may prefer Corpay’s profile, while Cloudflare’s high valuation demands caution amid persistent losses.
Which one offers the Superior Shareholder Reward?
I compare Cloudflare, Inc. (NET) and Corpay, Inc. (CPAY) on shareholder distributions. Neither pays dividends, so I focus on payout sustainability and buyback intensity. NET shows no dividend yield and zero payout ratio, reflecting its reinvestment focus amid persistent losses. Its free cash flow per share is positive at $0.57 but modest versus share price multiples exceeding 180x. NET’s high financial leverage (3.15) and negative profitability margins suggest limited free cash flow for buybacks. Conversely, CPAY also pays no dividends but generates strong net margins (~24%), robust free cash flow per share of $18.5, and trades at a reasonable 16x free cash flow multiple. CPAY’s capital expenditure coverage exceeds 7x, enabling consistent buybacks that enhance shareholder value. Its operating margins and cash flow ratios indicate sustainable distributions through buybacks rather than dividends. I favor CPAY’s distribution model as superior for 2026, offering a more attractive and sustainable total return profile. NET’s growth investments lack near-term shareholder returns and carry higher execution risk.
Comparative Score Analysis: The Strategic Profile
The radar chart reveals the fundamental DNA and trade-offs of Cloudflare, Inc. and Corpay, Inc., highlighting their financial strengths and weaknesses:
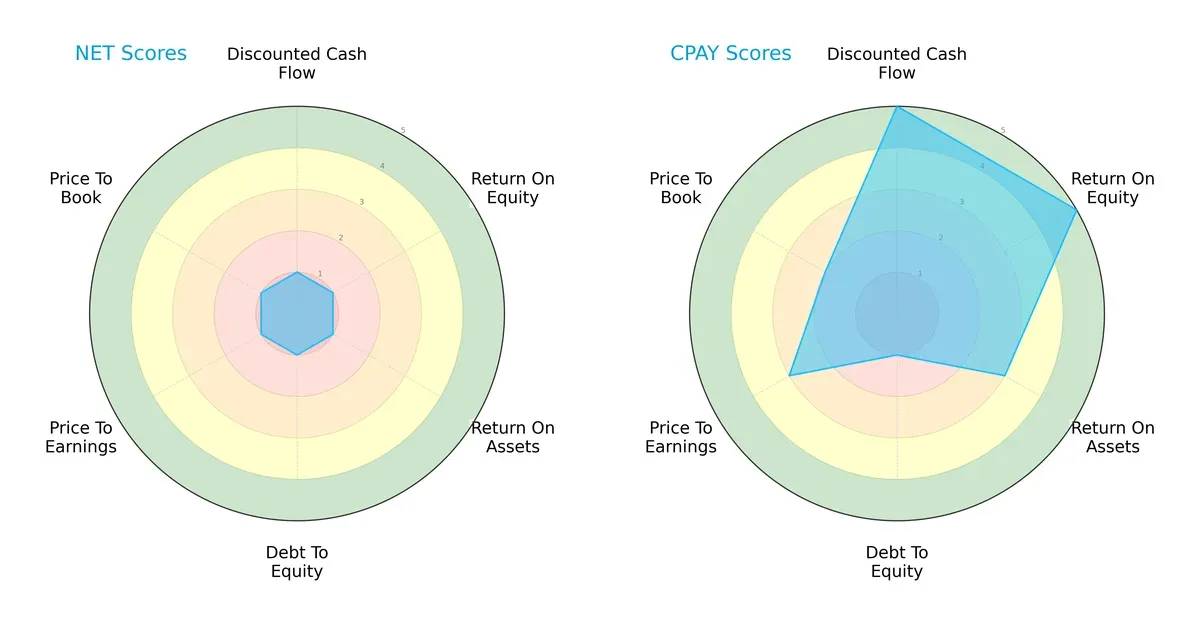
Corpay, Inc. outperforms Cloudflare, Inc. decisively in DCF, ROE, and ROA, signaling superior profitability and cash flow generation. Cloudflare scores uniformly very low, indicating systemic challenges. However, both firms share a weak debt-to-equity profile, exposing financial risk. Corpay’s valuation metrics (P/E and P/B) remain moderate but stronger than Cloudflare’s uniformly unfavorable scores. Corpay presents a more balanced and robust financial profile, while Cloudflare relies on no distinct edge.
Bankruptcy Risk: Solvency Showdown
The Altman Z-Score gap signals vastly different solvency prospects:
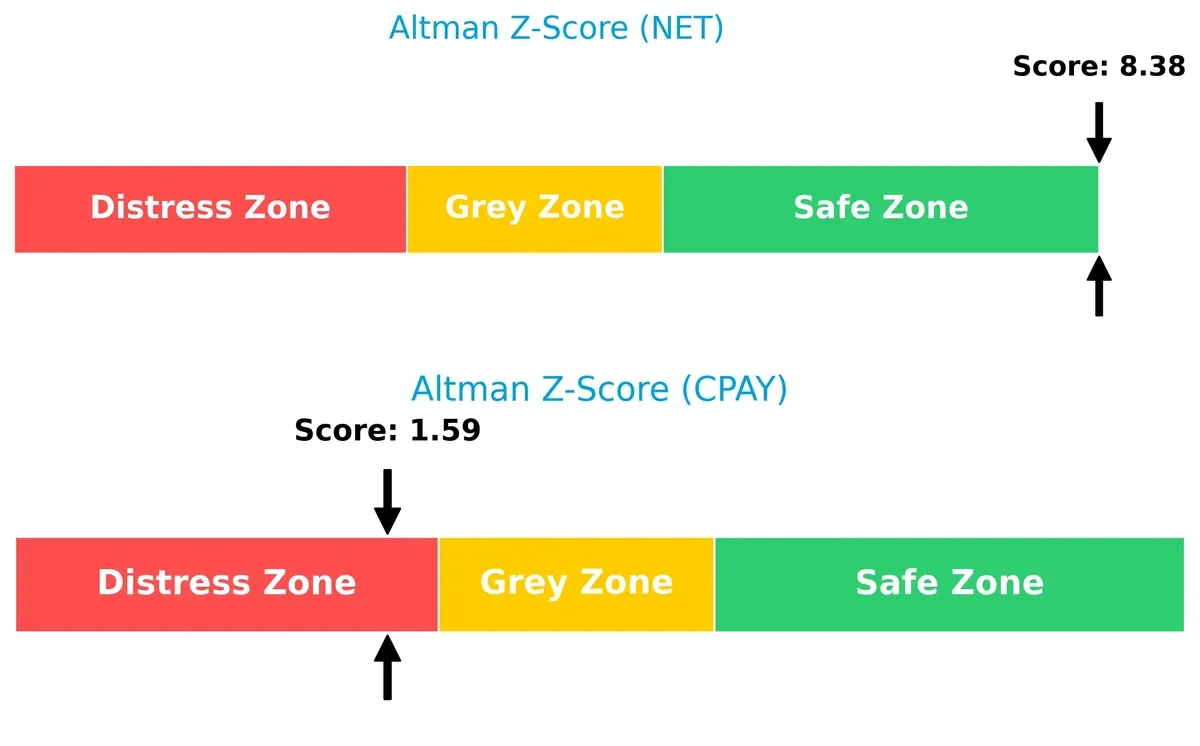
Cloudflare, Inc. scores 8.38, placing it securely in the safe zone and suggesting strong long-term survival odds. Corpay, Inc. scores 1.59, deep in the distress zone, signaling a high bankruptcy risk. This stark contrast reflects Cloudflare’s healthier balance sheet and lower default probability amid current market cycles.
Financial Health: Quality of Operations
Piotroski F-Scores highlight operational quality differences:
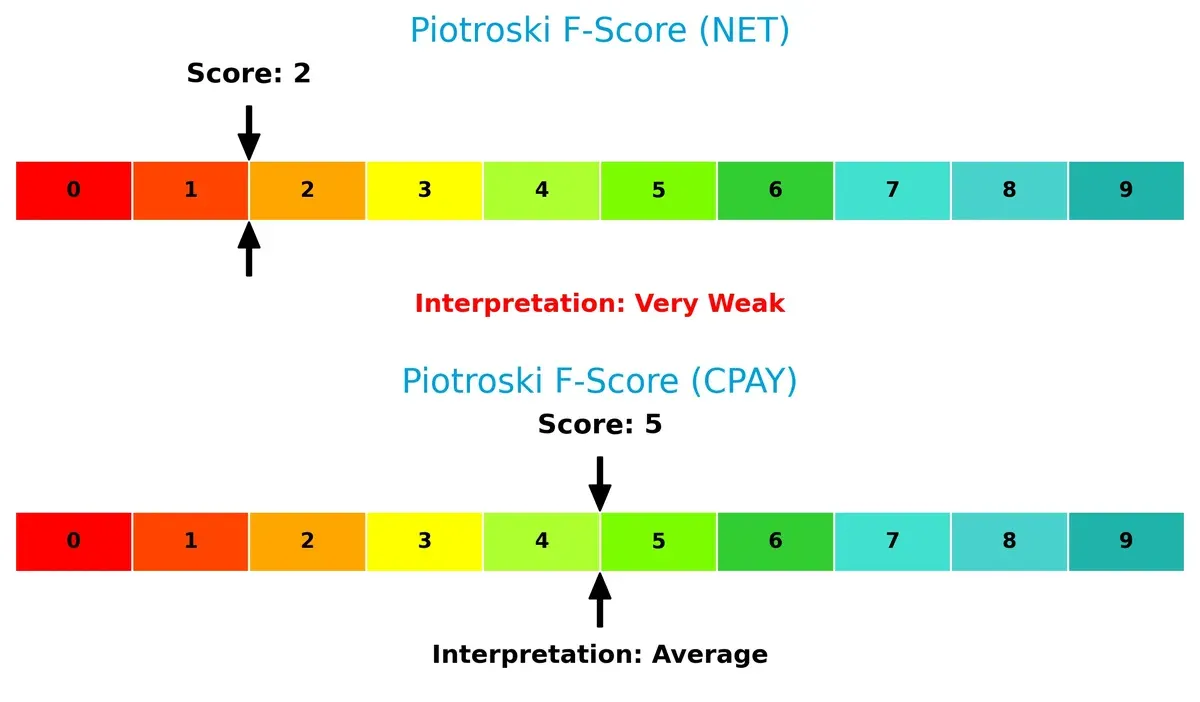
Corpay’s score of 5 indicates average financial health with some operational strengths. Cloudflare’s score of 2 flags very weak internal metrics, raising red flags about profitability and efficiency. This divergence suggests Corpay manages its finances more prudently, whereas Cloudflare shows early signs of financial strain.
How are the two companies positioned?
This section dissects the operational DNA of Cloudflare and Corpay by comparing their revenue distribution and internal strengths and weaknesses. The goal is to confront their economic moats and determine which business model offers the most resilient competitive advantage today.
Revenue Segmentation: The Strategic Mix
This visual comparison dissects how Cloudflare, Inc. and Corpay, Inc. diversify their income streams and reveals the primary sectors where each company places its strategic bets:
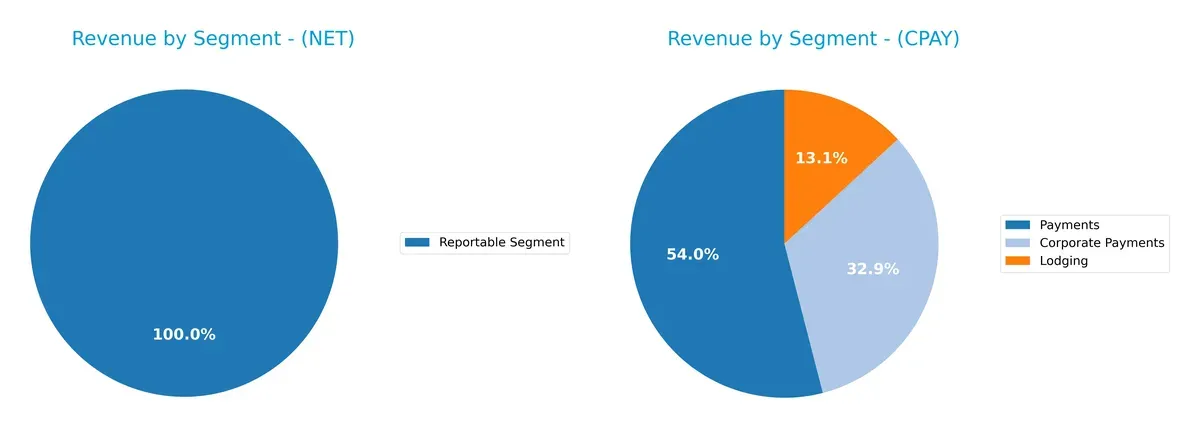
Cloudflare reports a single segment revenue of $1.67B, indicating a highly concentrated business model. Corpay shows a more diversified mix with Payments at $2.01B, Corporate Payments at $1.22B, and Lodging at $489M. Corpay’s spread reduces reliance on any single segment, lowering concentration risk. Cloudflare’s focus suggests deep specialization, likely leveraging infrastructure dominance but exposing it to segment-specific volatility.
Strengths and Weaknesses Comparison
This table compares the Strengths and Weaknesses of Cloudflare, Inc. (NET) and Corpay, Inc. (CPAY):
NET Strengths
- Diversified global revenue across US, EMEA, Asia Pacific
- Favorable liquidity ratios with current and quick ratio at 2.86
- Strong fixed asset turnover at 2.63
CPAY Strengths
- Solid profitability with 23.62% net margin and 27.55% ROE
- Favorable WACC at 6.26% supports capital efficiency
- High fixed asset turnover at 9.59
NET Weaknesses
- Negative profitability metrics including net margin (-4.72%) and ROE (-7.53%)
- High price-to-book ratio at 35.14 suggests overvaluation
- Elevated debt-to-equity at 1.4 and negative interest coverage
- Unfavorable leverage and returns on invested capital (-6.06%)
CPAY Weaknesses
- Lower liquidity with current ratio at 0.98, a red flag
- Higher debt-to-equity at 2.58 and moderate interest coverage
- Unfavorable asset turnover at 0.17 indicates lower operational efficiency
- Slightly unfavorable PB ratio at 5.43
Both companies show contrasting financial health profiles. NET excels in liquidity and geographic diversification but struggles with profitability and leverage. CPAY demonstrates strong profitability and capital efficiency but faces liquidity constraints and operational efficiency challenges. These factors will shape each company’s strategic financial management and risk profile.
The Moat Duel: Analyzing Competitive Defensibility
A structural moat protects long-term profits from competition erosion. Only this durable advantage ensures sustained value creation for investors:
Cloudflare, Inc.: Network Effects with Expanding Cloud Security Ecosystem
I see Cloudflare’s moat rooted in network effects and intangible assets like proprietary security tech. Despite a negative ROIC vs. WACC, improving margins and 28% revenue growth highlight growing profitability. New cloud products in 2026 could deepen this moat but competition pressures remain fierce.
Corpay, Inc.: Cost Advantage Through Global Payment Solutions
Corpay’s moat lies in its cost advantage and scale in corporate payment processing, contrasting Cloudflare’s tech-driven edge. It delivers a positive ROIC exceeding WACC, signaling value creation despite a recent ROIC decline. Expansion into emerging markets and cross-border payments offers growth opportunities.
Network Effects vs. Cost Leadership: The Moat Showdown
Cloudflare’s rising profitability signals a potentially wider moat built on innovation and platform stickiness. Corpay’s deeper moat stems from consistent value creation through operational efficiency. Yet, Cloudflare’s innovation-centric moat better positions it to defend market share amid technological disruption.
Which stock offers better returns?
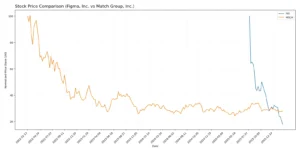
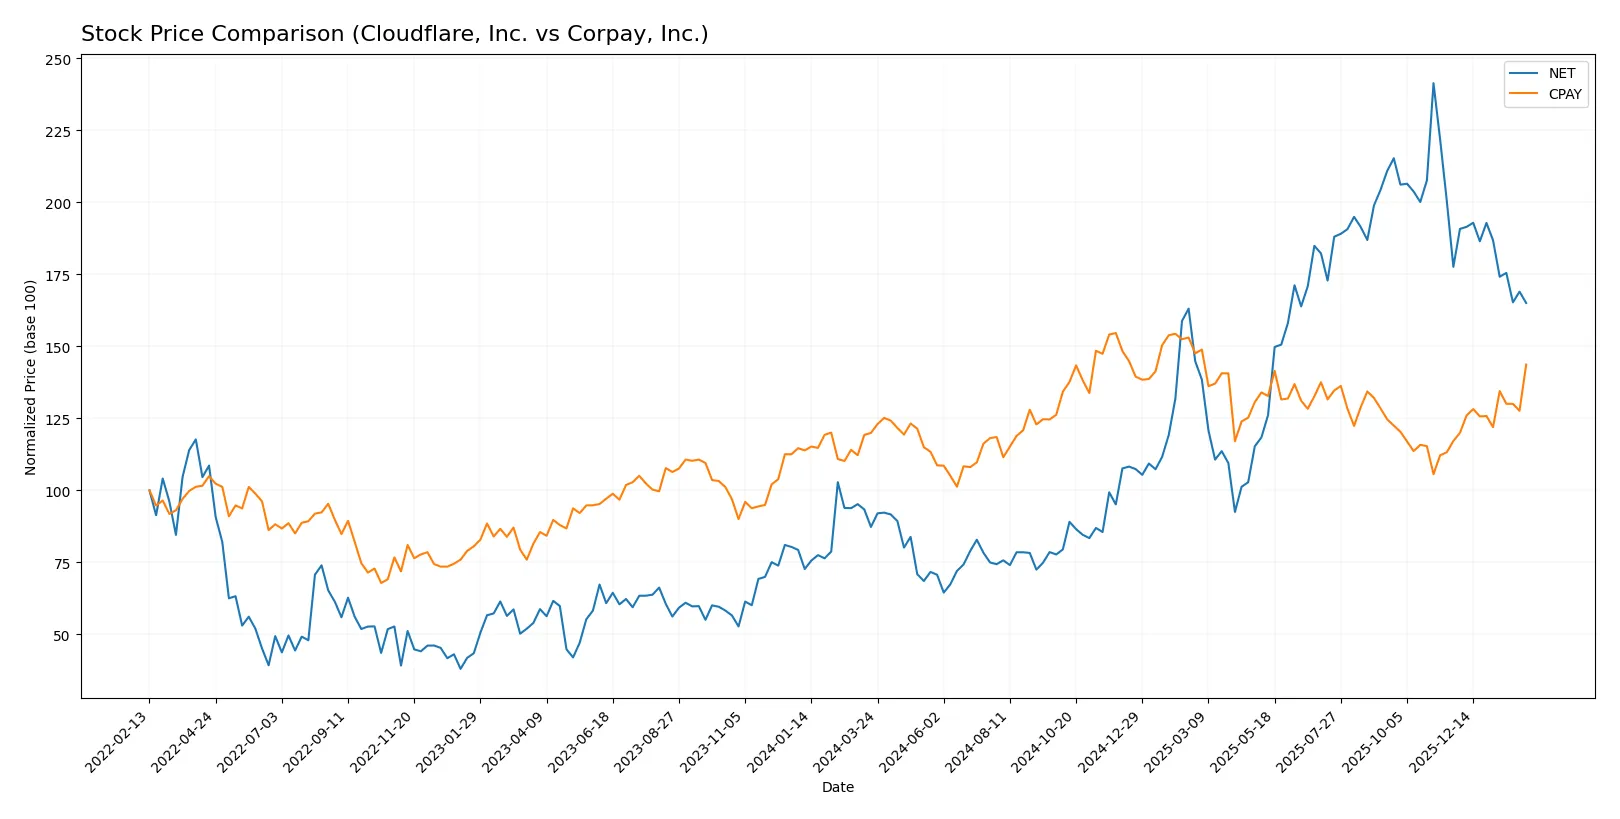
Over the past 12 months, Cloudflare, Inc. and Corpay, Inc. experienced divergent price dynamics, with Cloudflare showing strong gains but recent weakness, while Corpay accelerated its upward momentum with notable buyer dominance.
Trend Comparison
Cloudflare, Inc. posted an 89.09% gain over the last year, indicating a bullish trend with decelerating momentum. The stock ranged from 67.69 to 253.3, showing high volatility (52.75 std deviation). Recent months show a -7.07% pullback.
Corpay, Inc. gained 19.8% over the same period, maintaining a bullish trend with accelerating momentum. Its price fluctuated between 249.66 and 381.18 with moderate volatility (31.25 std deviation). Recent gains accelerated 22.63%.
Cloudflare clearly outperformed Corpay over the full year. However, Corpay’s recent acceleration contrasts with Cloudflare’s recent decline, highlighting differing near-term momentum.
Target Prices
Analysts show a clear bullish consensus for Cloudflare, Inc. and Corpay, Inc. based on robust target ranges.
| Company | Target Low | Target High | Consensus |
|---|---|---|---|
| Cloudflare, Inc. | 185 | 300 | 242.53 |
| Corpay, Inc. | 300 | 390 | 359.33 |
Both stocks trade below their consensus targets, signaling significant upside potential. Cloudflare’s target consensus exceeds its current price by nearly 40%, while Corpay’s stands just above its trading level, reflecting steady optimism.

Don’t Let Luck Decide Your Entry Point
Optimize your entry points with our advanced ProRealTime indicators. You’ll get efficient buy signals with precise price targets for maximum performance. Start outperforming now!
How do institutions grade them?
This section compares recent institutional grades for Cloudflare, Inc. and Corpay, Inc.:
Cloudflare, Inc. Grades
The following table summarizes recent grades from reputable institutions for Cloudflare, Inc.:
| Grading Company | Action | New Grade | Date |
|---|---|---|---|
| BTIG | Upgrade | Buy | 2026-02-04 |
| Mizuho | Maintain | Outperform | 2026-01-21 |
| Citigroup | Maintain | Buy | 2026-01-16 |
| UBS | Maintain | Neutral | 2026-01-13 |
| Piper Sandler | Maintain | Neutral | 2026-01-05 |
| Argus Research | Maintain | Buy | 2025-11-10 |
| Susquehanna | Maintain | Neutral | 2025-11-03 |
| Citigroup | Maintain | Buy | 2025-11-03 |
| Needham | Maintain | Buy | 2025-10-31 |
| UBS | Maintain | Neutral | 2025-10-31 |
Corpay, Inc. Grades
Below are recent institutional grades from recognized sources for Corpay, Inc.:
| Grading Company | Action | New Grade | Date |
|---|---|---|---|
| Mizuho | Maintain | Neutral | 2026-02-06 |
| JP Morgan | Maintain | Overweight | 2026-02-05 |
| RBC Capital | Maintain | Sector Perform | 2026-02-05 |
| Morgan Stanley | Maintain | Overweight | 2026-02-05 |
| Morgan Stanley | Upgrade | Overweight | 2026-01-26 |
| Oppenheimer | Maintain | Outperform | 2026-01-12 |
| Oppenheimer | Upgrade | Outperform | 2025-12-05 |
| UBS | Maintain | Neutral | 2025-11-06 |
| RBC Capital | Maintain | Sector Perform | 2025-11-06 |
| JP Morgan | Maintain | Overweight | 2025-11-06 |
Which company has the best grades?
Cloudflare, Inc. holds a stronger consensus with multiple “Buy” and “Outperform” ratings. Corpay, Inc. mainly receives “Overweight” and “Outperform,” but also several “Neutral” and “Sector Perform.” Investors may view Cloudflare’s steadier “Buy” ratings as a signal of higher confidence from analysts.
Risks specific to each company
The following categories identify the critical pressure points and systemic threats facing both firms in the 2026 market environment:
1. Market & Competition
Cloudflare, Inc.
- Operates in a highly competitive cloud security and infrastructure sector with rapid innovation cycles.
Corpay, Inc.
- Faces intense competition in payments and corporate expense management across multiple international markets.
2. Capital Structure & Debt
Cloudflare, Inc.
- Debt-to-equity ratio is 1.4, indicating moderate leverage but unfavorable interest coverage (-12.64).
Corpay, Inc.
- Higher leverage with debt-to-equity at 2.58 and only moderate interest coverage (4.83), raising financial risk.
3. Stock Volatility
Cloudflare, Inc.
- Beta of 1.98 reflects high stock volatility, implying higher market risk sensitivity.
Corpay, Inc.
- Beta of 0.81 shows relatively low volatility, indicating more stable price movements.
4. Regulatory & Legal
Cloudflare, Inc.
- Subject to evolving data privacy and cybersecurity regulations globally; compliance complexity is high.
Corpay, Inc.
- Faces regulatory scrutiny in payments, cross-border transactions, and compliance with financial laws in multiple jurisdictions.
5. Supply Chain & Operations
Cloudflare, Inc.
- Relies on global network infrastructure and cloud partners; disruptions could affect service reliability.
Corpay, Inc.
- Depends on extensive payment networks and merchant relationships; operational hiccups can impact transaction processing.
6. ESG & Climate Transition
Cloudflare, Inc.
- Increasing pressure to reduce data center emissions and improve energy efficiency amid tech sector ESG trends.
Corpay, Inc.
- Needs to address sustainability in fleet and corporate travel payments, facing rising ESG expectations from clients.
7. Geopolitical Exposure
Cloudflare, Inc.
- Exposure to US-China tensions and global internet regulations could disrupt international operations.
Corpay, Inc.
- Operations span US, Brazil, UK, and others, exposing it to currency risks and geopolitical instability.
Which company shows a better risk-adjusted profile?
Corpay’s strongest risk is its high leverage, which elevates financial vulnerability despite solid profitability. Cloudflare struggles with negative profitability and high stock volatility, increasing its market risk. Corpay’s broader geographic exposure adds complexity but benefits from a stronger Altman Z-Score and Piotroski Score. Overall, Corpay shows a better risk-adjusted profile, supported by a safer credit position and more favorable earnings metrics, despite operational and ESG challenges. Cloudflare’s negative return metrics and very weak profitability scores justify caution for risk-conscious investors.
Final Verdict: Which stock to choose?
Cloudflare’s superpower lies in its expanding gross margins and rapid revenue growth, signaling strong market traction. However, its persistent negative returns on capital and weak profitability metrics remain points of vigilance. This stock fits an aggressive growth portfolio willing to tolerate operational drag for long-term scale.
Corpay benefits from a durable moat driven by steady cash flow and solid returns on equity. Its value creation is more stable than Cloudflare’s, despite a modest decline in ROIC trend and some leverage concerns. Corpay suits a GARP investor seeking growth with a better margin of safety.
If you prioritize high-growth potential and can absorb short-term profitability challenges, Cloudflare outshines as a compelling choice due to its accelerating top-line momentum. However, if you seek more stability and consistent value creation, Corpay offers better financial footing and risk management, though at a premium valuation.
Disclaimer: Investment carries a risk of loss of initial capital. The past performance is not a reliable indicator of future results. Be sure to understand risks before making an investment decision.
Go Further
I encourage you to read the complete analyses of Cloudflare, Inc. and Corpay, Inc. to enhance your investment decisions: