Home > Comparison > Financial Services > USB vs CFG
The strategic rivalry between U.S. Bancorp and Citizens Financial Group defines the competitive landscape of regional banking in the U.S. U.S. Bancorp operates as a diversified financial services giant with broad wealth management and payment services, while Citizens Financial focuses on retail and commercial banking with a more concentrated branch network. This analysis will assess which operational model offers a superior risk-adjusted return, guiding investors seeking balanced exposure in the financial services sector.
Table of contents
Companies Overview
U.S. Bancorp and Citizens Financial Group stand as key players in the U.S. regional banking landscape, shaping financial services for diverse customer bases.
U.S. Bancorp: Diversified Financial Services Leader
U.S. Bancorp dominates as a financial services holding company with a broad revenue base spanning commercial banking, wealth management, and payment services. It generates income through lending, deposit products, asset management, and ancillary corporate services. In 2021, it focused on expanding digital channels and deepening its footprint across the Midwest and West with a network of 2,230 branches and 4,059 ATMs.
Citizens Financial Group: Regional Banking Specialist
Citizens Financial Group operates primarily in retail and commercial banking with a strategic emphasis on consumer and commercial segments. Its core income derives from deposit products, mortgage lending, business loans, and treasury management services. As of the latest data, Citizens targets growth through digital innovation and selective market expansion, operating roughly 1,200 branches and 3,300 ATMs primarily in the Northeast and Mid-Atlantic.
Strategic Collision: Similarities & Divergences
Both banks compete fiercely in regional retail and commercial banking, yet U.S. Bancorp adopts a diversified business model with a wider product range, while Citizens pursues focused growth via consumer and commercial banking. Their battleground lies in digital service innovation and geographic expansion. Investors face contrasting profiles: U.S. Bancorp’s scale offers stability, whereas Citizens presents a more concentrated growth opportunity with higher operational leverage.
Income Statement Comparison
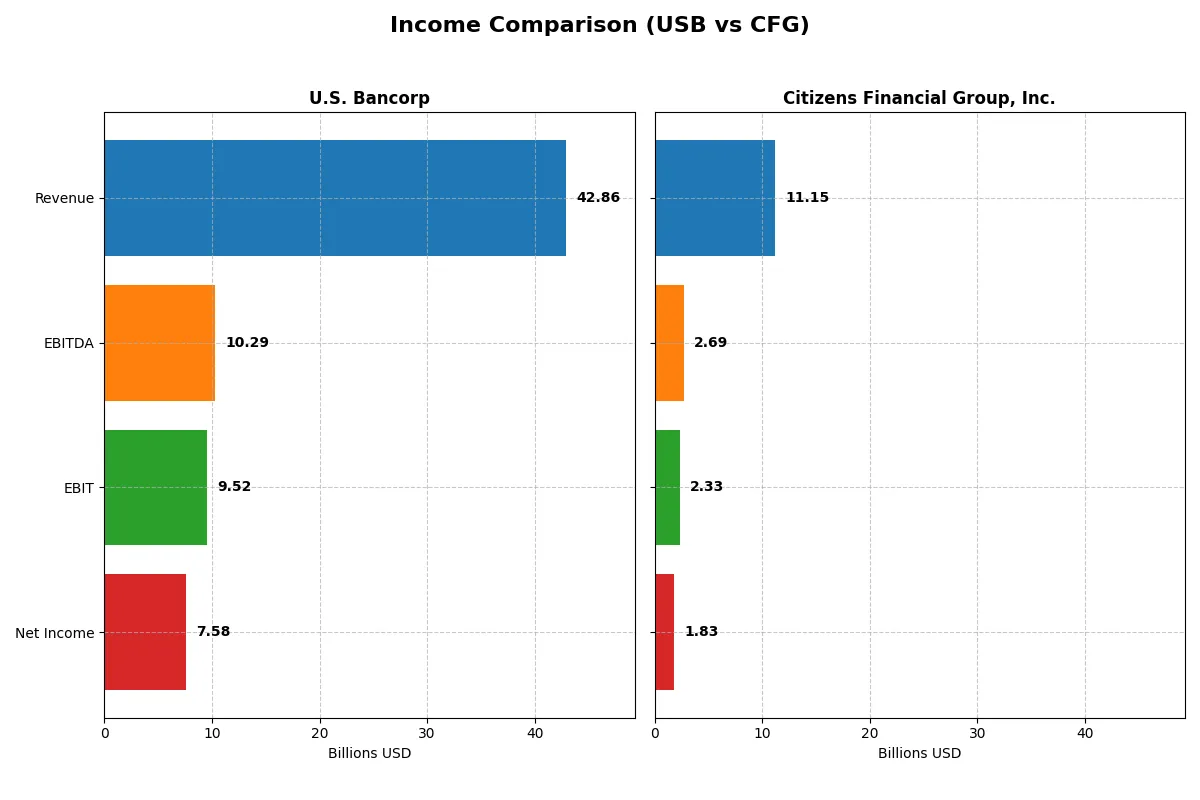
This data dissects the core profitability and scalability of both corporate engines to reveal who dominates the bottom line:
| Metric | U.S. Bancorp (USB) | Citizens Financial Group, Inc. (CFG) |
|---|---|---|
| Revenue | 42.9B | 11.1B |
| Cost of Revenue | 15.9B | 3.37B |
| Operating Expenses | 17.4B | 5.45B |
| Gross Profit | 26.9B | 7.78B |
| EBITDA | 10.3B | 2.69B |
| EBIT | 9.52B | 2.33B |
| Interest Expense | 14.3B | 3.81B |
| Net Income | 7.58B | 1.83B |
| EPS | 4.62 | 3.9 |
| Fiscal Year | 2025 | 2025 |
Income Statement Analysis: The Bottom-Line Duel
This income statement comparison reveals the true efficiency and profitability of each bank’s core business engine over recent years.
U.S. Bancorp Analysis
U.S. Bancorp’s revenue climbed steadily from 23.7B in 2021 to 42.9B in 2025, reflecting strong top-line growth. Net income showed volatility, peaking at 7.6B in 2025 but declining overall across five years. The gross margin remains robust at 62.8%, while a net margin of 17.7% confirms solid profitability. The 2025 jump in EBIT by 20.3% signals improving operational efficiency.
Citizens Financial Group Analysis
Citizens Financial’s revenue expanded from 7.0B in 2021 to 11.1B in 2025, though it dipped 9.7% year-over-year. Net income fell overall, ending at 1.8B despite a 34.4% net margin increase last year. Citizens sustains a higher gross margin near 69.8%, but its net margin at 16.4% trails slightly behind U.S. Bancorp. EBIT surged 23.3% in 2025, pointing to stronger momentum despite revenue headwinds.
Margin Strength vs. Growth Momentum
U.S. Bancorp outpaces Citizens Financial in revenue scale and net income levels, supported by consistent margin performance. Citizens excels in gross margin and recent EBIT growth but struggles with revenue contraction. The fundamental winner on income metrics is U.S. Bancorp for combining scale with improving efficiency. Investors seeking steady profitability may prefer U.S. Bancorp’s profile, while those favoring growth potential might watch Citizens closely.
Financial Ratios Comparison
These vital ratios act as a diagnostic tool to expose the underlying fiscal health, valuation premiums, and capital efficiency of the companies compared below:
| Ratios | U.S. Bancorp (USB) | Citizens Financial Group (CFG) |
|---|---|---|
| ROE | 11.62% | 6.96% |
| ROIC | 11.14% | 4.25% |
| P/E | 10.95 | 13.76 |
| P/B | 1.27 | 0.96 |
| Current Ratio | 2.73 | 1.04 |
| Quick Ratio | 2.73 | 1.04 |
| D/E | 1.20 | 0.43 |
| Debt-to-Assets | 11.26% | 4.98% |
| Interest Coverage | 0.66 | 0.61 |
| Asset Turnover | 0.062 | 0.049 |
| Fixed Asset Turnover | 11.38 | 12.18 |
| Payout ratio | 41.46% | 40.52% |
| Dividend yield | 3.79% | 2.94% |
| Fiscal Year | 2025 | 2025 |
Efficiency & Valuation Duel: The Vital Signs
Ratios serve as the company’s DNA, revealing hidden risks and operational excellence that shape investment decisions and portfolio resilience.
U.S. Bancorp
U.S. Bancorp shows solid profitability with an 11.62% ROE and a strong 17.68% net margin, signaling efficient core operations. Its valuation appears reasonable with a P/E of 10.95 and P/B of 1.27, suggesting the stock is fairly priced. A 3.79% dividend yield rewards shareholders, reflecting disciplined capital allocation.
Citizens Financial Group, Inc.
Citizens Financial posts a lower 6.96% ROE and a 16.42% net margin, indicating less efficiency in generating equity returns. The P/E of 13.76 and P/B of 0.96 imply modest valuation, with a 2.94% dividend yield supporting income investors. The company balances reinvestment and shareholder returns amid moderate profitability.
Balanced Profitability vs. Valuation Discipline
U.S. Bancorp offers stronger profitability and higher dividend yield at a more attractive valuation multiple. Citizens Financial presents a leaner balance sheet with a slightly more conservative valuation but lower returns. Investors seeking robust core earnings might favor U.S. Bancorp’s profile, while those prioritizing balance sheet strength could lean toward Citizens Financial.
Which one offers the Superior Shareholder Reward?
I see U.S. Bancorp (USB) delivers a higher dividend yield around 3.8-4.9% with payout ratios near 41-61%, supported by consistent free cash flow coverage. USB also runs steady buybacks enhancing total returns. Citizens Financial (CFG) yields slightly lower at 2.9-5.9%, with payout ratios 34-60%, but shows less buyback intensity and lower leverage. CFG reinvests more in growth, evident from higher book values and tangible assets per share. Historically, USB’s balanced dividend and buyback approach offers a more sustainable, attractive total return profile in 2026. I favor USB for superior, shareholder-friendly capital allocation.
Comparative Score Analysis: The Strategic Profile
The radar chart reveals the fundamental DNA and trade-offs of U.S. Bancorp and Citizens Financial Group, Inc., highlighting their distinct financial strengths and vulnerabilities:
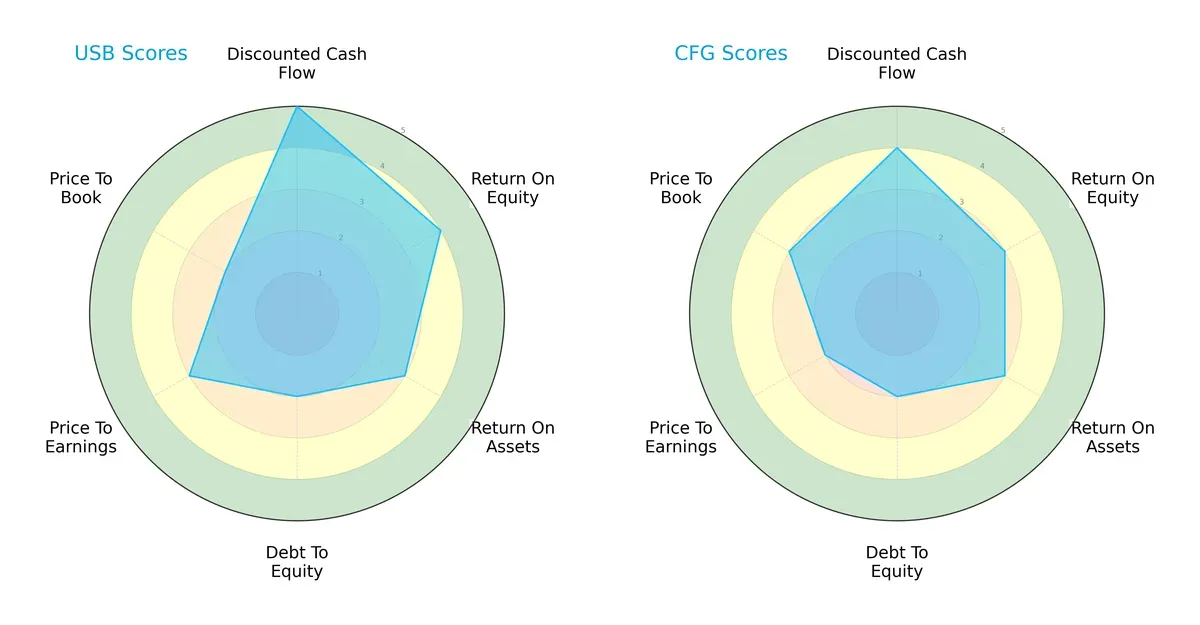
U.S. Bancorp leads in discounted cash flow (5 vs. 4) and return on equity (4 vs. 3), indicating superior profit generation and valuation appeal. Citizens Financial holds a slight edge in price-to-book (3 vs. 2), suggesting marginally better market valuation relative to assets. Both firms share moderate debt-to-equity risk (2), but U.S. Bancorp’s more balanced profile contrasts with Citizens’ reliance on valuation metrics.
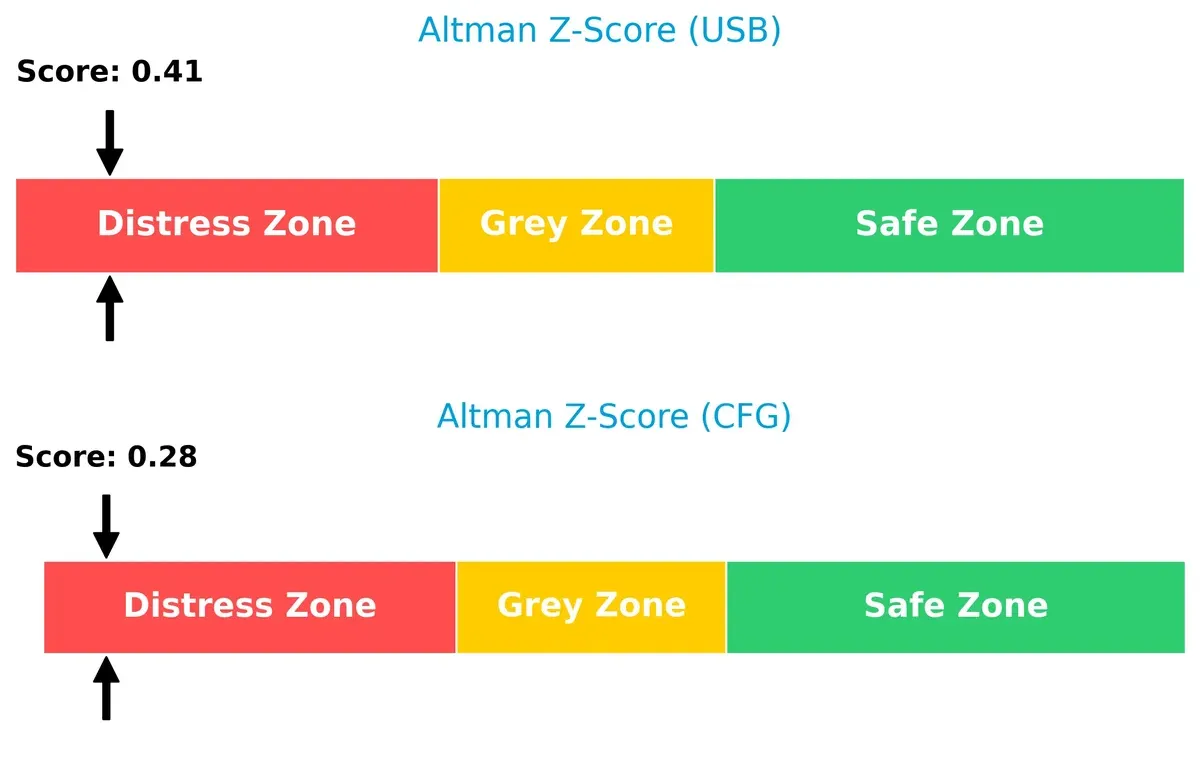
Bankruptcy Risk: Solvency Showdown
U.S. Bancorp and Citizens Financial both reside in the distress zone with Altman Z-Scores below 1.8, signaling elevated bankruptcy risk and financial fragility in this cycle:
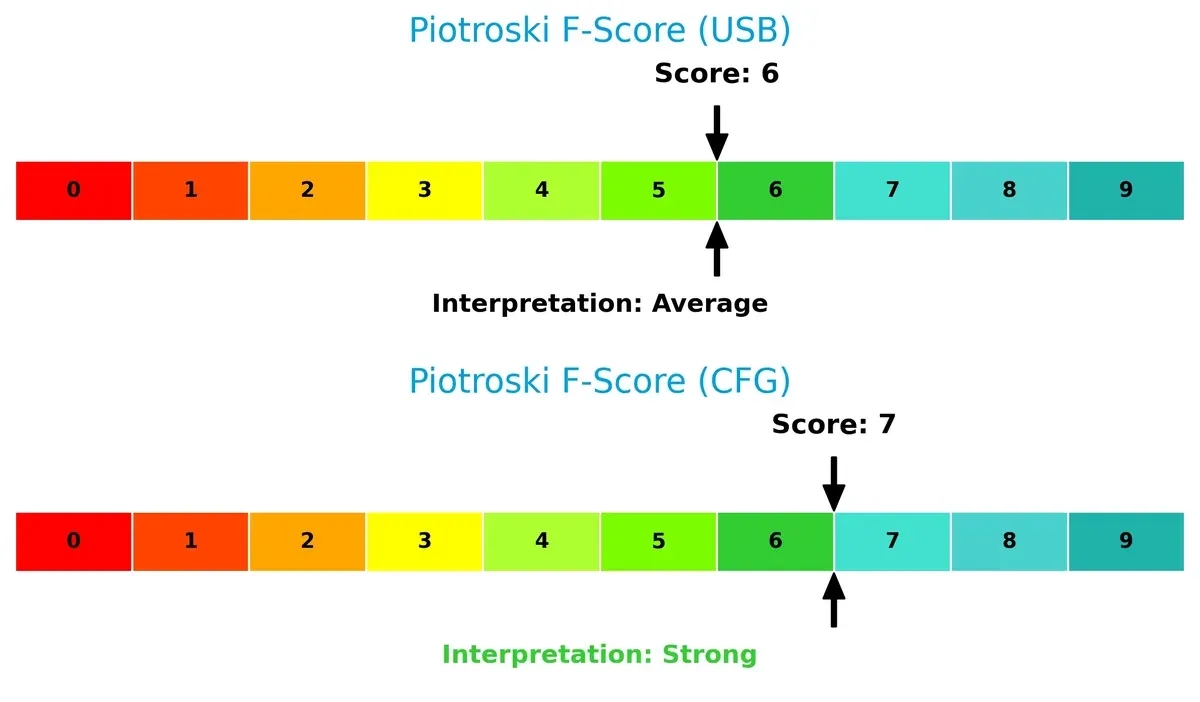
Financial Health: Quality of Operations
Citizens Financial scores a stronger 7 on the Piotroski scale versus U.S. Bancorp’s 6, reflecting better internal financial health and operational quality. While neither firm is in peak condition, U.S. Bancorp shows more red flags in internal metrics:
How are the two companies positioned?
This section dissects USB and CFG’s operational DNA by comparing revenue distribution and internal strengths and weaknesses. The goal is to confront their economic moats to identify the more resilient, sustainable competitive advantage in today’s market.
Revenue Segmentation: The Strategic Mix
The following visual comparison dissects how U.S. Bancorp and Citizens Financial Group diversify their income streams and where their primary sector bets lie:
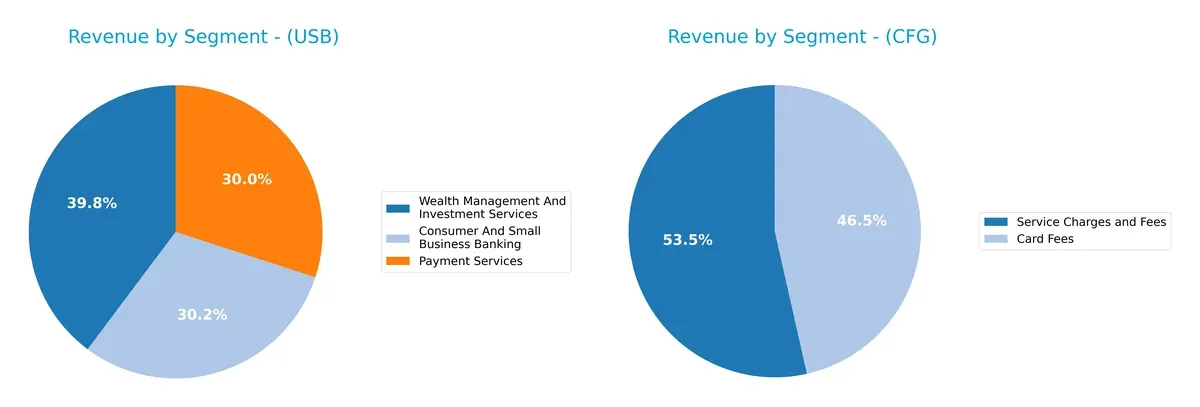
U.S. Bancorp anchors its revenue in Wealth Management and Consumer Banking, generating $12.2B and $9.3B respectively in 2024. It showcases a well-diversified mix across Payment Services ($9.2B) too. Conversely, Citizens Financial Group relies heavily on Service Charges and Fees ($417M) and Card Fees ($362M), indicating concentration risk. USB’s broad portfolio signals ecosystem lock-in and infrastructure dominance, while CFG’s narrower segmentation could amplify vulnerability to market shifts.
Strengths and Weaknesses Comparison
This table compares the strengths and weaknesses of U.S. Bancorp and Citizens Financial Group, Inc.:
U.S. Bancorp Strengths
- Strong net margin at 17.68%
- Favorable PE of 10.95 and PB of 1.27
- High current and quick ratios at 2.73
- Diverse revenue streams including wealth management and payment services
- Solid dividend yield at 3.79%
- Favorable debt-to-assets ratio at 11.26%
Citizens Financial Group Strengths
- Favorable net margin at 16.42%
- Lower debt-to-equity at 0.43 and debt-to-assets at 4.98%
- Favorable PE of 13.76 and PB below 1 at 0.96
- Stable quick ratio at 1.04
- Favorable fixed asset turnover at 12.18
- Consistent revenue from commercial and consumer banking
U.S. Bancorp Weaknesses
- Unfavorable ROIC at 11.14% below WACC at 11.59%
- Elevated debt-to-equity at 1.2
- Interest coverage below 1 at 0.66 signals risk
- Low asset turnover at 0.06 despite favorable fixed asset turnover
- Neutral ROE at 11.62%
- Negative treasury and corporate support segment in 2024
Citizens Financial Group Weaknesses
- Low ROE at 6.96% and ROIC at 4.25%, both unfavorable
- WACC at 14.07% exceeds ROIC
- Interest coverage at 0.61 below safety threshold
- Asset turnover low at 0.05
- Current ratio barely above 1 at 1.04, neutral
- Limited geographical diversification with no reported global segments
U.S. Bancorp shows strengths in profitability and liquidity with more diversified revenue streams. Citizens Financial Group demonstrates stronger leverage metrics but faces challenges in capital efficiency and geographical diversification. Both companies carry risks related to interest coverage and asset utilization that could influence strategic priorities.
The Moat Duel: Analyzing Competitive Defensibility
A structural moat is the only lasting shield that protects profits from relentless competitive erosion in the banking sector:
U.S. Bancorp: Growing Profitability Amid Value Challenges
U.S. Bancorp’s moat stems from its scale and diversified service network, enabling stable margins and improving ROIC despite currently shedding value. New digital products could deepen this advantage in 2026.
Citizens Financial Group, Inc.: Struggling Profitability with Narrow Moat
Citizens relies more on cost efficiency and regional presence but faces declining ROIC and value destruction. Its smaller footprint limits competitive resilience, though targeted commercial banking could offer growth opportunities.
Scale and Profitability vs. Regional Cost Efficiency
U.S. Bancorp possesses a deeper moat with improving profitability trends despite value erosion. Citizens faces a sharper decline in ROIC and weaker competitive positioning. U.S. Bancorp is better equipped to defend market share in 2026.
Which stock offers better returns?
Over the past 12 months, both U.S. Bancorp and Citizens Financial Group, Inc. showed strong price appreciation with acceleration, reflecting robust trading dynamics and buyer dominance in recent periods.
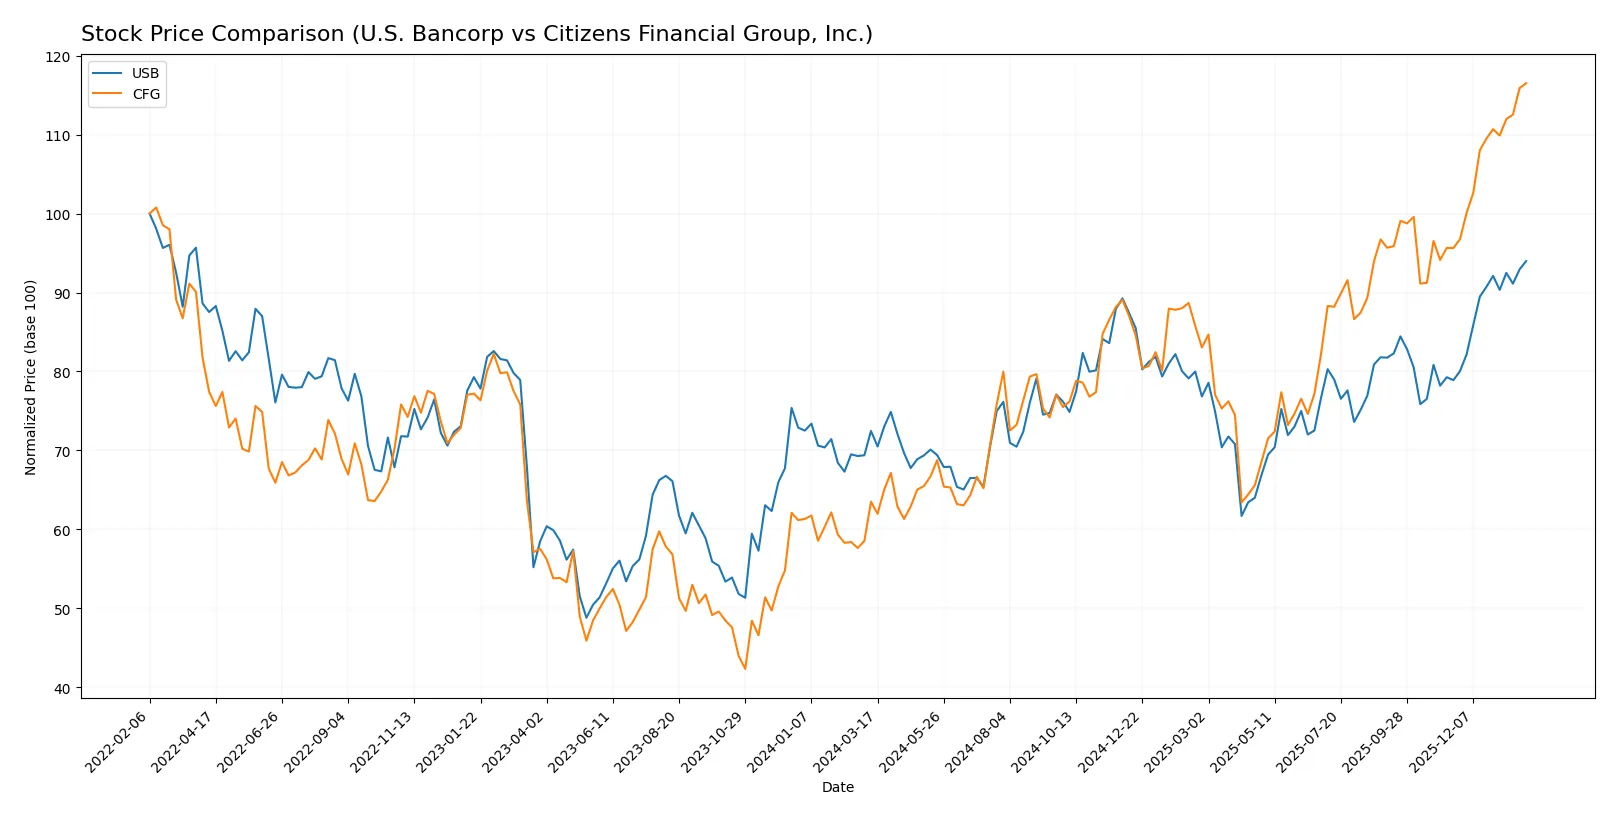
Trend Comparison
U.S. Bancorp’s stock rose 29.7% over the past year, marking a bullish trend with price acceleration. It traded between 36.83 and 56.11, showing moderate volatility (4.33% std deviation).
Citizens Financial Group, Inc. surged 83.51% in the same period, also bullish and accelerating. Its price ranged from 33.14 to 62.98 with higher volatility (7.49% std deviation).
Citizens Financial Group, Inc. outperformed U.S. Bancorp, delivering the highest market returns and stronger recent upward momentum.
Target Prices
Analysts show a positive outlook with target prices well above current trading levels for these regional banks.
| Company | Target Low | Target High | Consensus |
|---|---|---|---|
| U.S. Bancorp | 50 | 65 | 58.13 |
| Citizens Financial Group, Inc. | 60 | 80 | 69.46 |
The target consensus for U.S. Bancorp sits about 3.7% above its current price of 56.11, signaling moderate upside. Citizens Financial Group’s consensus target exceeds its 62.98 share price by nearly 10%, indicating stronger growth expectations.

Don’t Let Luck Decide Your Entry Point
Optimize your entry points with our advanced ProRealTime indicators. You’ll get efficient buy signals with precise price targets for maximum performance. Start outperforming now!
How do institutions grade them?
U.S. Bancorp Grades
The following table summarizes recent institutional grades for U.S. Bancorp:
| Grading Company | Action | New Grade | Date |
|---|---|---|---|
| Argus Research | maintain | Buy | 2026-01-22 |
| TD Cowen | maintain | Buy | 2026-01-21 |
| Keefe, Bruyette & Woods | maintain | Market Perform | 2026-01-21 |
| Oppenheimer | maintain | Outperform | 2026-01-21 |
| DA Davidson | maintain | Buy | 2026-01-21 |
| Truist Securities | maintain | Hold | 2026-01-21 |
| RBC Capital | maintain | Outperform | 2026-01-21 |
| TD Cowen | maintain | Buy | 2026-01-07 |
| Wolfe Research | downgrade | Peer Perform | 2026-01-07 |
| Barclays | maintain | Overweight | 2026-01-05 |
Citizens Financial Group, Inc. Grades
Below are the most recent institutional grades for Citizens Financial Group, Inc.:
| Grading Company | Action | New Grade | Date |
|---|---|---|---|
| Truist Securities | maintain | Hold | 2026-01-26 |
| Citigroup | maintain | Buy | 2026-01-26 |
| Argus Research | maintain | Buy | 2026-01-23 |
| RBC Capital | maintain | Outperform | 2026-01-22 |
| B of A Securities | maintain | Buy | 2026-01-22 |
| Morgan Stanley | maintain | Overweight | 2026-01-22 |
| Keefe, Bruyette & Woods | maintain | Outperform | 2026-01-22 |
| DA Davidson | maintain | Buy | 2026-01-22 |
| TD Cowen | maintain | Buy | 2026-01-22 |
| Raymond James | downgrade | Outperform | 2026-01-07 |
Which company has the best grades?
Citizens Financial Group shows a higher concentration of “Buy” and “Outperform” grades compared to U.S. Bancorp. This suggests stronger institutional confidence, potentially affecting investor sentiment and stock momentum more favorably for Citizens.
Risks specific to each company
The following categories identify critical pressure points and systemic threats facing both firms in the 2026 market environment:
1. Market & Competition
U.S. Bancorp
- Larger market cap (87B) offers scale advantages but faces intense regional bank competition.
Citizens Financial Group, Inc.
- Smaller scale (27B) limits market reach but focuses on niche regional strategies.
2. Capital Structure & Debt
U.S. Bancorp
- Higher debt-to-equity ratio (1.2) signals increased leverage risk. Interest coverage below 1 is a red flag.
Citizens Financial Group, Inc.
- Lower debt-to-equity (0.43) indicates more conservative financial leverage but similar weak interest coverage.
3. Stock Volatility
U.S. Bancorp
- Beta of 1.09 shows moderate sensitivity to market swings, aligned with sector norms.
Citizens Financial Group, Inc.
- Beta 1.086 reflects comparable market risk; slightly higher price range volatility.
4. Regulatory & Legal
U.S. Bancorp
- Operating in multiple states increases regulatory complexity and compliance costs.
Citizens Financial Group, Inc.
- Regional footprint reduces regulatory complexity but exposes it to localized policy risks.
5. Supply Chain & Operations
U.S. Bancorp
- Extensive branch and ATM network boosts customer access but raises operational costs.
Citizens Financial Group, Inc.
- Smaller branch network limits operational scale but offers leaner cost structure.
6. ESG & Climate Transition
U.S. Bancorp
- Larger size demands stronger ESG protocols; failure to meet expectations could impact reputation.
Citizens Financial Group, Inc.
- Smaller firm may find ESG compliance more manageable but risks lagging in green initiatives.
7. Geopolitical Exposure
U.S. Bancorp
- National footprint exposes it to broad U.S. economic and political shifts.
Citizens Financial Group, Inc.
- Concentrated regional presence limits exposure but increases vulnerability to local economic downturns.
Which company shows a better risk-adjusted profile?
The most impactful risk for U.S. Bancorp is its high leverage and weak interest coverage, signaling potential financial strain despite its scale. For Citizens Financial, the key risk lies in lower profitability and exposure to regional economic shifts. Both firms face distress-zone bankruptcy risk per Altman Z-scores, but Citizens’ stronger Piotroski score suggests better financial health. Overall, Citizens Financial shows a slightly better risk-adjusted profile due to more conservative leverage and stronger financial strength metrics, even though its market position is smaller. This nuanced balance highlights the need for vigilance on leverage for USB and profitability improvement for CFG.
Final Verdict: Which stock to choose?
U.S. Bancorp’s superpower lies in its resilient operational efficiency and solid dividend yield, making it a consistent cash generator. Its point of vigilance is the slightly unfavorable capital allocation, which could pressure value creation. It suits portfolios focused on steady income and moderate growth.
Citizens Financial Group, Inc. boasts a strategic moat through its leaner balance sheet and stronger recent price acceleration. Its lower leverage offers relative safety compared to USB. This stock could fit well within a GARP portfolio, balancing growth potential with reasonable valuation.
If you prioritize steady cash flow and income, U.S. Bancorp is the compelling choice due to its operational consistency and dividend yield. However, if you seek growth with better price momentum and a cleaner balance sheet, Citizens Financial Group offers superior upside potential, albeit with higher risk.
Disclaimer: Investment carries a risk of loss of initial capital. The past performance is not a reliable indicator of future results. Be sure to understand risks before making an investment decision.
Go Further
I encourage you to read the complete analyses of U.S. Bancorp and Citizens Financial Group, Inc. to enhance your investment decisions: