Home > Comparison > Financial Services > PNC vs CFG
The strategic rivalry between The PNC Financial Services Group, Inc. and Citizens Financial Group, Inc. shapes the regional banking sector’s evolution. PNC operates as a diversified financial services powerhouse with extensive branch networks and asset management capabilities. Citizens Financial focuses on streamlined consumer and commercial banking with a growing digital footprint. This comparison hinges on contrasting scale and operational breadth. I will assess which model offers a superior risk-adjusted return for diversified investors in 2026.
Table of contents
Companies Overview
The PNC Financial Services Group and Citizens Financial Group dominate the U.S. regional banking landscape with distinct scale and strategies.
The PNC Financial Services Group, Inc.: Diversified Financial Powerhouse
The PNC Financial Services Group stands as a diversified financial services leader with a $87B market cap. It generates revenue through retail banking, corporate & institutional banking, and asset management. In 2026, PNC emphasizes expanding digital channels while reinforcing its extensive branch and ATM network, aiming to blend traditional banking with innovative customer experiences.
Citizens Financial Group, Inc.: Focused Regional Bank
Citizens Financial Group operates as a regional bank with $27B market cap focusing on consumer and commercial banking. Its revenue streams include deposit products, loans, wealth management, and treasury services. In 2026, Citizens pushes digital deposit growth and commercial banking solutions, targeting efficiency across its 1,200 branches and national offices.
Strategic Collision: Similarities & Divergences
Both banks compete fiercely in retail and commercial banking, yet PNC’s broad diversified model contrasts with Citizens’ focused regional approach. PNC leans on scale and variety, while Citizens prioritizes tailored commercial services and digital deposit innovation. Their investment profiles differ sharply: PNC appeals to those favoring breadth and technology integration, Citizens to investors valuing regional specialization and operational efficiency.
Income Statement Comparison
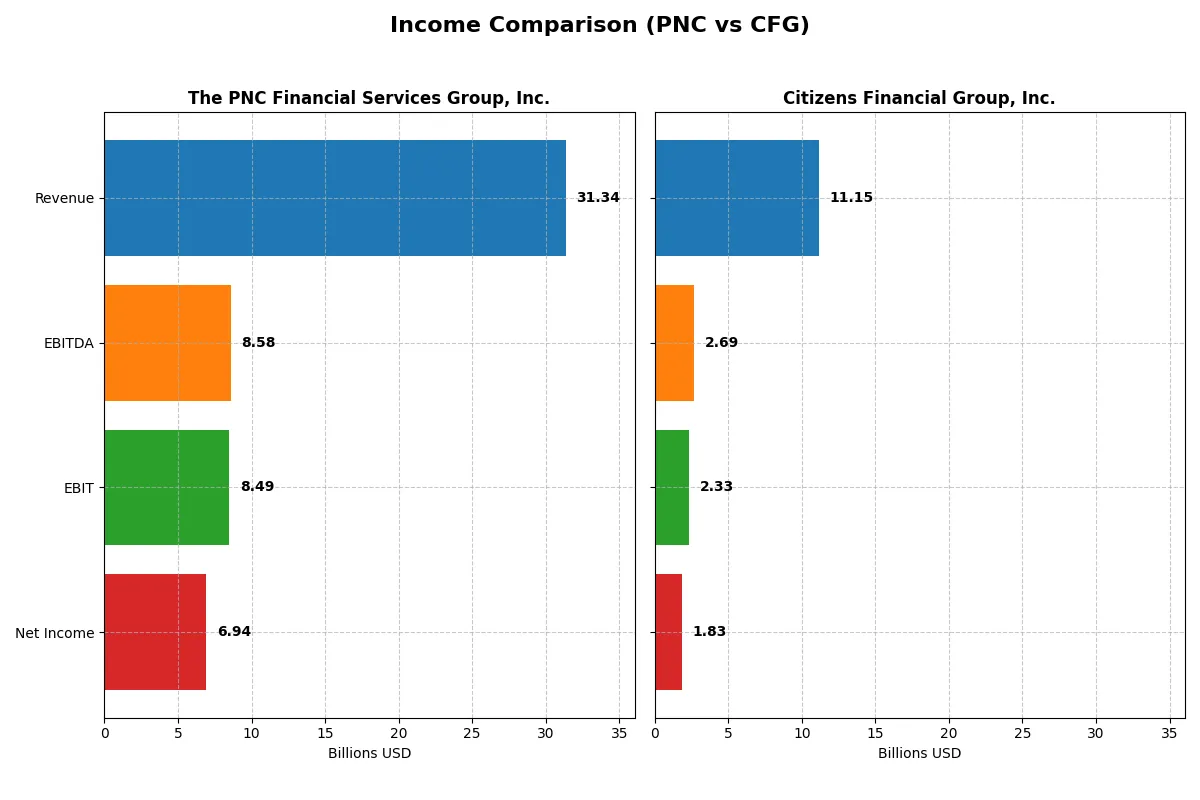
This data dissects the core profitability and scalability of both corporate engines to reveal who dominates the bottom line:
| Metric | The PNC Financial Services Group, Inc. (PNC) | Citizens Financial Group, Inc. (CFG) |
|---|---|---|
| Revenue | 31.3B | 11.1B |
| Cost of Revenue | 8.9B | 3.4B |
| Operating Expenses | 13.9B | 5.4B |
| Gross Profit | 22.5B | 7.8B |
| EBITDA | 8.6B | 2.7B |
| EBIT | 8.5B | 2.3B |
| Interest Expense | 10.9B | 3.8B |
| Net Income | 6.9B | 1.8B |
| EPS | 16.62 | 3.90 |
| Fiscal Year | 2025 | 2025 |
Income Statement Analysis: The Bottom-Line Duel
This income statement comparison reveals the true efficiency and profit dynamics of PNC and Citizens Financial Group’s corporate engines.
The PNC Financial Services Group, Inc. Analysis
PNC’s revenue grew from 20B in 2021 to a peak of 33.7B in 2024 before declining to 31.3B in 2025. Net income steadily increased over five years, reaching 6.9B in 2025. The company sustains a strong gross margin above 70% and a net margin of 22.1% in 2025, reflecting robust profitability and improving operational efficiency despite a slight revenue dip.
Citizens Financial Group, Inc. Analysis
CFG’s revenue expanded from 7B in 2021 to 12.3B in 2024 but fell to 11.1B in 2025. Net income peaked earlier then declined, posting 1.8B in 2025. The firm maintains a healthy gross margin near 70% but a lower net margin of 16.4%. Recent margin improvements contrast with overall net income contraction over the period, indicating mixed momentum and margin pressure.
Margin Strength vs. Earnings Resilience
PNC outperforms CFG with higher profitability and more consistent net income growth. While both faced revenue declines in 2025, PNC’s superior margins and 26.6% net margin growth over one year mark clear fundamental strength. Investors seeking resilient earnings and margin power would find PNC’s profile more attractive than CFG’s uneven income trajectory.
Financial Ratios Comparison
These vital ratios act as a diagnostic tool to expose the underlying fiscal health, valuation premiums, and capital efficiency of the companies analyzed:
| Ratios | The PNC Financial Services Group, Inc. (PNC) | Citizens Financial Group, Inc. (CFG) |
|---|---|---|
| ROE | 11.45% | 6.96% |
| ROIC | 7.65% | 4.25% |
| P/E | 11.86 | 13.76 |
| P/B | 1.36 | 0.96 |
| Current Ratio | 0.81 | 1.04 |
| Quick Ratio | 0.81 | 1.04 |
| D/E | 0.94 | 0.43 |
| Debt-to-Assets | 9.96% | 4.98% |
| Interest Coverage | 0.78 | 0.61 |
| Asset Turnover | 0.055 | 0.049 |
| Fixed Asset Turnover | 0 | 12.18 |
| Payout ratio | 37.49% | 40.52% |
| Dividend yield | 3.16% | 2.94% |
| Fiscal Year | 2025 | 2025 |
Efficiency & Valuation Duel: The Vital Signs
Financial ratios act as a company’s DNA, exposing hidden risks and operational strengths critical for investment decisions.
The PNC Financial Services Group, Inc.
PNC delivers a solid net margin of 22.13% and a neutral ROE of 11.45%, reflecting moderate profitability. The valuation appears attractive with a P/E of 11.86 and P/B at 1.36, indicating the stock is reasonably priced. It rewards shareholders with a 3.16% dividend yield, signaling stable income distribution.
Citizens Financial Group, Inc.
CFG shows a lower net margin at 16.42% and a weaker ROE of 6.96%, suggesting less efficient capital use. Its valuation is slightly higher with a P/E of 13.76 but a competitive P/B of 0.96. The company offers a 2.94% dividend yield, complemented by favorable leverage and asset turnover metrics, supporting steady shareholder returns.
Balanced Valuation Meets Operational Discipline
PNC balances profitability and valuation with a higher dividend yield, while CFG excels in leverage and asset efficiency despite lower returns. Investors seeking income might prefer PNC’s profile, whereas those valuing operational efficiency could lean toward CFG’s favorable ratio mix.
Which one offers the Superior Shareholder Reward?
I compare The PNC Financial Services Group and Citizens Financial Group’s shareholder rewards through dividends and buybacks. PNC yields 3.16% with a 37.5% payout ratio and robust buybacks. CFG offers a 2.94% yield, a 40.5% payout, with modest buybacks historically. PNC’s higher dividend yield and consistent buyback intensity suggest more attractive total returns. CFG’s lower valuation multiples hint at value, but its smaller distribution footprint and higher leverage raise sustainability concerns. I conclude PNC delivers superior shareholder reward in 2026.
Comparative Score Analysis: The Strategic Profile
The radar chart reveals the fundamental DNA and trade-offs of The PNC Financial Services Group, Inc. and Citizens Financial Group, Inc.:
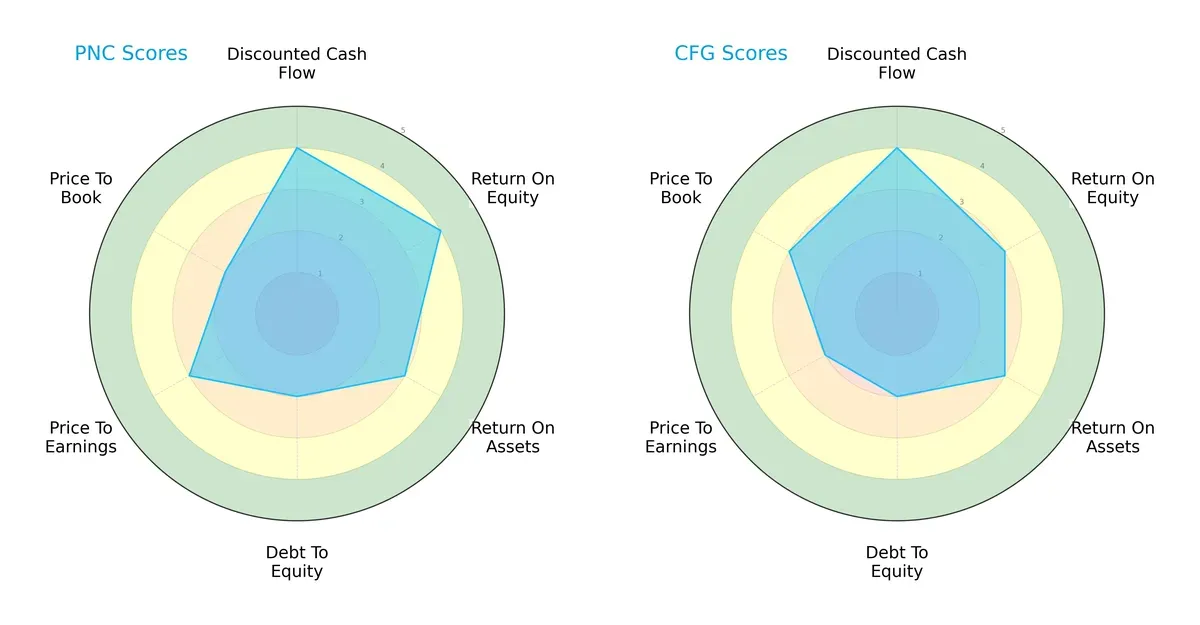
PNC demonstrates stronger returns with higher ROE (4 vs. 3) and a slight edge in ROA (3 vs. 3, equal but paired with better ROE). Both firms share moderate debt-to-equity risk (2 each). PNC’s valuation scores lean more conservative on P/B (2 vs. 3), while CFG shows a lower P/E score (2 vs. 3). Overall, PNC offers a more balanced profile with stronger profitability metrics, whereas CFG’s edge lies in a marginally better price-to-book valuation.
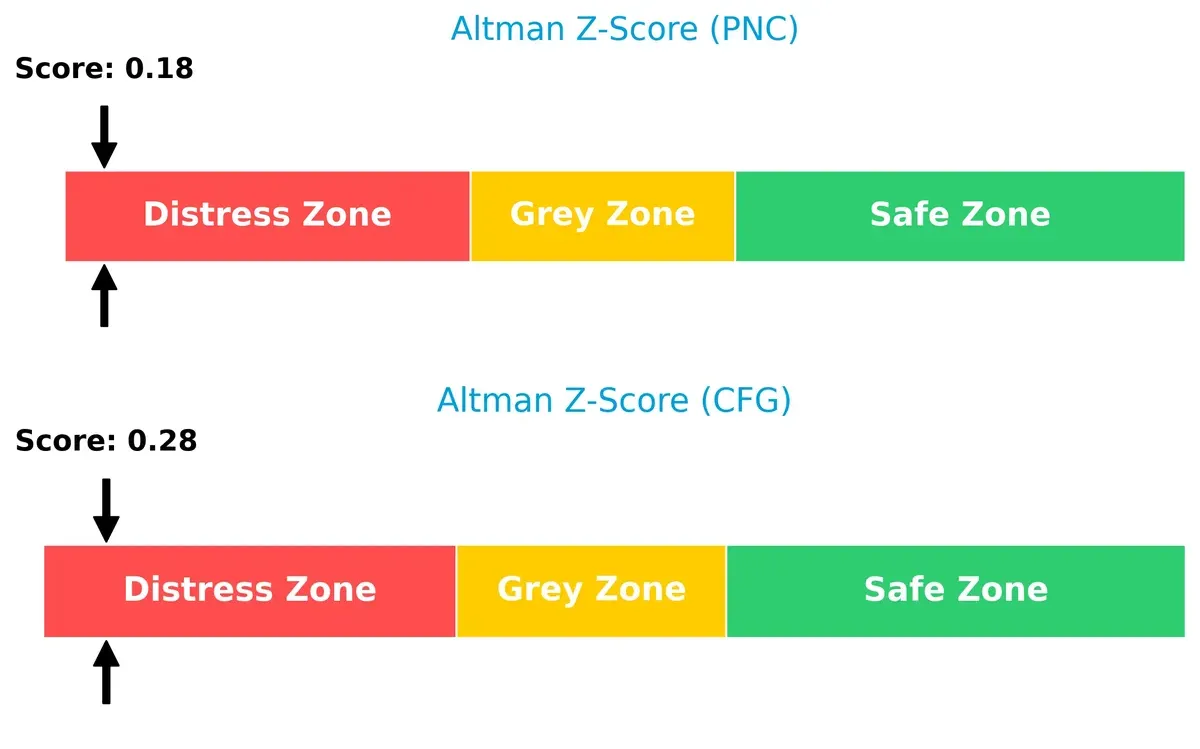
Bankruptcy Risk: Solvency Showdown
Both PNC and CFG reside in the distress zone with Altman Z-Scores of 0.18 and 0.28 respectively, signaling elevated bankruptcy risk in the current economic cycle:
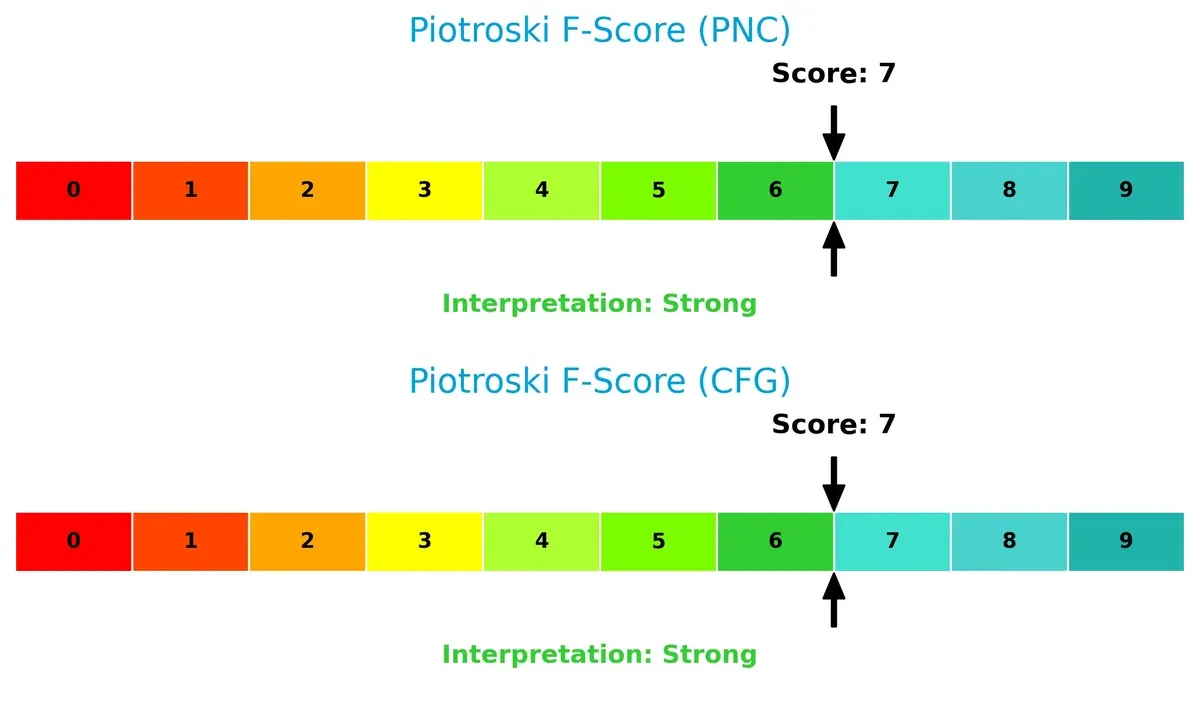
Financial Health: Quality of Operations
PNC and CFG both score a strong 7 on the Piotroski F-Score, indicating solid internal financial health and operational quality with no immediate red flags:
How are the two companies positioned?
This section dissects the operational DNA of PNC and CFG by comparing their revenue distribution and internal dynamics. The goal is to confront their economic moats and identify which business model offers the most resilient, sustainable advantage today.
Revenue Segmentation: The Strategic Mix
This visual comparison dissects how The PNC Financial Services Group, Inc. and Citizens Financial Group, Inc. diversify their income streams and where their primary sector bets lie:
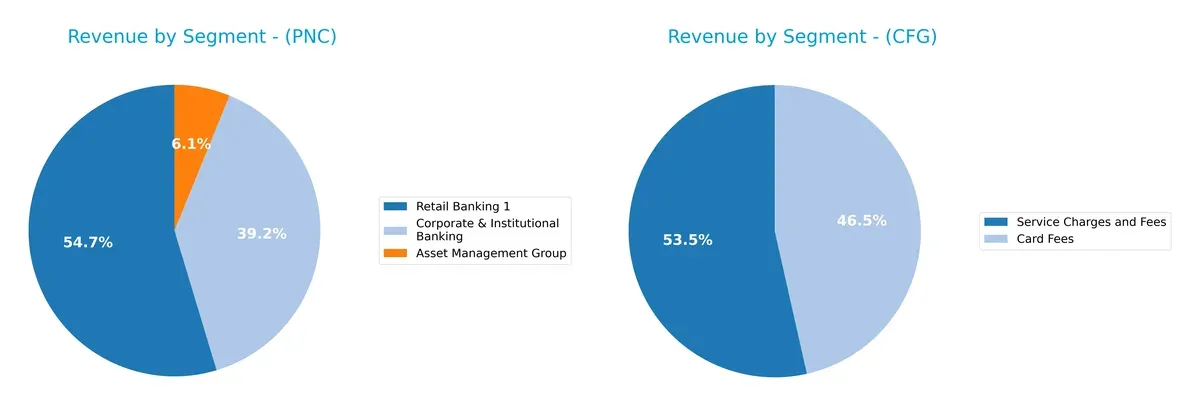
PNC anchors its revenue in three major segments: Retail Banking at $12.9B, Corporate & Institutional Banking at $9.3B, and Asset Management at $1.45B. This mix shows moderate diversification with a strong retail focus, reducing concentration risk. Conversely, CFG’s latest segments pivot around Service Charges and Fees ($417M), Card Fees ($362M), and Trust and Investment Services Fees ($259M), indicating a narrower, fee-based revenue model that may expose it to transactional volume fluctuations. PNC’s broader base suggests a more resilient ecosystem lock-in.
Strengths and Weaknesses Comparison
This table compares the Strengths and Weaknesses of PNC and CFG:
PNC Strengths
- Strong net margin at 22.13%
- Favorable PE and PB ratios indicate valuation appeal
- Lower debt-to-assets ratio at 9.96% supports balance sheet strength
- Solid dividend yield of 3.16% reflects shareholder return focus
CFG Strengths
- Higher percentage of favorable ratios at 57.14%
- Favorable quick ratio and debt-to-equity ratio indicate liquidity and leverage control
- Strong fixed asset turnover at 12.18 shows operational efficiency
- Positive net margin and dividend yield support profitability and income
PNC Weaknesses
- Current ratio below 1 at 0.81 signals potential liquidity risk
- Interest coverage below 1 at 0.78 is concerning for debt servicing
- WACC higher than ROIC suggests value destruction risk
- Low asset turnover ratios indicate inefficient asset use
CFG Weaknesses
- ROE and ROIC are unfavorable reflecting weak profitability efficiency
- Interest coverage below 1 at 0.61 raises debt servicing concerns
- WACC significantly exceeds ROIC, indicating poor capital allocation
- Asset turnover remains low despite favorable fixed asset turnover
PNC shows stronger profitability ratios and shareholder returns but faces liquidity and operational efficiency challenges. CFG presents better liquidity and asset utilization but struggles with profitability metrics and debt servicing. Both companies have areas requiring strategic focus to improve capital efficiency and risk management.
The Moat Duel: Analyzing Competitive Defensibility
A structural moat protects long-term profits from competition erosion. Without it, market share and margins quickly erode:
The PNC Financial Services Group, Inc.: Growing ROIC Amid Value Destruction
PNC’s moat hinges on efficient capital allocation, shown by a rising ROIC trend despite ROIC falling below WACC. This signals improving profitability but ongoing value destruction. New products and digital expansion could deepen its edge in 2026.
Citizens Financial Group, Inc.: Declining ROIC and Shrinking Value
Citizens relies on scale and branch network but suffers a sharp ROIC decline and value destruction, unlike PNC’s improving profitability. Market pressures and rising costs threaten its moat, though selective market expansion may offer some relief.
ROIC Resilience vs. Scale Pressure: The Battle for Banking Supremacy
PNC possesses a deeper moat, evidenced by its improving ROIC trend, while Citizens faces a steep decline in capital efficiency. PNC is better positioned to defend its market share amid rising competition and economic challenges.
Which stock offers better returns?
The past year shows strong bullish momentum for both stocks, with significant gains and accelerating upward trends, reflecting robust investor demand and distinct trading volume dynamics.
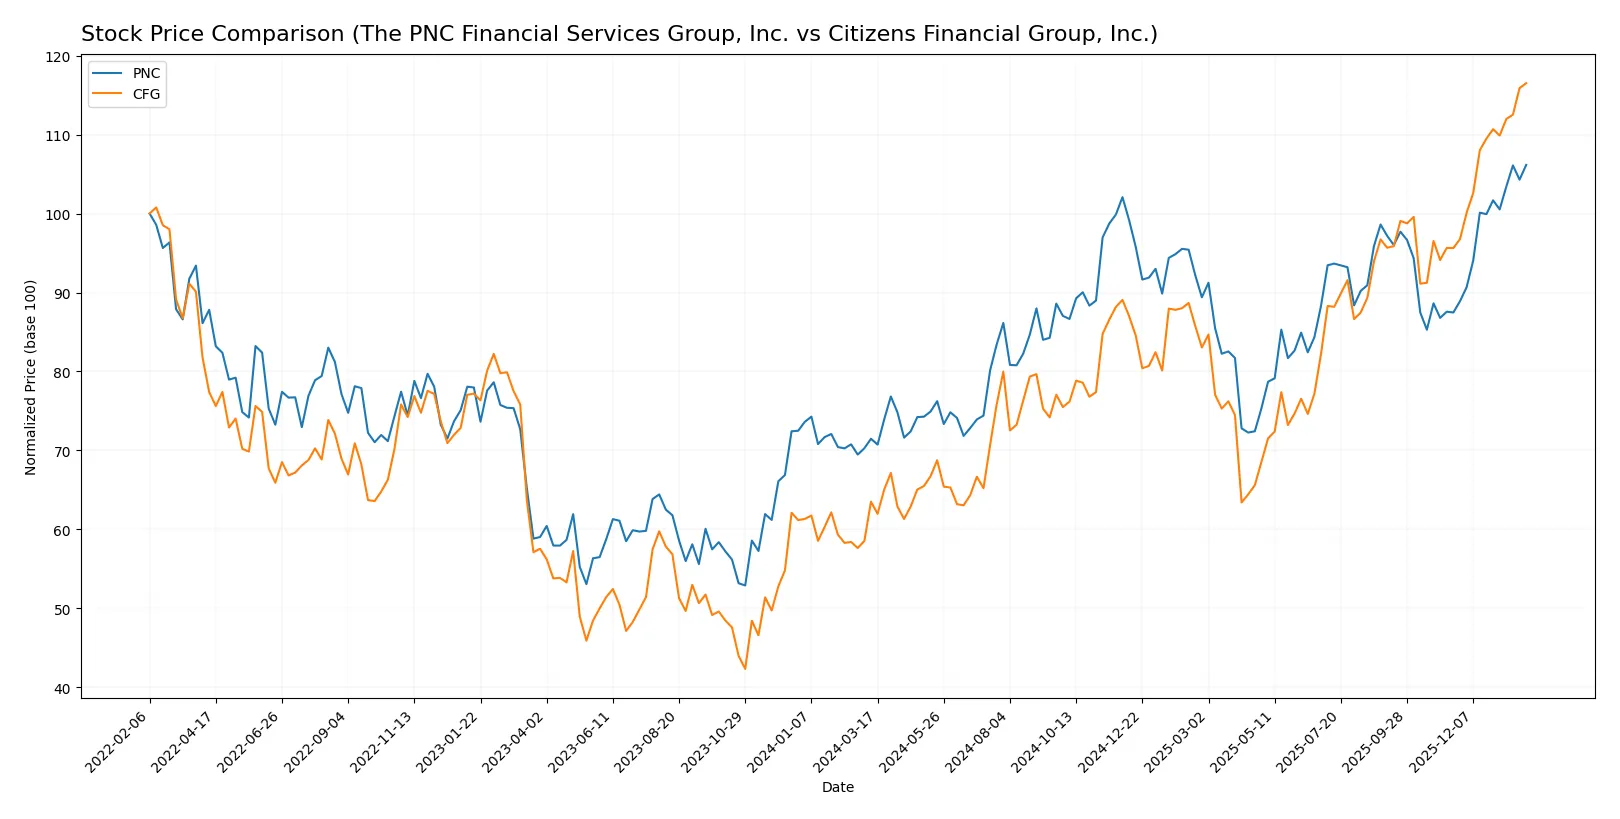
Trend Comparison
The PNC Financial Services Group, Inc. stock rose 48.54% over the past year, showing a bullish trend with accelerating gains and high volatility (std dev 19.63). Its recent 21.37% increase confirms sustained momentum.
Citizens Financial Group, Inc. outperformed with an 83.51% gain, also bullish and accelerating but with lower volatility (std dev 7.49). Its recent 21.84% rise indicates steady continuation of the strong uptrend.
Comparing performance, Citizens Financial Group delivered the highest market gains over the past year, outperforming PNC by a significant margin in total price appreciation.
Target Prices
Analysts present a moderate upside for both The PNC Financial Services Group and Citizens Financial Group.
| Company | Target Low | Target High | Consensus |
|---|---|---|---|
| The PNC Financial Services Group, Inc. | 206 | 284 | 239.1 |
| Citizens Financial Group, Inc. | 60 | 80 | 69.46 |
The PNC consensus target of 239.1 suggests a roughly 7% upside from the current 223.3 price. Citizens Financial’s 69.46 target implies about a 10% gain from 62.98. Both show reasonable growth expectations.

Don’t Let Luck Decide Your Entry Point
Optimize your entry points with our advanced ProRealTime indicators. You’ll get efficient buy signals with precise price targets for maximum performance. Start outperforming now!
How do institutions grade them?
I review the latest institutional grades for The PNC Financial Services Group, Inc. and Citizens Financial Group, Inc.:
The PNC Financial Services Group, Inc. Grades
The following table summarizes recent grades from major grading firms for PNC:
| Grading Company | Action | New Grade | Date |
|---|---|---|---|
| Oppenheimer | maintain | Outperform | 2026-01-20 |
| Wells Fargo | maintain | Overweight | 2026-01-20 |
| Keefe, Bruyette & Woods | maintain | Market Perform | 2026-01-20 |
| RBC Capital | maintain | Outperform | 2026-01-20 |
| TD Cowen | maintain | Buy | 2026-01-20 |
| Morgan Stanley | maintain | Underweight | 2026-01-20 |
| Barclays | maintain | Overweight | 2026-01-05 |
| Truist Securities | maintain | Hold | 2025-12-18 |
Citizens Financial Group, Inc. Grades
This table shows recent institutional grades for Citizens Financial Group:
| Grading Company | Action | New Grade | Date |
|---|---|---|---|
| Truist Securities | maintain | Hold | 2026-01-26 |
| Citigroup | maintain | Buy | 2026-01-26 |
| Argus Research | maintain | Buy | 2026-01-23 |
| RBC Capital | maintain | Outperform | 2026-01-22 |
| B of A Securities | maintain | Buy | 2026-01-22 |
| Morgan Stanley | maintain | Overweight | 2026-01-22 |
| Keefe, Bruyette & Woods | maintain | Outperform | 2026-01-22 |
| DA Davidson | maintain | Buy | 2026-01-22 |
| TD Cowen | maintain | Buy | 2026-01-22 |
| Raymond James | downgrade | Outperform | 2026-01-07 |
Which company has the best grades?
Citizens Financial Group generally holds stronger grades, including multiple “Buy” and “Outperform” ratings. PNC shows mixed opinions, including an “Underweight” from Morgan Stanley. Investors may find Citizens’ ratings reflect higher confidence.
Risks specific to each company
The following categories identify the critical pressure points and systemic threats facing both firms in the 2026 market environment:
1. Market & Competition
The PNC Financial Services Group, Inc.
- Large branch network supports diverse revenue but faces intense regional banking competition.
Citizens Financial Group, Inc.
- Smaller footprint limits scale but benefits from focused regional presence and digital growth.
2. Capital Structure & Debt
The PNC Financial Services Group, Inc.
- Debt-to-equity ratio near 1.0 signals moderate leverage with some financial risk.
Citizens Financial Group, Inc.
- Lower debt-to-equity ratio (0.43) indicates more conservative leverage and stronger balance sheet.
3. Stock Volatility
The PNC Financial Services Group, Inc.
- Beta of 0.99 shows stock moves roughly in line with market volatility.
Citizens Financial Group, Inc.
- Slightly higher beta at 1.09 suggests marginally higher market sensitivity.
4. Regulatory & Legal
The PNC Financial Services Group, Inc.
- Large diversified bank exposed to comprehensive regulatory scrutiny across multiple banking segments.
Citizens Financial Group, Inc.
- Regional bank with regulatory exposure but less complexity than larger peers like PNC.
5. Supply Chain & Operations
The PNC Financial Services Group, Inc.
- Extensive branch and ATM network entails higher operational costs and complexity.
Citizens Financial Group, Inc.
- Smaller branch footprint reduces operational overhead but limits physical customer access.
6. ESG & Climate Transition
The PNC Financial Services Group, Inc.
- Increasing ESG focus required to meet investor expectations and regulatory demands.
Citizens Financial Group, Inc.
- ESG initiatives advancing but lag larger peers in integration and disclosure.
7. Geopolitical Exposure
The PNC Financial Services Group, Inc.
- Primarily domestic operations limit direct geopolitical risks but remain sensitive to US economic policy.
Citizens Financial Group, Inc.
- Similar domestic concentration with limited international exposure, reducing geopolitical uncertainties.
Which company shows a better risk-adjusted profile?
PNC’s most impactful risk lies in its high operational complexity and leverage, increasing vulnerability to economic shocks. CFG’s biggest risk is lower profitability and return on capital despite its stronger balance sheet. CFG’s more favorable leverage and liquidity ratios suggest a better risk-adjusted profile. Notably, both firms’ Altman Z-scores remain in the distress zone, signaling ongoing financial fragility despite solid Piotroski scores, which highlights the importance of cautious risk management.
Final Verdict: Which stock to choose?
The PNC Financial Services Group stands out as a cash-generating engine with a robust net margin and growing profitability despite value destruction signs. Its main point of vigilance is a persistently low current ratio, signaling liquidity risks. PNC suits investors targeting aggressive growth with a tolerance for operational leverage.
Citizens Financial Group commands a strategic moat through conservative capital structure and superior balance sheet health, providing a safer harbor amid market volatility. Its moderate profitability and favorable valuations make it attractive for Growth at a Reasonable Price (GARP) investors seeking stability alongside growth potential.
If you prioritize aggressive growth fueled by improving profitability, PNC is the compelling choice due to its strong income statement momentum and bullish price trends. However, if you seek better financial stability and a more conservative risk profile, Citizens Financial offers superior balance sheet strength and a favorable valuation backdrop. Both present analytical scenarios suited to distinct investor profiles rather than a one-size-fits-all verdict.
Disclaimer: Investment carries a risk of loss of initial capital. The past performance is not a reliable indicator of future results. Be sure to understand risks before making an investment decision.
Go Further
I encourage you to read the complete analyses of The PNC Financial Services Group, Inc. and Citizens Financial Group, Inc. to enhance your investment decisions: