Home > Comparison > Financial Services > WFC vs C
The strategic rivalry between Wells Fargo & Company and Citigroup Inc. shapes the Financial Services sector’s competitive landscape. Wells Fargo operates as a diversified banking powerhouse focused on consumer and commercial finance across multiple segments. In contrast, Citigroup blends global consumer banking with institutional client services, emphasizing international reach. This analysis assesses which firm’s operational model and strategic positioning offer superior risk-adjusted returns for a diversified investment portfolio in today’s evolving market environment.

Table of contents
Companies Overview
Wells Fargo and Citigroup stand as titans in the diversified banking sector, shaping financial services domestically and globally.
Wells Fargo & Company: Diverse U.S. Financial Powerhouse
Wells Fargo dominates the U.S. diversified banking market, generating revenue through four segments: consumer banking, commercial banking, corporate and investment banking, and wealth management. Its core engine relies heavily on consumer and commercial lending products. In 2026, Wells Fargo focuses strategically on expanding personalized wealth management and enhancing digital banking solutions to deepen customer engagement.
Citigroup Inc.: Global Banking and Financial Services Leader
Citigroup operates as a diversified financial services holding company with a global footprint in North America, Latin America, Asia, and beyond. It earns revenue mainly through its Global Consumer Banking and Institutional Clients Group segments. The company’s 2026 strategy emphasizes growth in international markets and expanding wholesale banking through technology-driven solutions and diversified credit offerings.
Strategic Collision: Similarities & Divergences
Both firms operate as diversified banks but Wells Fargo emphasizes a strong U.S. consumer and wealth management focus while Citigroup pursues a broad global presence with wholesale banking strength. The primary battleground lies in commercial and investment banking services where each vies for institutional clients. Wells Fargo presents a more domestically rooted investment profile; Citigroup offers a riskier but potentially higher-reward global exposure.
Income Statement Comparison
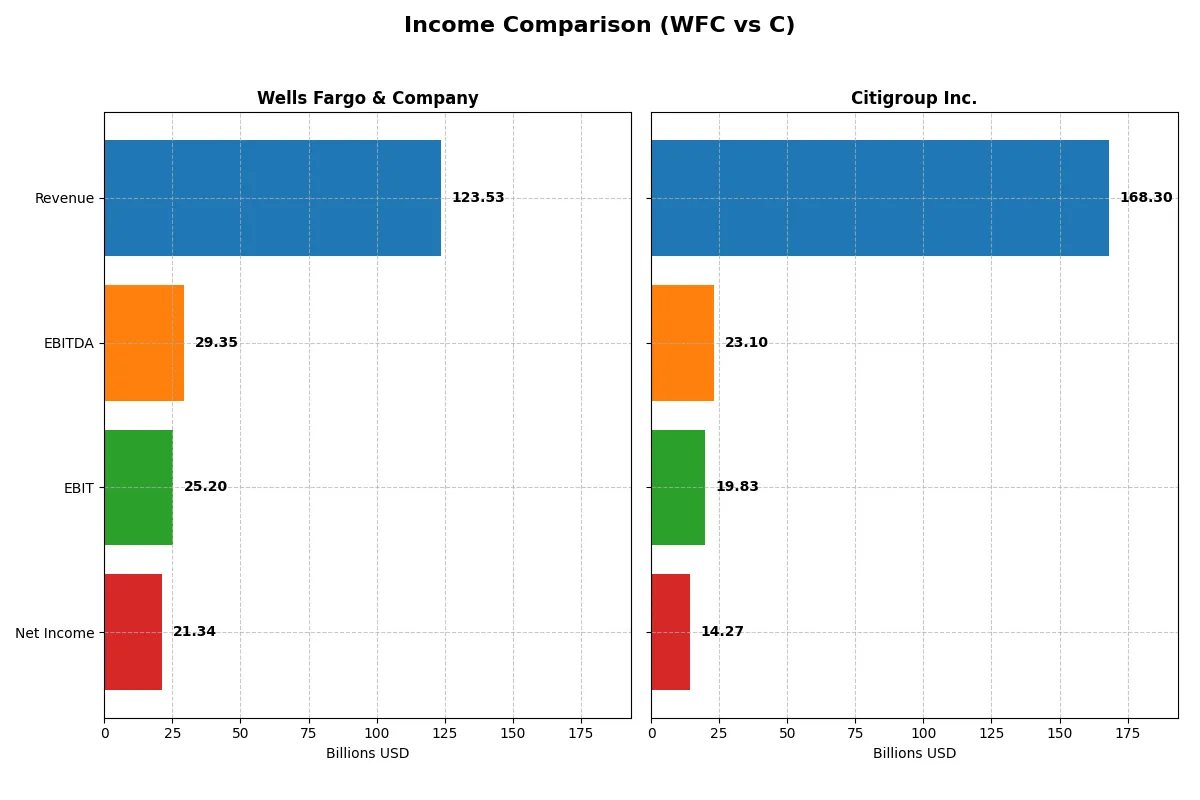
This data dissects the core profitability and scalability of both corporate engines to reveal who dominates the bottom line:
| Metric | Wells Fargo & Company (WFC) | Citigroup Inc. (C) |
|---|---|---|
| Revenue | 123.5B | 168.3B |
| Cost of Revenue | 43.5B | 93.3B |
| Operating Expenses | 54.8B | 55.2B |
| Gross Profit | 80.0B | 74.9B |
| EBITDA | 29.3B | 23.1B |
| EBIT | 25.2B | 19.8B |
| Interest Expense | 39.8B | 83.1B |
| Net Income | 21.3B | 14.3B |
| EPS | 6.39 | 7.23 |
| Fiscal Year | 2025 | 2025 |
Income Statement Analysis: The Bottom-Line Duel
This income statement comparison reveals which company operates its financial engine with greater efficiency and momentum over recent years.
Wells Fargo & Company Analysis
Wells Fargo’s revenue rose from 83B in 2021 to 124B in 2025, showing solid growth, though slightly declining last year. Its gross margin holds strong at 64.8%, indicating robust cost control. Net income advanced to 21B in 2025 with a healthy net margin of 17.3%, reflecting improving profitability and operational momentum despite some pressure on interest expenses.
Citigroup Inc. Analysis
Citigroup’s revenue more than doubled from 79B in 2021 to 168B in 2025, demonstrating impressive top-line expansion. However, its gross margin at 44.6% trails Wells Fargo, reflecting higher cost of revenue. Net income reached 14B in 2025 with an 8.5% net margin, indicating less efficient bottom-line conversion despite favorable recent EBIT and net margin growth.
Margin Strength vs. Revenue Growth
Wells Fargo leads in profitability margins and net income efficiency, while Citigroup excels in revenue scale and growth. Wells Fargo’s higher margins and better net income momentum position it as the more fundamentally sound operator. Investors focused on margin resilience and earnings quality may find Wells Fargo’s profile more attractive.
Financial Ratios Comparison
These vital ratios act as a diagnostic tool to expose the underlying fiscal health, valuation premiums, and capital efficiency of Wells Fargo & Company and Citigroup Inc.:
| Ratios | Wells Fargo (WFC) | Citigroup (C) |
|---|---|---|
| ROE | 11.78% | 6.72% |
| ROIC | 6.47% | 0.95% |
| P/E | 13.89 | 14.89 |
| P/B | 1.64 | 1.00 |
| Current Ratio | 13.79 | 0.48 |
| Quick Ratio | 13.79 | 0.48 |
| D/E (Debt/Equity) | 1.07 | 3.37 |
| Debt-to-Assets | 8.98% | 26.94% |
| Interest Coverage | 0.63 | 0.24 |
| Asset Turnover | 0.057 | 0.063 |
| Fixed Asset Turnover | 10.84 | 5.05 |
| Payout Ratio | 25.33% | 29.60% |
| Dividend Yield | 1.82% | 1.99% |
| Fiscal Year | 2025 | 2025 |
Efficiency & Valuation Duel: The Vital Signs
Financial ratios act as the company’s DNA, uncovering hidden risks and operational excellence crucial for investment decisions.
Wells Fargo & Company
Wells Fargo posts a solid 11.78% ROE and a favorable 17.27% net margin, showing decent profitability. Its P/E of 13.89 signals a reasonably priced stock. The 1.82% dividend yield offers consistent shareholder returns, balancing reinvestment needs amid mixed efficiency metrics like a high current ratio and moderate ROIC.
Citigroup Inc.
Citigroup’s profitability trails with a 6.72% ROE and an 8.48% net margin, indicating weaker earnings efficiency. Its P/E at 14.89 is slightly higher but supported by a lower P/B of 1.0. The 1.99% dividend yield provides steady income, though high debt levels and underwhelming ROIC highlight elevated financial risk.
Valuation and Operational Balance: Wells Fargo Edges Ahead
Wells Fargo combines stronger profitability and more balanced valuation metrics than Citigroup, despite some efficiency concerns. Citigroup’s higher leverage and weaker returns suggest higher risk. Investors prioritizing stable earnings and dividends may prefer Wells Fargo’s profile, while risk-tolerant investors might weigh Citigroup’s growth potential.
Which one offers the Superior Shareholder Reward?
I see Wells Fargo (WFC) offers a moderate dividend yield near 1.8% with a payout ratio around 25–32%, showing balanced cash return and reinvestment. Citigroup (C) yields slightly higher, about 2–3.9%, but with a payout ratio close to 30–56%, suggesting less free cash flow cushion. Both banks maintain buyback programs; WFC’s is steadier, supporting total returns sustainably. C’s elevated leverage and volatile cash flow pressure distribution sustainability. I conclude Wells Fargo provides a more attractive and reliable total shareholder return profile for 2026 investors.
Comparative Score Analysis: The Strategic Profile
The radar chart reveals the fundamental DNA and trade-offs of Wells Fargo & Company and Citigroup Inc., highlighting their financial strengths and vulnerabilities:
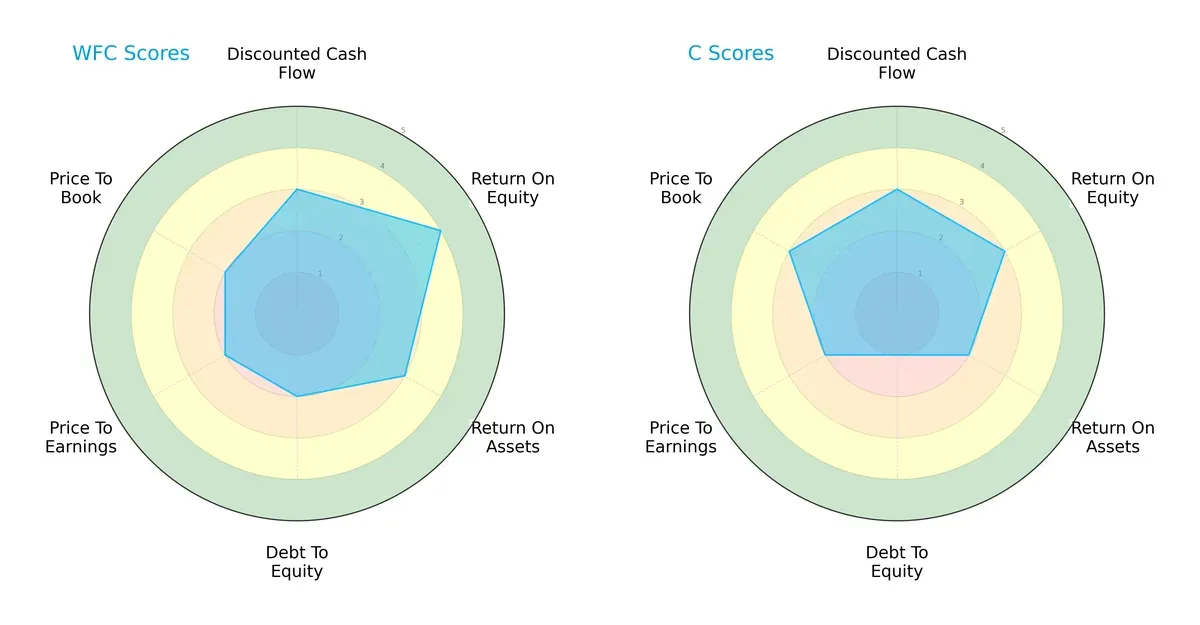
Wells Fargo shows a more balanced profile with superior ROE (4 vs. 3) and ROA (3 vs. 2) scores, indicating stronger profitability and asset efficiency. Citigroup scores lower in debt-to-equity (1 vs. 2), signaling higher financial leverage risk. Valuation metrics are mixed; Citigroup edges out in price-to-book (3 vs. 2), suggesting slightly better market valuation relative to book value. Wells Fargo relies on its operational efficiency, while Citigroup’s profile reflects more risk and valuation variability.
Bankruptcy Risk: Solvency Showdown
Both Wells Fargo (0.46) and Citigroup (-0.11) fall deep in the Altman Z-Score distress zone, implying high bankruptcy risk in the current cycle:
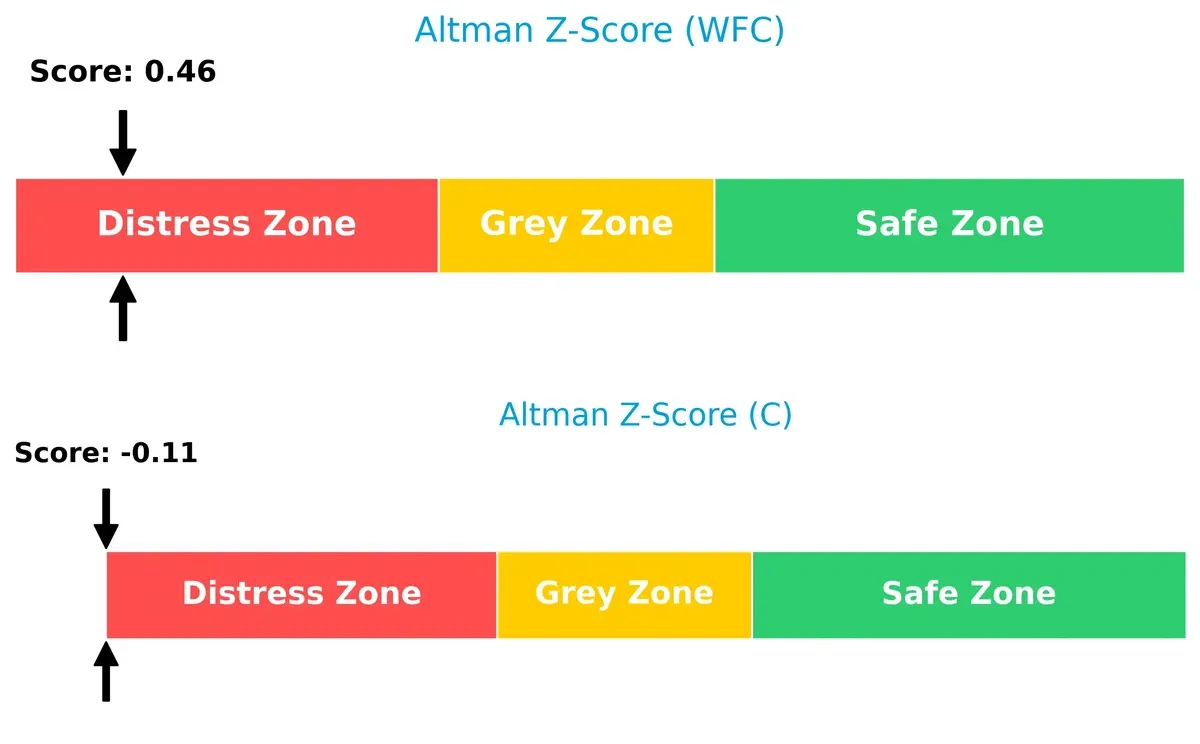
This alarming proximity to financial distress warns investors to approach both stocks cautiously amid ongoing market uncertainties.
Financial Health: Quality of Operations
Wells Fargo and Citigroup share identical Piotroski F-Scores of 5, reflecting average financial health with no clear red flags:
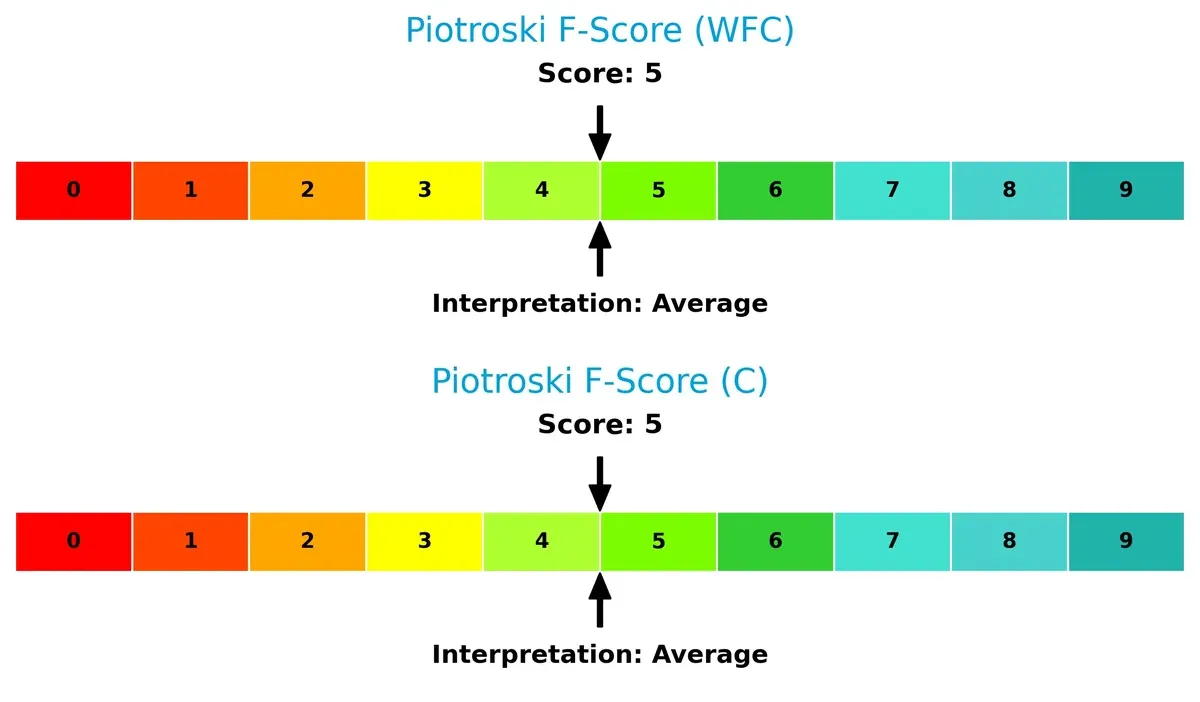
Neither firm demonstrates peak operational strength. Investors should monitor internal metrics closely, as both companies hover at a mid-tier quality level without standout financial robustness.
How are the two companies positioned?
This section dissects Wells Fargo and Citigroup’s operational DNA by comparing their revenue distribution and internal strengths and weaknesses. The goal is to confront their economic moats and identify which model offers the most resilient competitive advantage today.
Revenue Segmentation: The Strategic Mix
The following visual comparison dissects how both firms diversify their income streams and where their primary sector bets lie:
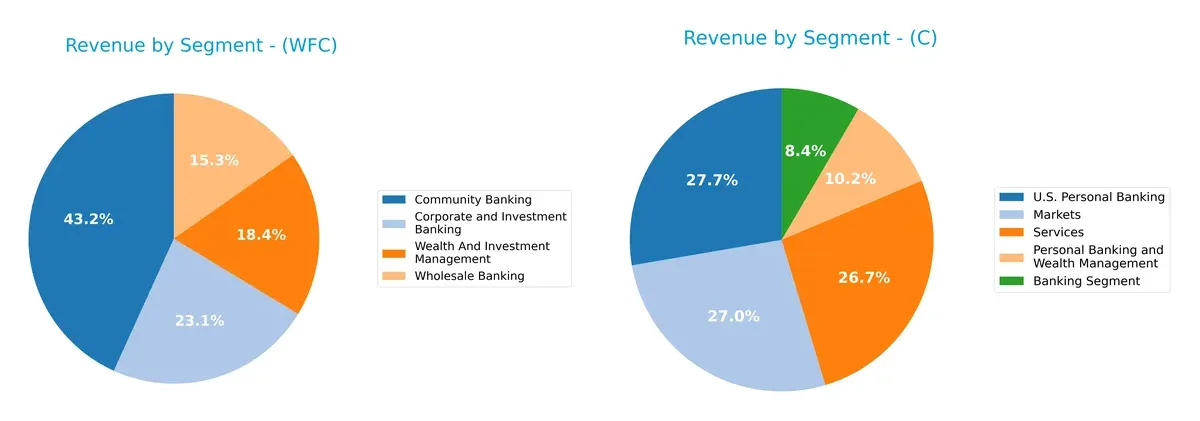
Wells Fargo anchors its revenue in Community Banking with $36.2B, complemented by Corporate & Investment Banking at $19.3B and Wealth Management at $15.4B. This mix shows a balanced but community-focused model. Citigroup pivots on Markets ($19.8B) and Services ($19.6B), alongside U.S. Personal Banking at $20.4B. Citigroup’s more diversified segments reflect a strategy balancing consumer and institutional businesses, while Wells Fargo’s concentration signals stronger ecosystem lock-in but risks tied to retail banking trends.
Strengths and Weaknesses Comparison
This table compares the Strengths and Weaknesses of Wells Fargo & Company and Citigroup Inc.:
WFC Strengths
- Strong profitability with 17.27% net margin
- Favorable P/E of 13.89
- Diverse revenue streams across banking segments
- Solid fixed asset turnover of 10.84
- Low debt-to-assets ratio at 8.98%
C Strengths
- Favorable P/E of 14.89 and P/B of 1.0
- Broad global presence with balanced North America and International revenues
- Diverse segments including markets and services
- Favorable fixed asset turnover of 5.05
- Higher dividend yield at 1.99%
WFC Weaknesses
- Unfavorable weighted average cost of capital at 12.27%
- High current and quick ratios may indicate inefficiencies
- Elevated debt-to-equity at 1.07
- Low interest coverage at 0.63
- Low asset turnover of 0.06
C Weaknesses
- Unfavorable ROE at 6.72% and ROIC at 0.95%
- High debt-to-equity ratio of 3.37
- Weak current and quick ratios at 0.48
- Very low interest coverage of 0.24
- Unfavorable asset turnover of 0.06
Wells Fargo shows stronger profitability and asset efficiency but faces capital cost and leverage risks. Citigroup benefits from global diversification but struggles with profitability and leverage metrics. Both companies exhibit financial challenges that could impact strategic flexibility.
The Moat Duel: Analyzing Competitive Defensibility
A structural moat is the only reliable shield protecting long-term profits from relentless competitive erosion in financial services:
Wells Fargo & Company: Growing ROIC Amid Value Pressure
Wells Fargo’s moat stems from strong brand recognition and diversified banking services, sustaining margin stability despite value destruction. Its improving ROIC trend in 2026 hints at operational recovery and deeper competitive resilience.
Citigroup Inc.: Global Reach Facing Profitability Decline
Citigroup leverages extensive international diversification as its moat, contrasting Wells Fargo’s domestic focus. However, declining ROIC and margin compression challenge its competitive durability, though global expansion efforts may unlock future growth avenues.
Domestic Brand Strength vs. Global Diversification
Wells Fargo possesses a deeper moat with a rising ROIC trend despite current value destruction. Citigroup’s wider geographic footprint struggles with declining profitability. Wells Fargo appears better positioned to defend market share in 2026.
Which stock offers better returns?
The past year shows strong bullish momentum for both Wells Fargo and Citigroup, with notable price acceleration and distinct trading volumes shaping their trajectories.
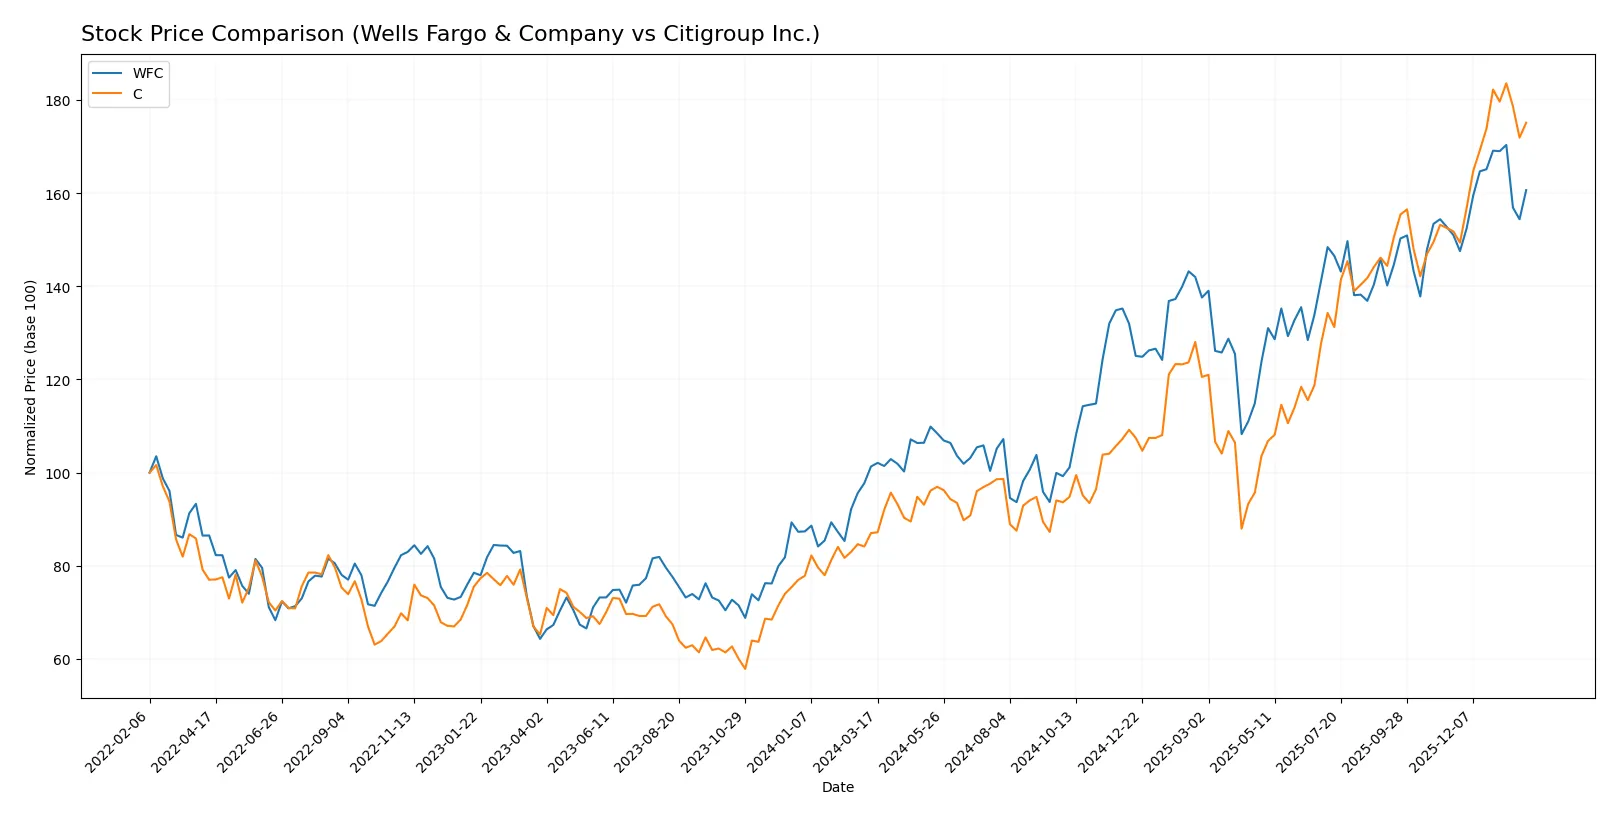
Trend Comparison
Wells Fargo’s stock rose 58.56% over 12 months, showing acceleration and a standard deviation of 11.74. The price ranged from 52.76 to 95.95, confirming a robust bullish trend.
Citigroup’s stock soared 101.2% over the same period with accelerating momentum and higher volatility (std dev 18.09). It hit a low of 57.51 and a peak of 121.32, marking a strong bullish trend.
Citigroup outperformed Wells Fargo with a 101.2% gain versus 58.56%, delivering the highest market return and demonstrating stronger recent trend acceleration.
Target Prices
Analysts present a mixed but constructive target price consensus for Wells Fargo and Citigroup.
| Company | Target Low | Target High | Consensus |
|---|---|---|---|
| Wells Fargo & Company | 74 | 113 | 98.88 |
| Citigroup Inc. | 87 | 150 | 130.55 |
Wells Fargo’s consensus target of 98.88 suggests modest upside from the current 90.49 price. Citigroup’s 130.55 target implies significant potential appreciation above its 115.71 trading level.

Don’t Let Luck Decide Your Entry Point
Optimize your entry points with our advanced ProRealTime indicators. You’ll get efficient buy signals with precise price targets for maximum performance. Start outperforming now!
How do institutions grade them?
Wells Fargo & Company Grades
The following table summarizes recent grades for Wells Fargo from major grading firms:
| Grading Company | Action | New Grade | Date |
|---|---|---|---|
| RBC Capital | Maintain | Outperform | 2026-01-15 |
| Evercore ISI Group | Maintain | Outperform | 2026-01-15 |
| TD Cowen | Maintain | Hold | 2026-01-15 |
| Truist Securities | Maintain | Buy | 2026-01-15 |
| Argus Research | Maintain | Buy | 2026-01-15 |
| TD Cowen | Maintain | Hold | 2026-01-07 |
| Baird | Downgrade | Underperform | 2026-01-06 |
| Truist Securities | Maintain | Buy | 2026-01-06 |
| Barclays | Maintain | Overweight | 2026-01-05 |
| Truist Securities | Maintain | Buy | 2025-12-18 |
Citigroup Inc. Grades
Here are recent grades issued for Citigroup Inc. by leading institutional analysts:
| Grading Company | Action | New Grade | Date |
|---|---|---|---|
| RBC Capital | Maintain | Outperform | 2026-01-15 |
| Morgan Stanley | Maintain | Overweight | 2026-01-15 |
| Oppenheimer | Maintain | Outperform | 2026-01-15 |
| Goldman Sachs | Maintain | Buy | 2026-01-06 |
| Truist Securities | Maintain | Buy | 2026-01-06 |
| Wells Fargo | Maintain | Overweight | 2026-01-05 |
| Barclays | Maintain | Overweight | 2026-01-05 |
| Piper Sandler | Maintain | Overweight | 2025-12-30 |
| Truist Securities | Maintain | Buy | 2025-12-18 |
| Keefe, Bruyette & Woods | Maintain | Outperform | 2025-12-17 |
Which company has the best grades?
Citigroup holds consistently positive ratings with multiple “Outperform” and “Overweight” grades from top analysts. Wells Fargo shows a mixed profile, including a recent downgrade. Investors may see Citigroup’s broader consensus as a stronger endorsement.
Risks specific to each company
The following categories identify critical pressure points and systemic threats facing Wells Fargo & Company and Citigroup Inc. in the 2026 market environment:
1. Market & Competition
Wells Fargo & Company
- Faces intense competition in US retail and commercial banking, leveraging diversified segments.
Citigroup Inc.
- Competes globally with strong presence in emerging markets but faces fierce international rivals.
2. Capital Structure & Debt
Wells Fargo & Company
- Moderate debt-to-equity ratio (1.07), with favorable debt-to-assets but weak interest coverage.
Citigroup Inc.
- High debt-to-equity ratio (3.37) signals elevated financial risk, with poor interest coverage raising red flags.
3. Stock Volatility
Wells Fargo & Company
- Beta of 1.088 indicates slightly above-market volatility; stable price range near 90 USD.
Citigroup Inc.
- Higher beta at 1.166 reflects greater sensitivity to market swings; wider price range up to 124 USD.
4. Regulatory & Legal
Wells Fargo & Company
- Historical regulatory scrutiny remains a concern, requiring ongoing compliance investments.
Citigroup Inc.
- Faces complex regulatory frameworks across multiple jurisdictions, increasing legal and compliance risks.
5. Supply Chain & Operations
Wells Fargo & Company
- Operations heavily US-centric with well-established infrastructure; operational efficiency needs improvement.
Citigroup Inc.
- Global operational footprint exposed to regional disruptions; requires robust risk mitigation.
6. ESG & Climate Transition
Wells Fargo & Company
- ESG initiatives growing but must align faster with investor expectations on climate risks.
Citigroup Inc.
- ESG commitments face challenges due to diverse global operations and regulatory variation.
7. Geopolitical Exposure
Wells Fargo & Company
- Primarily US-focused, limiting geopolitical risk but vulnerable to domestic economic shifts.
Citigroup Inc.
- Broad international presence increases exposure to geopolitical tensions and trade uncertainties.
Which company shows a better risk-adjusted profile?
Wells Fargo’s most impactful risk is its weak interest coverage, signaling vulnerability to rising debt costs despite moderate leverage. Citigroup’s elevated debt-to-equity ratio and poor interest coverage highlight greater financial risk. Wells Fargo shows a better risk-adjusted profile, supported by a more favorable debt structure and lower stock volatility. However, both firms remain in financial distress zones with equal Piotroski scores of 5, underscoring cautious investment approaches.
Final Verdict: Which stock to choose?
Wells Fargo’s superpower lies in its improving profitability and disciplined capital use despite its current value destruction. Its elevated current ratio signals a liquidity anomaly worth monitoring. This stock fits aggressive growth portfolios that can tolerate operational quirks for a potential rebound.
Citigroup’s strategic moat is its operational scale paired with a historically robust cash conversion cycle, though it faces declining returns on invested capital. Its higher leverage and weaker profitability suggest a more cautious stance. It suits investors focused on GARP who prioritize growth potential with a margin of safety.
If you prioritize improving profitability and operational stability, Wells Fargo outshines due to its upward ROIC trend and favorable income metrics. However, if you seek higher growth acceleration and can accept volatility, Citigroup offers superior price momentum but with greater financial risk. Each presents distinct risk-reward profiles for specific investor strategies.
Disclaimer: Investment carries a risk of loss of initial capital. The past performance is not a reliable indicator of future results. Be sure to understand risks before making an investment decision.
Go Further
I encourage you to read the complete analyses of Wells Fargo & Company and Citigroup Inc. to enhance your investment decisions: