Home > Comparison > Financial Services > JPM vs C
The strategic rivalry between JPMorgan Chase & Co. and Citigroup Inc. shapes the financial services sector’s evolution. JPMorgan Chase operates as a diversified banking powerhouse with a broad mix of consumer, corporate, and asset management services. Citigroup leans on a global consumer and institutional banking model, emphasizing international reach. This head-to-head highlights a contest between scale and geographic diversification. This analysis aims to identify which business model offers superior risk-adjusted returns for a balanced portfolio.
Table of contents
Companies Overview
JPMorgan Chase & Co. and Citigroup Inc. stand as titans in the global diversified banking sector.
JPMorgan Chase & Co.: Global Financial Powerhouse
JPMorgan Chase dominates diversified banking with a broad revenue base spanning Consumer & Community Banking, Corporate & Investment Bank, Commercial Banking, and Asset & Wealth Management. In 2026, the firm strategically focuses on expanding digital banking and integrating advanced risk management to maintain its market leadership. Its diversified segments fuel a balanced and resilient earnings profile.
Citigroup Inc.: International Banking Specialist
Citigroup operates as a diversified financial services holding company with a strong presence across North America, Latin America, Asia, Europe, and the Middle East. Its core revenue stems from Global Consumer Banking and Institutional Clients Group, emphasizing retail banking and wholesale services. In 2026, Citigroup targets growth in emerging markets and enhances electronic delivery platforms to broaden customer access.
Strategic Collision: Similarities & Divergences
Both firms pursue diversified banking models but differ in geographic focus and segment emphasis. JPMorgan leans on a multi-segment U.S.-centric approach while Citigroup prioritizes international market penetration and retail expansion. Their primary battleground is global corporate and consumer banking services. JPMorgan’s robust capital allocation contrasts with Citigroup’s growth-driven, emerging market strategy, shaping distinct risk-return investment profiles.
Income Statement Comparison
This data dissects the core profitability and scalability of both corporate engines to reveal who dominates the bottom line:
| Metric | JPMorgan Chase & Co. (JPM) | Citigroup Inc. (C) |
|---|---|---|
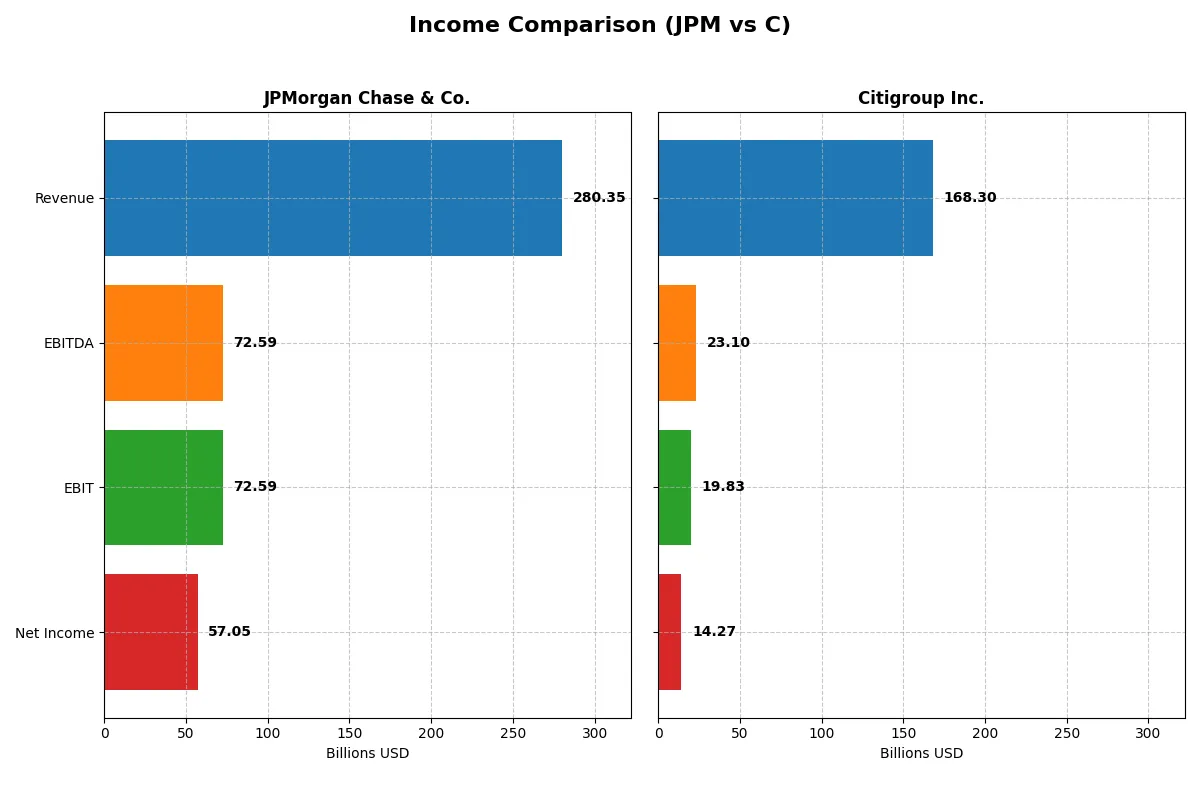
| Revenue | 280.3B | 168.3B |
| Cost of Revenue | 112.1B | 93.3B |
| Operating Expenses | 95.6B | 55.2B |
| Gross Profit | 168.2B | 74.9B |
| EBITDA | 72.6B | 23.1B |
| EBIT | 72.6B | 19.8B |
| Interest Expense | 97.9B | 83.1B |
| Net Income | 57.0B | 14.3B |
| EPS | 20.09 | 7.23 |
| Fiscal Year | 2025 | 2025 |
Income Statement Analysis: The Bottom-Line Duel
This income statement comparison exposes each bank’s operational efficiency and profitability trends over recent years.
JPMorgan Chase & Co. Analysis
JPMorgan Chase’s revenue climbed steadily, reaching $280B in 2025, with net income growing to $57B. Gross and net margins remain robust at 60% and 20%, respectively, reflecting strong cost control. However, a slight dip in EBIT margin and net margin growth indicates some pressure on profitability momentum in the latest year.
Citigroup Inc. Analysis
Citigroup’s revenue peaked at $170B in 2024 but declined slightly to $168B in 2025. Its net income fell to $14B, with net margin at a modest 8.5%. Despite lower revenue growth, EBIT and net margin margins improved in 2025, signaling better operational efficiency but still lagging JPMorgan’s scale and profitability.
Margin Dominance vs. Efficiency Gains
JPMorgan clearly outperforms Citigroup in scale and profitability, boasting higher margins and consistent net income growth. Citigroup shows encouraging margin improvement but struggles with top-line contraction. For investors prioritizing stable, high-margin earnings, JPMorgan’s profile presents a stronger fundamental appeal.
Financial Ratios Comparison
These vital ratios act as a diagnostic tool to expose the underlying fiscal health, valuation premiums, and capital efficiency of the companies analyzed:
| Ratios | JPMorgan Chase & Co. (JPM) | Citigroup Inc. (C) |
|---|---|---|
| ROE | 15.7% | 6.7% |
| ROIC | 1.3% | 0.9% |
| P/E | 15.8 | 14.9 |
| P/B | 2.48 | 1.00 |
| Current Ratio | 14.9 | 0.48 |
| Quick Ratio | 14.9 | 0.48 |
| D/E | 1.38 | 3.37 |
| Debt-to-Assets | 11.3% | 26.9% |
| Interest Coverage | 0.74 | 0.24 |
| Asset Turnover | 0.06 | 0.06 |
| Fixed Asset Turnover | 7.73 | 5.05 |
| Payout ratio | 27.1% | 29.6% |
| Dividend yield | 1.72% | 1.99% |
| Fiscal Year | 2025 | 2025 |
Efficiency & Valuation Duel: The Vital Signs
Ratios act as a company’s DNA, exposing hidden risks and operational excellence behind headline numbers.
JPMorgan Chase & Co.
JPMorgan shows strong profitability with a 15.74% ROE and a robust 20.35% net margin. Its P/E of 15.75 and P/B of 2.48 suggest a fairly valued stock. The bank balances dividends with reinvestment, offering a 1.72% dividend yield while maintaining operational efficiency, despite some leverage and liquidity concerns.
Citigroup Inc.
Citigroup posts weaker profitability, with a 6.72% ROE and an 8.48% net margin. The stock trades at a slightly cheaper P/E of 14.89 and a P/B of 1.0, signaling value appeal. It yields a 1.99% dividend but faces elevated debt levels and liquidity risks, reflecting a stretched capital structure and operational challenges.
Balanced Profitability vs. Value Risks
JPMorgan delivers superior profitability with balanced valuation metrics, while Citigroup offers a cheaper entry but with higher financial risk. Investors seeking operational strength should lean toward JPMorgan; value seekers willing to tolerate risk may consider Citigroup’s discounted profile.
Which one offers the Superior Shareholder Reward?
I compare JPMorgan Chase & Co. (JPM) and Citigroup Inc. (C) on dividends and buybacks. JPM yields 1.7–2.7%, with payout ratios around 25–35%, showing moderate dividend discipline. Citigroup’s yield is higher, 2.0–5.2%, but payout ratios range up to 56%, risking sustainability. JPM’s buyback programs are aggressive, supporting shareholder value via capital return and EPS growth. Citigroup lacks significant buyback activity, relying more on dividends. JPM’s distribution blends steady dividends with active buybacks, balancing income and capital appreciation. Citigroup’s higher yield comes with weaker free cash flow coverage and less share repurchase support. I conclude JPM offers superior total shareholder reward in 2026, combining sustainable dividends and buybacks with robust profitability and capital efficiency.
Comparative Score Analysis: The Strategic Profile
The radar chart reveals the fundamental DNA and trade-offs of JPMorgan Chase & Co. and Citigroup Inc., highlighting their core financial strengths and weaknesses:
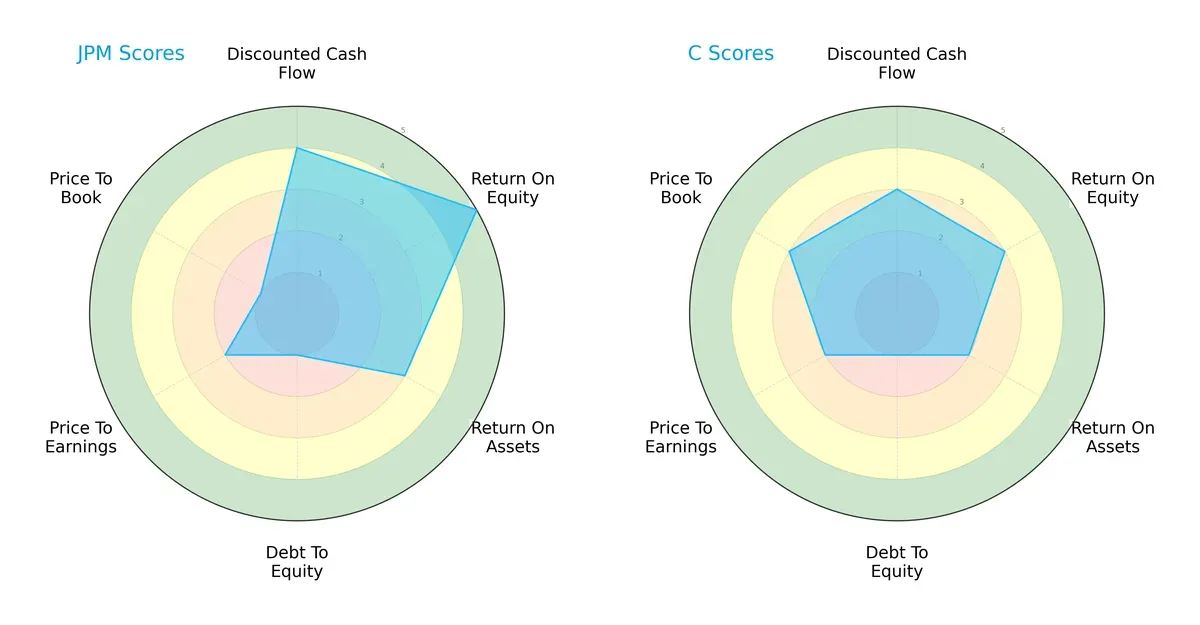
JPMorgan demonstrates superior efficiency with higher ROE (5 vs. 3) and ROA (3 vs. 2) scores, reflecting stronger profitability and asset utilization. Both firms share a very unfavorable debt-to-equity score (1), signaling elevated leverage risk. JPMorgan’s valuation scores lag (P/B 1 vs. 3), suggesting market skepticism despite its operational edge. Citigroup shows a more balanced valuation profile but relies less on profitability to drive value. Overall, JPMorgan holds a more concentrated competitive advantage, while Citigroup offers a steadier, albeit less dynamic, profile.
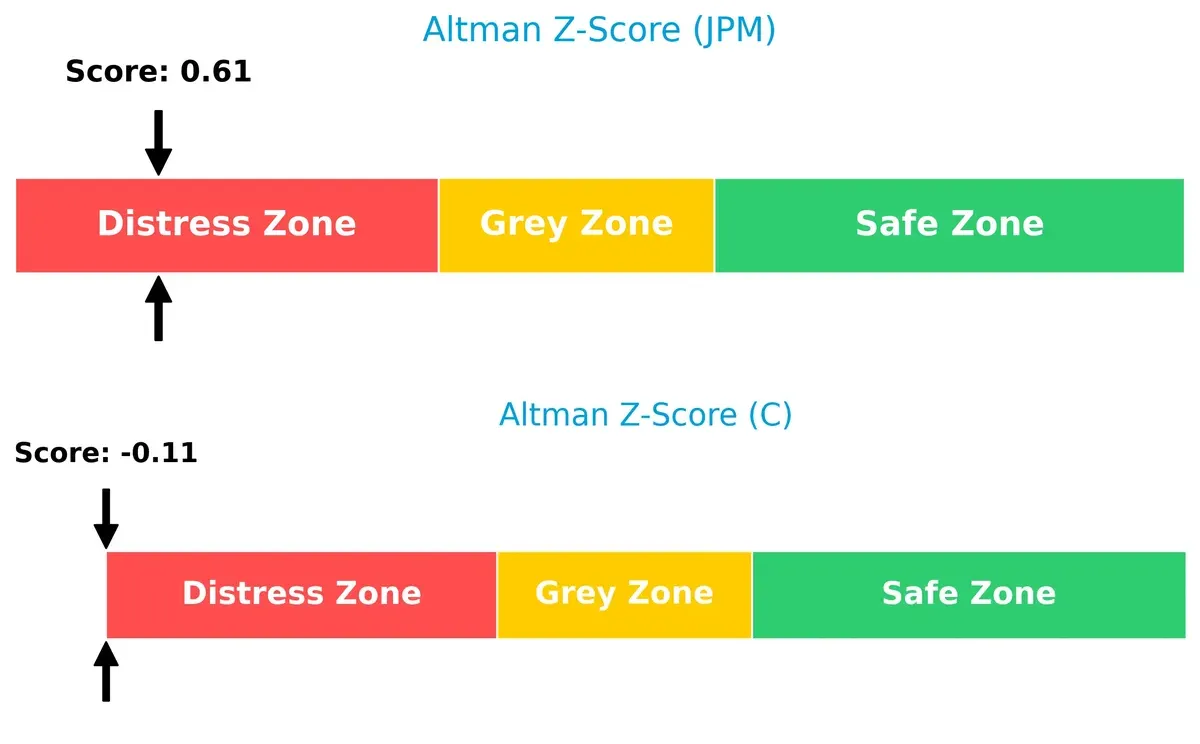
Bankruptcy Risk: Solvency Showdown
JPMorgan’s Altman Z-Score of 0.61 slightly outperforms Citigroup’s -0.11, though both remain in the distress zone, indicating elevated bankruptcy risk in this economic cycle:
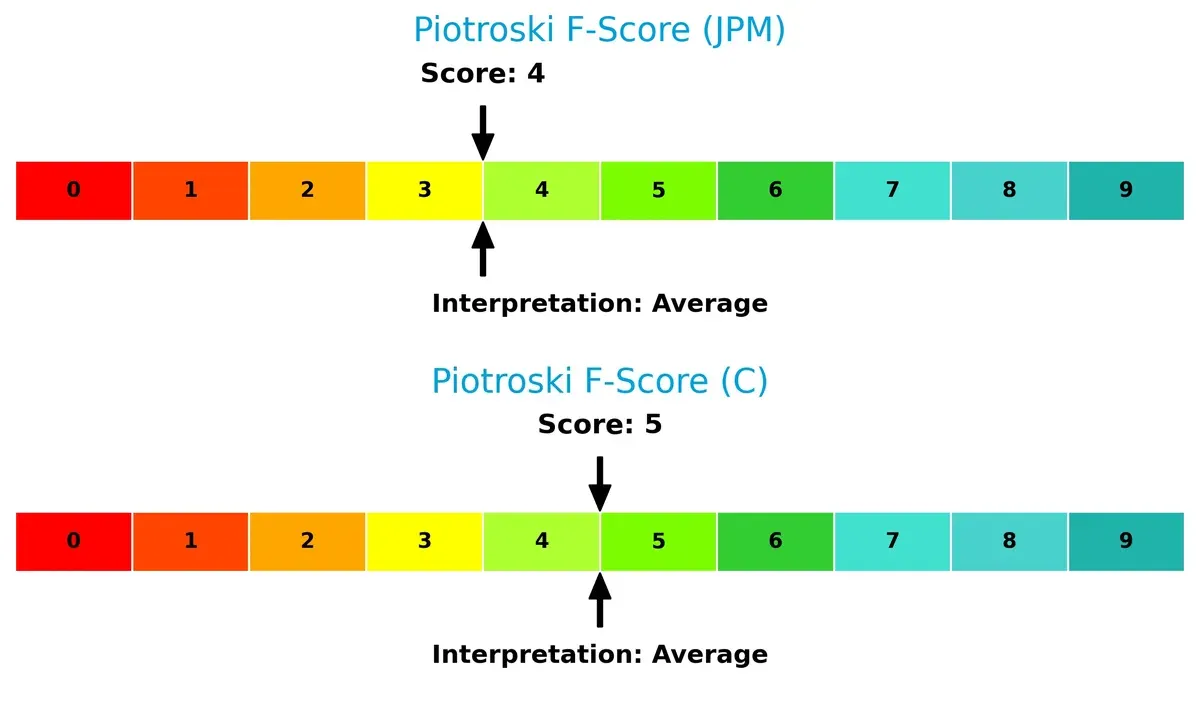
Financial Health: Quality of Operations
JPMorgan and Citigroup have average Piotroski F-Scores of 4 and 5, respectively, reflecting moderate financial health with no clear red flags but also no signs of peak operational strength:
How are the two companies positioned?
This section dissects the operational DNA of JPM and C by comparing revenue distribution by segment alongside internal strengths and weaknesses. The goal is to confront their economic moats and reveal which model delivers the most resilient, sustainable competitive advantage today.
Revenue Segmentation: The Strategic Mix
This visual comparison dissects how JPMorgan Chase & Co. and Citigroup Inc. diversify income streams and where their primary sector bets lie:
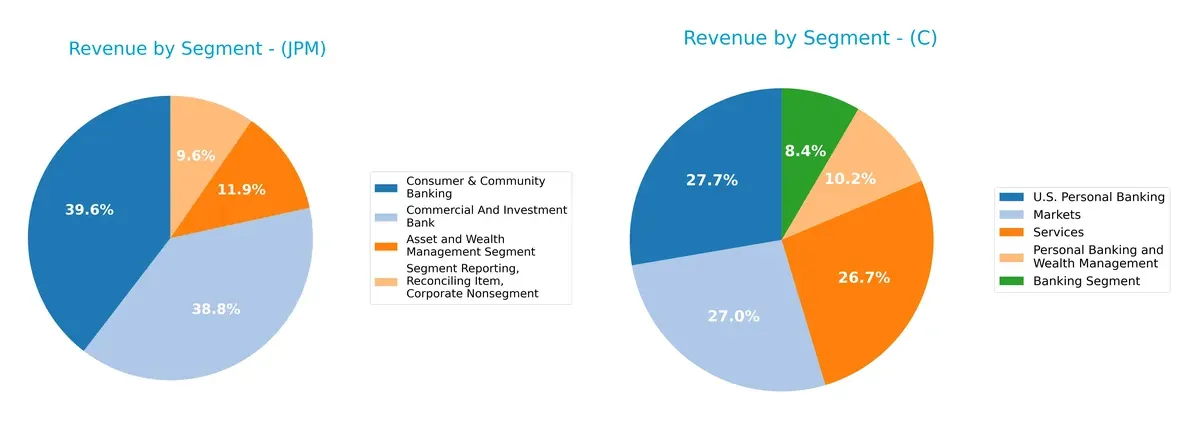
JPMorgan Chase anchors its revenue in Consumer & Community Banking at $71.5B and Commercial & Investment Bank at $70.1B, showing a balanced reliance on two dominant segments. Citigroup’s revenues pivot between U.S. Personal Banking at $20.4B and nearly equal Markets and Services segments around $19.8B and $19.6B. JPMorgan’s dual dominance reflects ecosystem lock-in and stable cash flow, while Citigroup’s mix indicates broader sector exposure but higher concentration risk in consumer banking.
Strengths and Weaknesses Comparison
This table compares the Strengths and Weaknesses of JPMorgan Chase & Co. (JPM) and Citigroup Inc. (C):
JPM Strengths
- Strong profitability with 20.35% net margin and 15.74% ROE
- Favorable debt to assets at 11.3%
- High fixed asset turnover at 7.73
- Diversified revenue streams across banking and wealth management
- Large global presence with significant North America and EMEA exposure
C Strengths
- Favorable PE at 14.89 and PB at 1.0 indicating market valuation appeal
- Favorable debt to assets at 26.94%
- Good fixed asset turnover at 5.05
- Balanced global revenue from North America and International markets
- Reasonable diversification across banking, markets, and personal banking
JPM Weaknesses
- Unfavorable ROIC at 1.29% below WACC at 11.34%
- Very high current ratio at 14.85 indicating potential inefficiency
- Elevated debt to equity at 1.38
- Low interest coverage at 0.74
- Low asset turnover at 0.06 despite size
C Weaknesses
- Lower profitability with 8.48% net margin and 6.72% ROE
- Unfavorable ROIC at 0.95% below WACC at 8.87%
- Poor liquidity ratios below 1
- High debt to equity at 3.37
- Low interest coverage at 0.24 and asset turnover at 0.06
JPM demonstrates stronger profitability and asset efficiency but faces challenges with capital efficiency and liquidity. C shows valuation strengths but lower profitability and weaker liquidity. Both companies exhibit slightly unfavorable capital returns relative to their cost of capital, suggesting room for strategic financial improvement.
The Moat Duel: Analyzing Competitive Defensibility
A structural moat protects long-term profits from competition’s relentless erosion. It defines who wins in banking’s fierce battleground:
JPMorgan Chase & Co.: Scale and Diversification Moat
JPM’s competitive edge stems from scale and diversified financial services. It maintains robust margins despite pressure, but its declining ROIC warns of eroding capital efficiency in 2026.
Citigroup Inc.: Global Footprint with Operational Challenges
Citigroup relies on its broad international presence, contrasting JPM’s domestic dominance. Its improving margins signal operational gains, yet shrinking ROIC and value destruction challenge its moat durability.
Verdict: Scale Dominance vs. Global Reach Under Pressure
JPMorgan’s wider moat lies in its scale and segment diversity, better defending market share. Citigroup’s global reach offers opportunity, but both face critical profitability declines limiting moat strength.
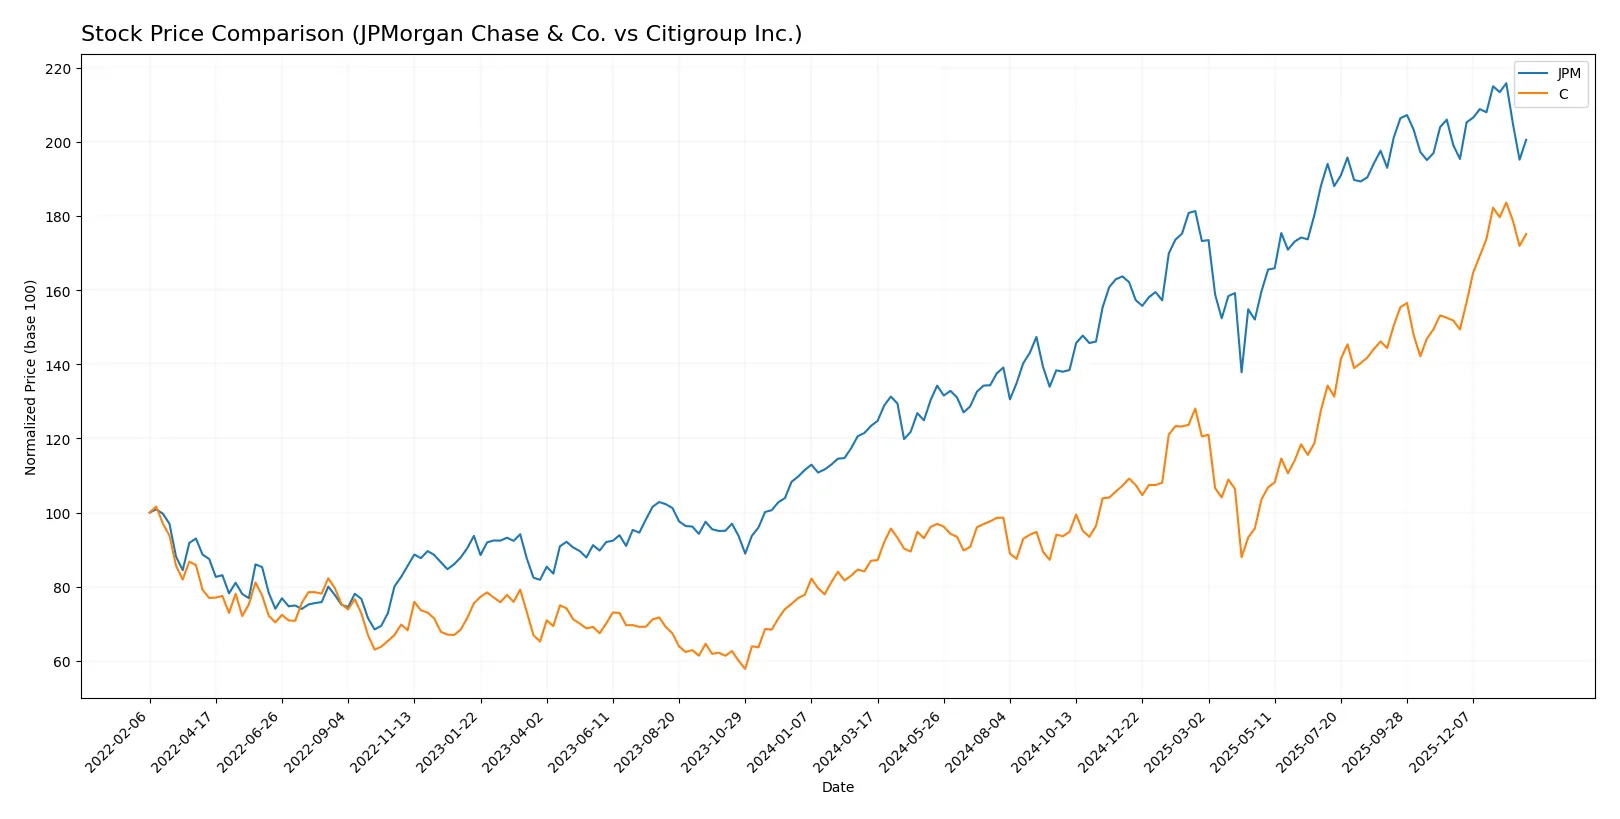
Which stock offers better returns?
The past year reveals strong price rallies for both JPMorgan Chase & Co. and Citigroup Inc., with Citigroup showing a sharper upward momentum and recent acceleration in trading activity.
Trend Comparison
JPMorgan Chase & Co. posted a 62.52% price increase over 12 months, marking a bullish trend but with decelerating momentum. The stock ranged between 182.79 and 329.19, showing high volatility with a 42.96 standard deviation.
Citigroup Inc. surged 101.2% over the same period, reflecting a bullish trend with accelerating momentum. Its price fluctuated between 57.51 and 121.32, displaying moderate volatility at an 18.09 standard deviation.
Comparing these trends, Citigroup delivered higher market performance with stronger acceleration, despite JPMorgan’s higher volatility and larger overall volume.
Target Prices
Analyst consensus on target prices for JPMorgan Chase & Co. and Citigroup Inc. reveals bullish expectations.
| Company | Target Low | Target High | Consensus |
|---|---|---|---|
| JPMorgan Chase & Co. | 245 | 391 | 326.33 |
| Citigroup Inc. | 87 | 150 | 130.55 |
Both banks show upside potential above current prices—JPM trades at 306, with a consensus target 7% higher; Citigroup at 116, with a 13% upside consensus. This suggests analysts expect moderate growth amid sector volatility.

Don’t Let Luck Decide Your Entry Point
Optimize your entry points with our advanced ProRealTime indicators. You’ll get efficient buy signals with precise price targets for maximum performance. Start outperforming now!
How do institutions grade them?
JPMorgan Chase & Co. Grades
The following table summarizes recent grades issued by trusted financial institutions for JPMorgan Chase & Co.:
| Grading Company | Action | New Grade | Date |
|---|---|---|---|
| Truist Securities | Maintain | Hold | 2026-01-06 |
| Barclays | Maintain | Overweight | 2026-01-05 |
| Truist Securities | Maintain | Hold | 2025-12-18 |
| Keefe, Bruyette & Woods | Maintain | Outperform | 2025-12-17 |
| Wells Fargo | Maintain | Overweight | 2025-11-03 |
| Barclays | Maintain | Overweight | 2025-10-15 |
| Morgan Stanley | Maintain | Equal Weight | 2025-10-15 |
| UBS | Maintain | Buy | 2025-10-07 |
| Evercore ISI Group | Maintain | Outperform | 2025-09-30 |
| Morgan Stanley | Maintain | Equal Weight | 2025-09-29 |
Citigroup Inc. Grades
The following table summarizes recent grades issued by trusted financial institutions for Citigroup Inc.:
| Grading Company | Action | New Grade | Date |
|---|---|---|---|
| RBC Capital | Maintain | Outperform | 2026-01-15 |
| Morgan Stanley | Maintain | Overweight | 2026-01-15 |
| Oppenheimer | Maintain | Outperform | 2026-01-15 |
| Goldman Sachs | Maintain | Buy | 2026-01-06 |
| Truist Securities | Maintain | Buy | 2026-01-06 |
| Wells Fargo | Maintain | Overweight | 2026-01-05 |
| Barclays | Maintain | Overweight | 2026-01-05 |
| Piper Sandler | Maintain | Overweight | 2025-12-30 |
| Truist Securities | Maintain | Buy | 2025-12-18 |
| Keefe, Bruyette & Woods | Maintain | Outperform | 2025-12-17 |
Which company has the best grades?
Citigroup holds consistently stronger grades, including multiple “Buy” and “Outperform” ratings. JPMorgan shows more variation, with several “Hold” and “Equal Weight” grades. Investors may view Citigroup as having more bullish institutional sentiment.
Risks specific to each company
The following categories identify the critical pressure points and systemic threats facing both firms in the 2026 market environment:
1. Market & Competition
JPMorgan Chase & Co.
- Dominates US market with diversified segments and strong brand. Faces intense competition from fintech disruptors and global banks.
Citigroup Inc.
- Operates globally with exposure to emerging markets. Struggles with weaker profitability and competitive pressures in retail banking.
2. Capital Structure & Debt
JPMorgan Chase & Co.
- Moderate debt-to-equity ratio (1.38), favorable debt-to-assets (11.3%), but weak interest coverage (0.74) flags risk in rising rates.
Citigroup Inc.
- High leverage (D/E 3.37) with poor interest coverage (0.24) signals elevated financial risk amid volatile credit markets.
3. Stock Volatility
JPMorgan Chase & Co.
- Beta of 1.066 shows moderate sensitivity to market swings, reflecting stability relative to peers.
Citigroup Inc.
- Higher beta at 1.166 indicates greater price volatility and investor risk exposure.
4. Regulatory & Legal
JPMorgan Chase & Co.
- Subject to stringent US financial regulations; robust compliance but ongoing scrutiny in investment banking risks fines.
Citigroup Inc.
- Similar regulatory environment with additional risks from global operations, increasing legal complexity and penalties potential.
5. Supply Chain & Operations
JPMorgan Chase & Co.
- Strong operational control with advanced digital platforms; risk from technology disruptions is moderate.
Citigroup Inc.
- Relies on global branch network; operational risks heightened by legacy infrastructure and global economic uncertainties.
6. ESG & Climate Transition
JPMorgan Chase & Co.
- Increasing investments in sustainable finance; faces pressure to reduce carbon footprint across portfolios.
Citigroup Inc.
- ESG initiatives progressing but lag behind peers; exposure to fossil fuels in emerging markets remains a concern.
7. Geopolitical Exposure
JPMorgan Chase & Co.
- Primarily US-focused but with global investment banking footprint; geopolitical tensions could affect cross-border deals.
Citigroup Inc.
- Significant presence in Asia, Latin America, and Europe exposes it to currency, regulatory, and political risks.
Which company shows a better risk-adjusted profile?
JPMorgan’s most impactful risk lies in its moderate debt leverage combined with weak interest coverage, risking profit margins if rates rise. Citigroup’s critical threat is its elevated financial leverage paired with poor interest coverage, amplifying bankruptcy risk. JPMorgan’s lower volatility and stronger market position yield a better risk-adjusted profile. Recent data highlight Citigroup’s alarmingly low Altman Z-Score and high debt-to-equity ratio, justifying investor caution.
Final Verdict: Which stock to choose?
JPMorgan Chase & Co. wields unmatched operational efficiency and a commanding market presence, making it a powerhouse in financial services. Its point of vigilance lies in a declining return on invested capital, signaling potential profitability pressures ahead. JPM fits well in an Aggressive Growth portfolio willing to tolerate strategic risks.
Citigroup Inc. offers a strategic moat through its solid capital base and valuation appeal, underpinned by favorable price-to-book and price-to-earnings ratios. While it carries higher leverage risks than JPM, it presents a relatively safer profile for investors prioritizing valuation discipline. Citigroup suits a GARP (Growth at a Reasonable Price) approach.
If you prioritize operational excellence and market leadership, JPMorgan outshines due to its efficiency and growth track record despite margin pressure. However, if you seek valuation safety with moderate growth, Citigroup offers better stability and a more attractive entry point. Both have risk flags, so alignment with your risk tolerance and investment horizon is crucial.
Disclaimer: Investment carries a risk of loss of initial capital. The past performance is not a reliable indicator of future results. Be sure to understand risks before making an investment decision.
Go Further
I encourage you to read the complete analyses of JPMorgan Chase & Co. and Citigroup Inc. to enhance your investment decisions: