Cisco Systems, Inc. and Zebra Technologies Corporation are two prominent players in the communication equipment industry, each driving innovation in networking and enterprise asset intelligence. Cisco excels in Internet Protocol-based networking solutions, while Zebra leads in automatic identification and data capture technologies. Their market overlap and distinct innovation strategies make them compelling candidates for comparison. In this article, I will help you determine which company presents the most attractive investment opportunity.
Table of contents
Companies Overview
I will begin the comparison between Cisco Systems, Inc. and Zebra Technologies Corporation by providing an overview of these two companies and their main differences.
Cisco Systems, Inc. Overview
Cisco Systems, Inc. designs, manufactures, and sells Internet Protocol-based networking and communication technology products worldwide. Its portfolio includes switching, routing, wireless, security, collaboration, and observability solutions. The company serves businesses, public institutions, governments, and service providers through direct sales and partnerships. Headquartered in San Jose, California, Cisco is a global leader in communication equipment with a market cap of approximately 298B USD.
Zebra Technologies Corporation Overview
Zebra Technologies Corporation provides enterprise asset intelligence solutions focused on automatic identification and data capture worldwide. It offers printers, barcode scanners, RFID readers, mobile computing products, and software solutions for asset tracking, workforce management, and analytics. Serving retail, healthcare, logistics, and other sectors, Zebra operates through direct sales and channel partners. Based in Lincolnshire, Illinois, Zebra has a market cap near 13.2B USD.
Key similarities and differences
Both companies operate in the communication equipment industry and provide technology solutions to enhance connectivity and asset management. Cisco focuses broadly on IP networking, security, and collaboration infrastructure, while Zebra specializes in asset intelligence through identification and tracking devices and software. Cisco is significantly larger in market capitalization and workforce, highlighting its global scale compared to Zebra’s more niche product offerings and industry-specific solutions.
Income Statement Comparison
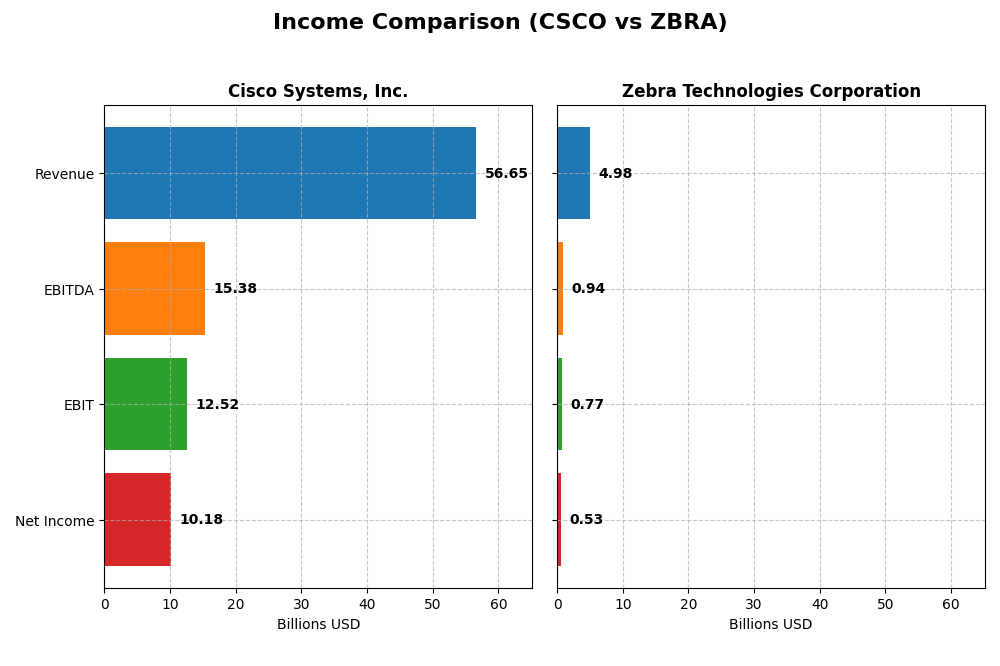
This table provides a side-by-side comparison of the most recent full fiscal year income statement metrics for Cisco Systems, Inc. and Zebra Technologies Corporation.
| Metric | Cisco Systems, Inc. | Zebra Technologies Corporation |
|---|---|---|
| Market Cap | 298.2B | 13.2B |
| Revenue | 56.7B | 5.0B |
| EBITDA | 15.4B | 937M |
| EBIT | 12.5B | 765M |
| Net Income | 10.2B | 528M |
| EPS | 2.56 | 10.25 |
| Fiscal Year | 2025 | 2024 |
Income Statement Interpretations
Cisco Systems, Inc.
Between 2021 and 2025, Cisco’s revenue grew moderately by 13.72%, while net income declined by 3.88%, reflecting some margin pressure. Gross and EBIT margins remained favorable above 60% and 20%, respectively, though net margin contracted by 15.48%. In 2025, revenue increased 5.3%, but EBIT and net margin decreased, signaling slower profitability growth despite stable EPS.
Zebra Technologies Corporation
Zebra exhibited steady revenue growth of 11.98% from 2020 to 2024, with net income rising 4.76%. Margins showed strength, with gross margin at 48.44% and net margin at 10.6%. The latest fiscal year marked a notable improvement, with revenue up 8.66%, EBIT up 30.77%, and net margin growth of 64.16%, indicating enhanced operational efficiency and profitability.
Which one has the stronger fundamentals?
Both companies demonstrate favorable income statement fundamentals, but Zebra shows stronger recent growth across revenue, EBIT, and net margin, supported by consistent margin expansion. Cisco maintains higher absolute margins and market scale but faces margin compression and net income decline. Zebra’s more pronounced recent profitability gains contrast with Cisco’s more mixed margin and income trends.
Financial Ratios Comparison
The table below presents a side-by-side comparison of key financial ratios for Cisco Systems, Inc. (CSCO) and Zebra Technologies Corporation (ZBRA) based on their most recent fiscal year data.
| Ratios | Cisco Systems, Inc. (2025) | Zebra Technologies Corporation (2024) |
|---|---|---|
| ROE | 21.7% | 14.7% |
| ROIC | 11.6% | 9.7% |
| P/E | 26.8 | 37.7 |
| P/B | 5.83 | 5.55 |
| Current Ratio | 1.00 | 1.43 |
| Quick Ratio | 0.91 | 1.03 |
| D/E (Debt to Equity) | 0.63 | 0.66 |
| Debt-to-Assets | 24.2% | 29.6% |
| Interest Coverage | 7.38 | 5.75 |
| Asset Turnover | 0.46 | 0.63 |
| Fixed Asset Turnover | 16.6 | 10.6 |
| Payout Ratio | 63.2% | 0% |
| Dividend Yield | 2.36% | 0% |
Interpretation of the Ratios
Cisco Systems, Inc.
Cisco Systems shows mostly favorable ratios with strong net margin at 17.97% and a robust return on equity of 21.73%. However, the company faces concerns with a relatively high price-to-book ratio of 5.83 and a current ratio around 1.0, indicating tight liquidity. Cisco pays dividends with a 2.36% yield, supported by manageable payout levels and sustainable free cash flow coverage.
Zebra Technologies Corporation
Zebra exhibits mixed ratio results, with a favorable net margin of 10.6% but neutral returns on equity and invested capital, reflecting moderate profitability. The company maintains a healthy current ratio of 1.43 and good interest coverage, yet faces an unfavorable high weighted average cost of capital at 10.66%. Zebra does not pay dividends, likely prioritizing reinvestment and growth over shareholder payouts.
Which one has the best ratios?
Cisco presents a more favorable overall ratio profile with stronger profitability metrics and a sustainable dividend yield. Zebra’s ratios are slightly favorable but show more neutrality and some financial cost challenges. Both companies have areas for improvement, yet Cisco’s balance of returns and dividend policy suggests greater financial stability based on these metrics.
Strategic Positioning
This section compares the strategic positioning of Cisco Systems, Inc. and Zebra Technologies Corporation based on market position, key segments, and exposure to technological disruption:
Cisco Systems, Inc.
- Market leader with large market cap of 298B, faces moderate competitive pressure.
- Diversified segments: Networking, Services, Security, Collaboration, Observability.
- Active in IP networking, security, cloud collaboration; exposed to evolving network tech.
Zebra Technologies Corporation
- Smaller player with 13B market cap, higher beta indicates more volatility.
- Focused on Asset Intelligence & Tracking and Enterprise Visibility & Mobility.
- Focuses on automatic identification and data capture; exposed to hardware and software innovation.
Cisco Systems, Inc. vs Zebra Technologies Corporation Positioning
Cisco adopts a diversified approach across multiple networking and security segments, leveraging scale and broad capabilities. Zebra concentrates on specialized enterprise asset intelligence and mobility solutions, offering focused expertise but narrower market reach.
Which has the best competitive advantage?
Cisco shows a slightly favorable moat by creating value with ROIC above WACC despite declining profitability. Zebra’s very unfavorable moat indicates value destruction and declining returns, reflecting weaker competitive advantage in this timeframe.
Stock Comparison
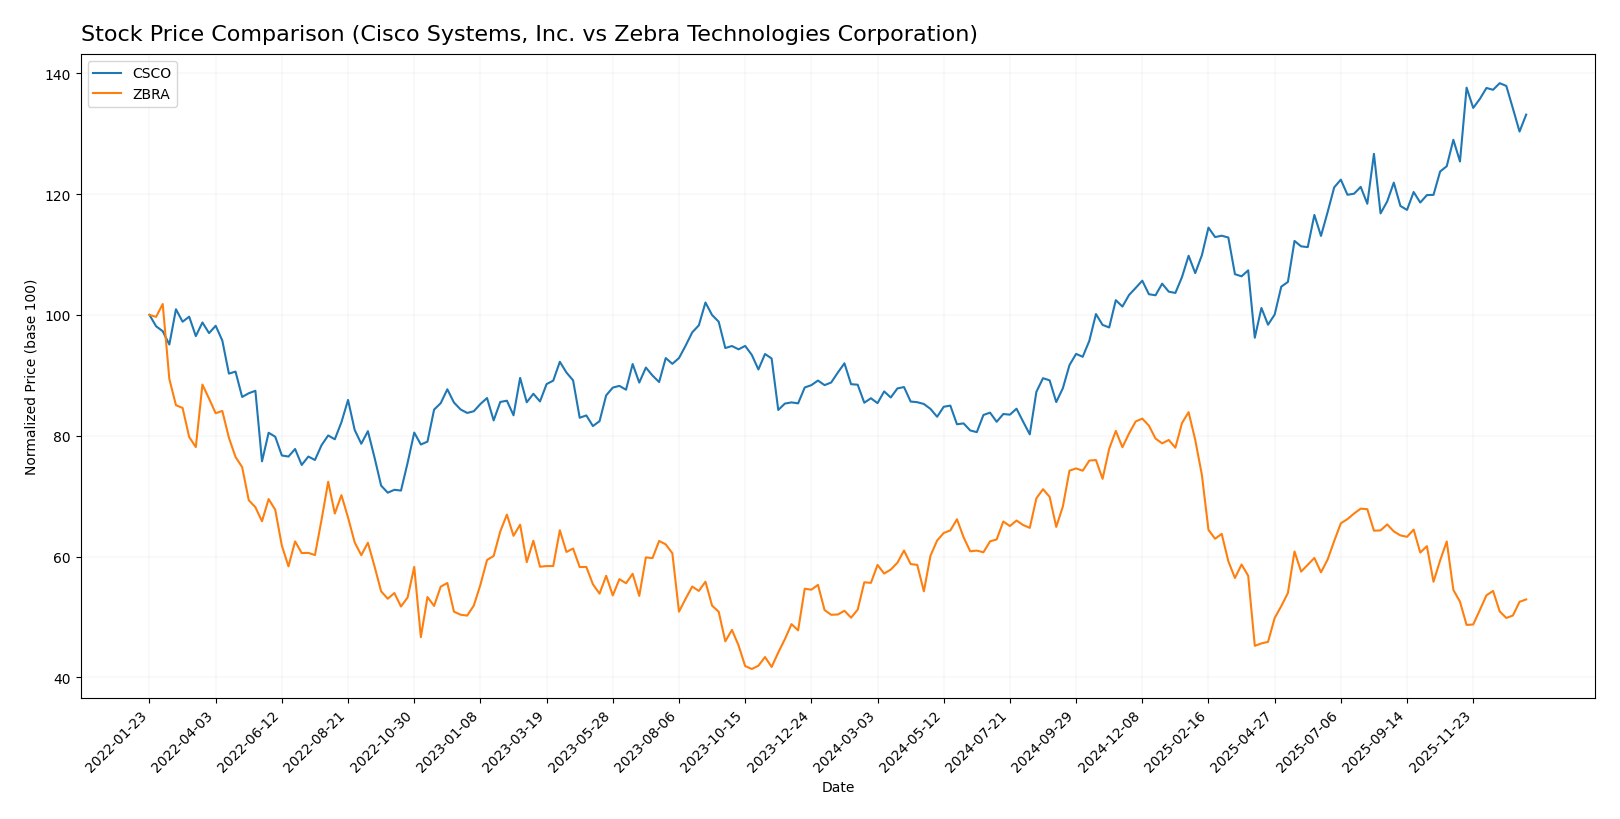
The stock price movements over the past year reveal a strong bullish trend for Cisco Systems, Inc. with a significant price increase, while Zebra Technologies Corporation experienced a declining trend marked by notable volatility and accelerating downside pressure.
Trend Analysis
Cisco Systems, Inc. (CSCO) exhibited a bullish trend over the past 12 months with a 54.46% price increase, showing deceleration in momentum. The stock ranged between 45.47 and 78.42, with moderate recent growth of 3.23%.
Zebra Technologies Corporation (ZBRA) displayed a bearish trend, declining 4.93% over the last year with accelerating downward momentum and high volatility. Recent performance continued negative with a 2.9% drop and neutral buyer behavior.
Comparatively, Cisco Systems outperformed Zebra Technologies significantly over the past year, delivering the highest market performance amid a strong upward trend versus Zebra’s continued decline.
Target Prices
The current analyst consensus reveals optimistic target prices for both Cisco Systems, Inc. and Zebra Technologies Corporation.
| Company | Target High | Target Low | Consensus |
|---|---|---|---|
| Cisco Systems, Inc. | 91 | 69 | 82.67 |
| Zebra Technologies Corporation | 368 | 291 | 329.5 |
Analysts expect Cisco’s price to rise moderately above its current $75.47, while Zebra’s consensus target is significantly higher than its current $261.44, indicating stronger growth expectations for Zebra.
Analyst Opinions Comparison
This section compares analysts’ ratings and grades for Cisco Systems, Inc. and Zebra Technologies Corporation:
Rating Comparison
Cisco Systems, Inc. Rating
- Rating: Both companies hold a “B” rating labeled Very Favorable.
- Discounted Cash Flow Score: Cisco scores 4, indicating a favorable valuation based on future cash flows.
- ROE Score: Both companies have a score of 4, showing efficient profit generation from equity.
- ROA Score: Both hold a score of 4, reflecting effective asset utilization.
- Debt To Equity Score: Both score 1, indicating a very unfavorable level of financial leverage.
- Overall Score: Both companies have a moderate overall score of 3.
Zebra Technologies Corporation Rating
- Rating: Both companies hold a “B” rating labeled Very Favorable.
- Discounted Cash Flow Score: Zebra scores 3, indicating a moderate valuation based on future cash flows.
- ROE Score: Both companies have a score of 4, showing efficient profit generation from equity.
- ROA Score: Both hold a score of 4, reflecting effective asset utilization.
- Debt To Equity Score: Both score 1, indicating a very unfavorable level of financial leverage.
- Overall Score: Both companies have a moderate overall score of 3.
Which one is the best rated?
Cisco and Zebra share the same overall rating of “B” and overall score of 3. Cisco has a slightly higher discounted cash flow score, suggesting a more favorable valuation, but both have identical scores in other key financial metrics.
Scores Comparison
Here is a comparison of the Altman Z-Score and Piotroski Score for Cisco Systems, Inc. and Zebra Technologies Corporation:
CSCO Scores
- Altman Z-Score: 3.19, indicating a safe zone status
- Piotroski Score: 7, classified as strong
ZBRA Scores
- Altman Z-Score: 3.86, indicating a safe zone status
- Piotroski Score: 7, classified as strong
Which company has the best scores?
Both Cisco and Zebra demonstrate strong financial health with safe zone Altman Z-Scores and identical strong Piotroski Scores of 7. Zebra has a slightly higher Altman Z-Score, suggesting marginally lower bankruptcy risk.
Grades Comparison
Here is a detailed comparison of the recent grades assigned to Cisco Systems, Inc. and Zebra Technologies Corporation by reliable grading companies:
Cisco Systems, Inc. Grades
This table shows the latest grades and actions from reputable financial institutions for Cisco Systems, Inc.:
| Grading Company | Action | New Grade | Date |
|---|---|---|---|
| Morgan Stanley | Maintain | Overweight | 2025-12-17 |
| Morgan Stanley | Maintain | Overweight | 2025-11-13 |
| B of A Securities | Maintain | Buy | 2025-11-13 |
| Evercore ISI Group | Maintain | In Line | 2025-11-13 |
| Barclays | Maintain | Equal Weight | 2025-11-13 |
| Piper Sandler | Maintain | Neutral | 2025-11-13 |
| UBS | Maintain | Buy | 2025-11-13 |
| Melius Research | Maintain | Buy | 2025-11-13 |
| JP Morgan | Maintain | Overweight | 2025-11-13 |
| Keybanc | Maintain | Overweight | 2025-11-13 |
Cisco’s grades show a consistent pattern of “Buy” and “Overweight” ratings, indicating positive sentiment from multiple major financial institutions.
Zebra Technologies Corporation Grades
The following table lists recent grades and actions from verified grading companies for Zebra Technologies Corporation:
| Grading Company | Action | New Grade | Date |
|---|---|---|---|
| Barclays | Maintain | Overweight | 2026-01-12 |
| Truist Securities | Maintain | Hold | 2025-12-18 |
| Truist Securities | Maintain | Hold | 2025-10-29 |
| Barclays | Maintain | Overweight | 2025-10-29 |
| Citigroup | Maintain | Neutral | 2025-10-29 |
| Citigroup | Maintain | Neutral | 2025-10-09 |
| Truist Securities | Maintain | Hold | 2025-10-08 |
| Morgan Stanley | Maintain | Equal Weight | 2025-08-06 |
| Needham | Maintain | Buy | 2025-08-06 |
| Truist Securities | Maintain | Hold | 2025-08-06 |
Zebra Technologies’ grades are more mixed, with several “Hold” and “Neutral” ratings alongside some “Buy” and “Overweight,” indicating a more cautious stance from analysts.
Which company has the best grades?
Cisco Systems, Inc. has received predominantly stronger grades such as multiple “Buy” and “Overweight” ratings compared to Zebra Technologies Corporation’s mix of “Hold,” “Neutral,” and fewer “Buy” ratings. This suggests investors might perceive Cisco as a more favorable option based on analyst sentiment, potentially influencing portfolio decisions towards higher conviction.
Strengths and Weaknesses
Here is a comparison of key strengths and weaknesses of Cisco Systems, Inc. (CSCO) and Zebra Technologies Corporation (ZBRA) based on the most recent financial and operational data.
| Criterion | Cisco Systems, Inc. (CSCO) | Zebra Technologies Corporation (ZBRA) |
|---|---|---|
| Diversification | Strong diversification with significant revenue from Networking (28.3B), Services (21.9B), Security (8.1B), and Collaboration (4.15B) | Moderate diversification focused mainly on Asset Intelligence Tracking (1.65B) and Enterprise Visibility Mobility (3.33B) |
| Profitability | High profitability with net margin 18%, ROE 21.7%, ROIC 11.6% (favorable) | Moderate profitability, net margin 10.6%, ROE 14.7% (neutral), ROIC 9.7% (neutral) |
| Innovation | Consistent investment in security and observability products, though ROIC trend is declining (-16.4%) | Innovation impacted by declining ROIC (-35.3%), signaling challenges in maintaining competitive advantage |
| Global presence | Extensive global footprint with broad market reach in multiple sectors | More niche and specialized market presence focused on enterprise mobility and tracking solutions |
| Market Share | Large market share in networking and IT infrastructure segments | Smaller market share with focus on specific technology segments |
Key takeaways: Cisco demonstrates strong diversification and robust profitability, though its profitability trend shows some decline. Zebra has solid niche positioning but faces profitability challenges with a declining ROIC trend, suggesting cautious consideration for long-term value creation.
Risk Analysis
The table below presents a comparative overview of key risks associated with Cisco Systems, Inc. (CSCO) and Zebra Technologies Corporation (ZBRA) as of the most recent fiscal years:
| Metric | Cisco Systems, Inc. (CSCO) | Zebra Technologies Corporation (ZBRA) |
|---|---|---|
| Market Risk | Beta 0.86 (moderate volatility) | Beta 1.68 (high volatility) |
| Debt level | Debt/Equity 0.63 (neutral) | Debt/Equity 0.66 (neutral) |
| Regulatory Risk | Moderate, tech industry regulations globally | Moderate, compliance in manufacturing and data capture |
| Operational Risk | Large scale operations, supply chain complexity | Smaller scale, but reliant on niche tech production |
| Environmental Risk | Moderate, with sustainability initiatives ongoing | Moderate, focused on eco-friendly product development |
| Geopolitical Risk | Global presence including China and Middle East | Exposure mainly in US and global logistics markets |
Both companies operate in the technology sector, but Cisco’s lower beta indicates less market price volatility compared to Zebra’s higher beta, suggesting more market risk for ZBRA. Debt levels are comparable and moderate, implying manageable financial leverage. Regulatory and environmental risks are typical for tech manufacturers, with no immediate red flags. Operationally, Cisco’s vast scale adds complexity, increasing risk exposure. Geopolitical risks exist for Cisco due to broader global operations. Overall, market volatility and operational scale are the most impactful risks to monitor.
Which Stock to Choose?
Cisco Systems, Inc. (CSCO) shows a favorable income evolution with a 5.3% revenue growth in 2025 and solid profitability metrics including a 17.97% net margin and 21.73% ROE. Its debt levels are moderate with a debt-to-assets ratio of 24.24%, and the company holds a very favorable rating despite some unfavorable valuation ratios.
Zebra Technologies Corporation (ZBRA) demonstrates a strong income growth with 8.66% revenue growth in 2024 and robust profitability improvements, including a 64.16% increase in net margin growth in one year. Debt remains moderate with a 29.64% debt-to-assets ratio, and its rating is very favorable though some valuation ratios are also unfavorable.
Investors focused on stable value creation and consistent profitability might find Cisco’s favorable ratios and solid income metrics appealing, while those prioritizing growth potential and recent strong earnings improvements could view Zebra’s performance and income growth as more attractive, despite its value destruction moat status.
Disclaimer: Investment carries a risk of loss of initial capital. The past performance is not a reliable indicator of future results. Be sure to understand risks before making an investment decision.
Go Further
I encourage you to read the complete analyses of Cisco Systems, Inc. and Zebra Technologies Corporation to enhance your investment decisions: