In the fast-evolving technology sector, Cisco Systems, Inc. and Palo Alto Networks, Inc. stand out as leaders shaping communication and cybersecurity landscapes. Cisco excels in networking hardware and integrated solutions, while Palo Alto Networks drives innovation in cybersecurity software and cloud security. Their overlapping focus on secure connectivity and enterprise solutions makes this comparison vital. Join me as we explore which company offers the most compelling investment opportunity in 2026.

Table of contents
Companies Overview
I will begin the comparison between Cisco Systems and Palo Alto Networks by providing an overview of these two companies and their main differences.
Cisco Systems Overview
Cisco Systems, Inc. designs and sells Internet Protocol-based networking products and communication technology worldwide. Its product portfolio includes switching, routing, wireless, security, collaboration, and observability solutions, serving businesses, public institutions, and governments. Cisco supports its offerings with various service and advisory options, and it operates through direct sales and an extensive partner network. The company is headquartered in San Jose, CA, with a market cap of $300B.
Palo Alto Networks Overview
Palo Alto Networks, Inc. provides cybersecurity solutions globally, including firewall appliances, security management software, and subscription services for threat prevention and device protection. The firm also offers cloud security, analytics, consulting, and professional education services. It targets medium to large enterprises, service providers, and government entities across diverse industries. Headquartered in Santa Clara, CA, Palo Alto Networks has a market cap of nearly $120B.
Key similarities and differences
Both companies operate in the technology sector but focus on different niches: Cisco on networking infrastructure and communication technology, Palo Alto Networks on cybersecurity software and services. Cisco’s broader product range includes hardware and collaboration tools, while Palo Alto Networks specializes primarily in security solutions and consulting. Both serve enterprise and public sectors but differ in scale, with Cisco being significantly larger in market capitalization and workforce size.
Income Statement Comparison
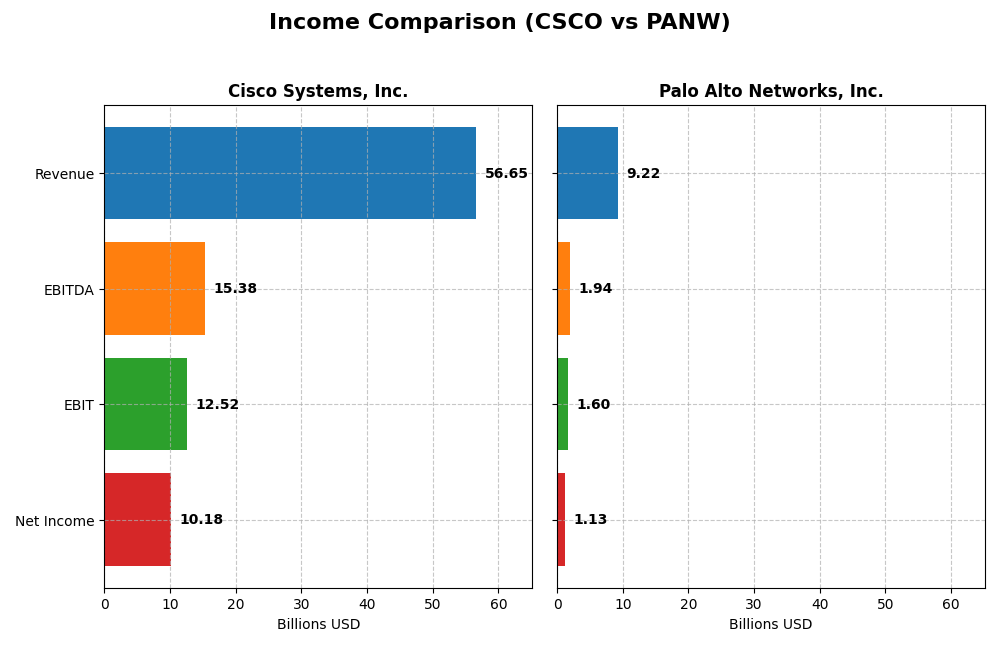
This table compares the key income statement metrics for Cisco Systems, Inc. and Palo Alto Networks, Inc. for their most recent fiscal year, providing a snapshot of their financial performance.
| Metric | Cisco Systems, Inc. (CSCO) | Palo Alto Networks, Inc. (PANW) |
|---|---|---|
| Market Cap | 300.4B | 120.0B |
| Revenue | 56.65B | 9.22B |
| EBITDA | 15.38B | 1.94B |
| EBIT | 12.52B | 1.60B |
| Net Income | 10.18B | 1.13B |
| EPS | 2.56 | 1.71 |
| Fiscal Year | 2025 | 2025 |
Income Statement Interpretations
Cisco Systems, Inc.
Cisco’s revenue showed a steady increase from 49.8B in 2021 to 56.7B in 2025, with net income fluctuating and declining slightly overall. Margins remain robust, with a gross margin near 65% and net margin around 18%. In 2025, revenue grew modestly by 5.3%, but EBIT and net margin fell, indicating margin pressure amid stable earnings per share.
Palo Alto Networks, Inc.
Palo Alto Networks experienced strong revenue growth from 4.3B in 2021 to 9.2B in 2025, alongside a significant net income rise. Margins improved, with gross margin reaching 73.4% and EBIT margin at 17.3%. The latest year saw revenue and EBIT surge, though net margin and EPS declined sharply, reflecting some short-term profitability challenges despite growth.
Which one has the stronger fundamentals?
Cisco demonstrates consistent profitability with favorable margins but faces slight declines in net income and margin growth. Palo Alto Networks shows impressive revenue and net income growth with generally improving margins, tempered by recent net margin and EPS setbacks. Overall, Palo Alto Networks has a higher proportion of favorable income statement indicators, suggesting stronger growth fundamentals.
Financial Ratios Comparison
The table below presents a side-by-side comparison of key financial ratios for Cisco Systems, Inc. (CSCO) and Palo Alto Networks, Inc. (PANW) based on their most recent fiscal year data.
| Ratios | Cisco Systems, Inc. (CSCO) | Palo Alto Networks, Inc. (PANW) |
|---|---|---|
| ROE | 21.7% | 14.5% |
| ROIC | 11.6% | 5.7% |
| P/E | 26.8 | 101.4 |
| P/B | 5.8 | 14.7 |
| Current Ratio | 1.0 | 0.89 |
| Quick Ratio | 0.91 | 0.89 |
| D/E (Debt-to-Equity) | 0.63 | 0.04 |
| Debt-to-Assets | 24.2% | 1.4% |
| Interest Coverage | 7.4 | 414.3 |
| Asset Turnover | 0.46 | 0.39 |
| Fixed Asset Turnover | 16.6 | 12.6 |
| Payout Ratio | 63.2% | 0% |
| Dividend Yield | 2.36% | 0% |
Interpretation of the Ratios
Cisco Systems, Inc.
Cisco shows a strong profile with favorable net margin (17.97%), ROE (21.73%), and ROIC (11.62%), supported by a solid debt-to-assets ratio (24.24%) and interest coverage (7.86). Some caution is warranted on its high P/E (26.83), P/B (5.83), and weak current ratio (1.0). Cisco pays dividends with a 2.36% yield, indicating stable shareholder returns, well-covered by free cash flow.
Palo Alto Networks, Inc.
Palo Alto Networks exhibits favorable net margin (12.3%) and excellent interest coverage (532.53), but neutrality on ROE (14.49%) and ROIC (5.67%) suggests moderate profitability. Its very high P/E (101.43) and P/B (14.7) ratios, alongside a weak current ratio (0.89), signal potential valuation and liquidity concerns. The company does not pay dividends, likely due to reinvestment in growth and R&D priorities.
Which one has the best ratios?
Cisco’s ratios are predominantly favorable, reflecting profitability, manageable debt, and attractive dividend yield, despite some liquidity and valuation challenges. Palo Alto Networks shows mixed strength with high interest coverage and growth investment focus but weaker valuation and liquidity metrics. Overall, Cisco presents a more balanced financial ratio profile compared to Palo Alto Networks.
Strategic Positioning
This section compares the strategic positioning of Cisco Systems, Inc. and Palo Alto Networks, Inc. regarding market position, key segments, and exposure to technological disruption:
Cisco Systems, Inc.
- Established leader in communication equipment with broad competitive pressures in global markets.
- Diversified revenue streams across networking, services, security, collaboration, and observability.
- Moderate exposure with offerings in network security and cloud-based solutions amid evolving IT environments.
Palo Alto Networks, Inc.
- Mid-sized player in software infrastructure facing competitive pressures in cybersecurity.
- Focused on cybersecurity with product, subscription, and support business segments.
- Higher exposure due to specialization in cybersecurity and cloud security innovations.
Cisco Systems, Inc. vs Palo Alto Networks, Inc. Positioning
Cisco adopts a diversified approach spanning multiple technology domains, offering stability but facing broad competition. Palo Alto Networks concentrates on cybersecurity, enabling focused growth yet increasing reliance on a single industry segment.
Which has the best competitive advantage?
Cisco shows a slightly favorable moat, creating value despite declining profitability. Palo Alto Networks has a slightly unfavorable moat, destroying value but improving profitability, indicating evolving competitive strengths.
Stock Comparison
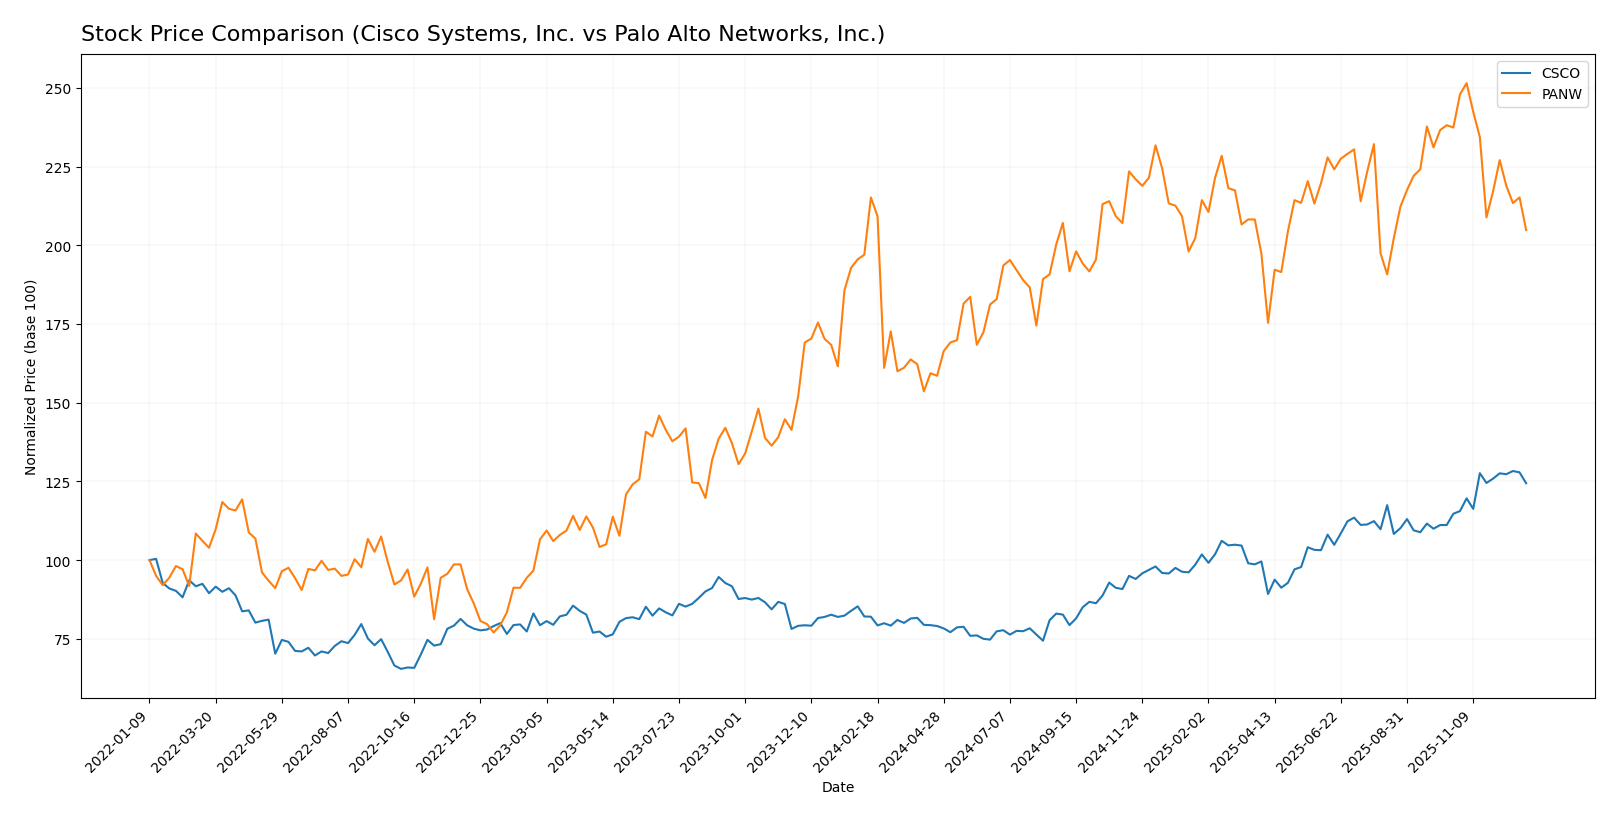
The stock price chart highlights significant price appreciation for Cisco Systems, Inc. (CSCO) with a clear bullish trajectory, contrasting with a bearish trend and deceleration for Palo Alto Networks, Inc. (PANW) over the past 12 months.
Trend Analysis
Cisco Systems, Inc. (CSCO) experienced a strong bullish trend with a 51.69% price increase over the past year, showing acceleration and a moderate volatility of 9.51. The stock reached a high of 78.42 and a low of 45.47.
Palo Alto Networks, Inc. (PANW) showed a bearish trend with a 4.82% price decline over the same period, accompanied by deceleration and higher volatility at 19.94. The stock’s highest price was 220.24 and lowest was 134.51.
Comparing both, CSCO delivered the highest market performance with a substantial positive price change, while PANW faced a negative price trend and deceleration.
Target Prices
The consensus target prices for Cisco Systems, Inc. and Palo Alto Networks, Inc. reflect optimistic analyst outlooks.
| Company | Target High | Target Low | Consensus |
|---|---|---|---|
| Cisco Systems, Inc. | 91 | 69 | 82.67 |
| Palo Alto Networks, Inc. | 250 | 157 | 231.07 |
Analysts expect Cisco’s stock to rise from the current 76.04 USD to around 82.67 USD, while Palo Alto Networks shows a stronger upside potential versus its current 179.37 USD price.
Analyst Opinions Comparison
This section compares the analysts’ ratings and financial scores for Cisco Systems, Inc. and Palo Alto Networks, Inc.:
Rating Comparison
CSCO Rating
- Rating: Both companies hold a “B” rating, indicating a very favorable assessment.
- Discounted Cash Flow Score: Cisco scores 4, reflecting favorable valuation based on cash flow.
- ROE Score: Cisco’s 4 score indicates efficient profit generation from shareholders’ equity.
- ROA Score: Cisco scores 4, signaling strong asset utilization to generate earnings.
- Debt To Equity Score: Cisco scores 1, indicating very unfavorable financial risk due to debt.
- Overall Score: Both companies have an overall score of 3, categorized as moderate.
PANW Rating
- Rating: Both companies hold a “B” rating, indicating a very favorable assessment.
- Discounted Cash Flow Score: Palo Alto also scores 4, indicating favorable cash flow valuation.
- ROE Score: Palo Alto also scores 4, showing similar efficiency in generating equity returns.
- ROA Score: Palo Alto scores 3, showing moderate effectiveness in asset utilization.
- Debt To Equity Score: Palo Alto scores 4, reflecting favorable financial stability with low debt.
- Overall Score: Both companies have an overall score of 3, categorized as moderate.
Which one is the best rated?
Both Cisco and Palo Alto Networks share the same overall rating of “B” and overall score of 3. Cisco has stronger asset utilization scores, while Palo Alto displays better debt-to-equity management. The choice depends on which financial aspect is prioritized.
Scores Comparison
Below is a comparison of the financial scores for Cisco and Palo Alto Networks:
Cisco Scores
- Altman Z-Score: 3.3, placing Cisco in the safe zone, indicating low bankruptcy risk.
- Piotroski Score: 7, considered strong financial health and good value investment.
Palo Alto Networks Scores
- Altman Z-Score: 5.77, well within the safe zone, showing very low bankruptcy risk.
- Piotroski Score: 6, reflecting average financial strength and moderate investment quality.
Which company has the best scores?
Palo Alto Networks has a higher Altman Z-Score, suggesting stronger bankruptcy safety, while Cisco has a better Piotroski Score, indicating stronger overall financial health. Both companies demonstrate solid financial profiles but differ in specific strengths.
Grades Comparison
Here is a detailed comparison of the latest grades assigned to Cisco Systems, Inc. and Palo Alto Networks, Inc.:
Cisco Systems, Inc. Grades
The table below summarizes recent grades and recommendations from major financial institutions for Cisco Systems, Inc.:
| Grading Company | Action | New Grade | Date |
|---|---|---|---|
| Morgan Stanley | Maintain | Overweight | 2025-12-17 |
| Wells Fargo | Maintain | Overweight | 2025-11-13 |
| Rosenblatt | Maintain | Buy | 2025-11-13 |
| Morgan Stanley | Maintain | Overweight | 2025-11-13 |
| Citigroup | Maintain | Buy | 2025-11-13 |
| UBS | Maintain | Buy | 2025-11-13 |
| Melius Research | Maintain | Buy | 2025-11-13 |
| Piper Sandler | Maintain | Neutral | 2025-11-13 |
| Evercore ISI Group | Maintain | In Line | 2025-11-13 |
| B of A Securities | Maintain | Buy | 2025-11-13 |
Cisco Systems shows a strong consensus with mostly “Buy” and “Overweight” grades, reflecting positive analyst confidence and a stable outlook.
Palo Alto Networks, Inc. Grades
The table below presents the recent grades and actions from key grading companies for Palo Alto Networks, Inc.:
| Grading Company | Action | New Grade | Date |
|---|---|---|---|
| Morgan Stanley | Maintain | Overweight | 2025-12-18 |
| HSBC | Downgrade | Reduce | 2025-11-21 |
| Goldman Sachs | Maintain | Buy | 2025-11-21 |
| Rosenblatt | Maintain | Buy | 2025-11-20 |
| Piper Sandler | Maintain | Overweight | 2025-11-20 |
| Bernstein | Maintain | Outperform | 2025-11-20 |
| WestPark Capital | Maintain | Hold | 2025-11-20 |
| Wedbush | Maintain | Outperform | 2025-11-20 |
| BTIG | Maintain | Buy | 2025-11-20 |
| Oppenheimer | Maintain | Outperform | 2025-11-20 |
Palo Alto Networks displays generally positive grades, with a few downgrades and hold ratings indicating a more mixed analyst sentiment.
Which company has the best grades?
Cisco Systems, Inc. holds a stronger and more consistent set of grades, predominantly “Buy” and “Overweight,” compared to Palo Alto Networks, Inc., which has a broader range of ratings including some downgrades. This consistency may signal higher analyst confidence in Cisco’s near-term prospects, potentially affecting investors’ perception of stability and growth potential.
Strengths and Weaknesses
Below is a comparison table highlighting the key strengths and weaknesses of Cisco Systems, Inc. (CSCO) and Palo Alto Networks, Inc. (PANW) based on the most recent data available.
| Criterion | Cisco Systems, Inc. (CSCO) | Palo Alto Networks, Inc. (PANW) |
|---|---|---|
| Diversification | Highly diversified with strong segments in Networking (28.3B), Services (21.9B), Security (8.1B), and Collaboration (4.2B) | Focused primarily on cybersecurity with strong Subscription (5B) and Support (2.45B) revenues |
| Profitability | Strong profitability: Net margin 17.97%, ROIC 11.62%, ROE 21.73% | Moderate profitability: Net margin 12.3%, ROIC 5.67%, ROE 14.49% |
| Innovation | Moderate innovation with steady investments in Observability and Security segments; ROIC declining slightly | High innovation focus with rapidly growing ROIC (+224%), but currently shedding value |
| Global presence | Extensive global footprint with leadership in enterprise networking and security markets | Growing global presence in cybersecurity, expanding subscription offerings |
| Market Share | Leading market share in networking hardware and services | Significant and growing share in cybersecurity software and cloud security |
Key takeaways: Cisco benefits from broad diversification and strong profitability but faces challenges with a declining ROIC trend. Palo Alto Networks shows promising growth and innovation in cybersecurity, though it is currently shedding value and has lower profitability metrics. Investors should weigh Cisco’s stable value creation against Palo Alto’s growth potential and higher risk.
Risk Analysis
Below is a comparison table of key risks for Cisco Systems, Inc. (CSCO) and Palo Alto Networks, Inc. (PANW) based on the most recent 2025 data:
| Metric | Cisco Systems, Inc. (CSCO) | Palo Alto Networks, Inc. (PANW) |
|---|---|---|
| Market Risk | Moderate (Beta 0.864) | Moderate (Beta 0.786) |
| Debt level | Moderate (Debt/Equity 0.63) | Low (Debt/Equity 0.04) |
| Regulatory Risk | Moderate (Tech sector compliance) | Moderate (Cybersecurity regulations) |
| Operational Risk | Moderate (Large global ops) | Moderate (Growing scale, tech complexity) |
| Environmental Risk | Low (Primarily tech hardware/software) | Low (Software-focused) |
| Geopolitical Risk | Moderate (Global supply chain exposure) | Moderate (Global client base, data security concerns) |
The most impactful risks for both are market fluctuations and regulatory challenges amid evolving technology and cybersecurity landscapes. Cisco’s moderate debt level requires monitoring, while Palo Alto Networks benefits from a very low debt ratio but faces valuation concerns with high P/E ratios. Both operate globally, exposing them to geopolitical and operational risks.
Which Stock to Choose?
Cisco Systems, Inc. (CSCO) shows a favorable income evolution with stable gross and net margins, though recent EBIT and net margin growth have been slightly negative. Its financial ratios are mostly favorable, including strong profitability and moderate debt levels. The company holds a very favorable overall rating with a “B” grade and demonstrates value creation despite a declining ROIC trend.
Palo Alto Networks, Inc. (PANW) reports robust revenue and net income growth over the period, with favorable gross and EBIT margins, but recent net margin and EPS growth declined. Financial ratios are slightly favorable overall, with strong liquidity and low debt, though valuation multiples appear stretched. Its rating is also very favorable at “B,” but it is currently shedding value despite improving ROIC.
Investors focused on stable profitability and value creation might find Cisco’s profile more aligned with their goals, while those prioritizing rapid growth and improving profitability trends could see Palo Alto Networks as more appealing. The choice could depend on an investor’s risk tolerance and preference for growth versus stability.
Disclaimer: Investment carries a risk of loss of initial capital. The past performance is not a reliable indicator of future results. Be sure to understand risks before making an investment decision.
Go Further
I encourage you to read the complete analyses of Cisco Systems, Inc. and Palo Alto Networks, Inc. to enhance your investment decisions: