Home > Comparison > Technology > CSCO vs NOK
The strategic rivalry between Cisco Systems, Inc. and Nokia Oyj shapes the evolution of the communication equipment sector. Cisco operates as a diversified technology leader focused on IP networking and secure collaboration solutions. Nokia emphasizes mobile and fixed network infrastructure with a strong footprint in 5G and optical technologies. This head-to-head contrasts Cisco’s broad enterprise model against Nokia’s specialized network innovation. This analysis aims to identify which path offers superior risk-adjusted returns for a diversified portfolio.
Table of contents
Companies Overview
Cisco Systems and Nokia stand as pivotal players in the global communication equipment sector.
Cisco Systems, Inc.: Networking Infrastructure Powerhouse
Cisco dominates as a leader in Internet Protocol-based networking. Its core revenue stems from switching, routing, wireless products, and security solutions across enterprise and service provider segments. In 2026, Cisco’s strategic focus remains on expanding end-to-end collaboration solutions delivered via cloud, on-premise, and hybrid environments, catering to diverse customer needs worldwide.
Nokia Oyj: Comprehensive Network Solutions Specialist
Nokia operates as a global provider of mobile, fixed, and cloud network solutions. It generates revenue from radio access networks, fixed infrastructure, optical networks, and cloud services. In 2026, Nokia emphasizes innovation in 5G technologies, cloud virtualization, and optical transport, targeting communication service providers, hyperscalers, and digital industries to enhance network performance and scalability.
Strategic Collision: Similarities & Divergences
Cisco and Nokia share a commitment to network infrastructure, but Cisco favors a comprehensive collaboration and security ecosystem while Nokia prioritizes open, multi-technology network solutions. Their primary battleground is the 5G and enterprise networking market, where Cisco leverages cloud integration and Nokia advances optical and virtualization capabilities. This contrast shapes distinct investment profiles: Cisco as a stable, diversified giant; Nokia as a focused innovator in network transformation.
Income Statement Comparison
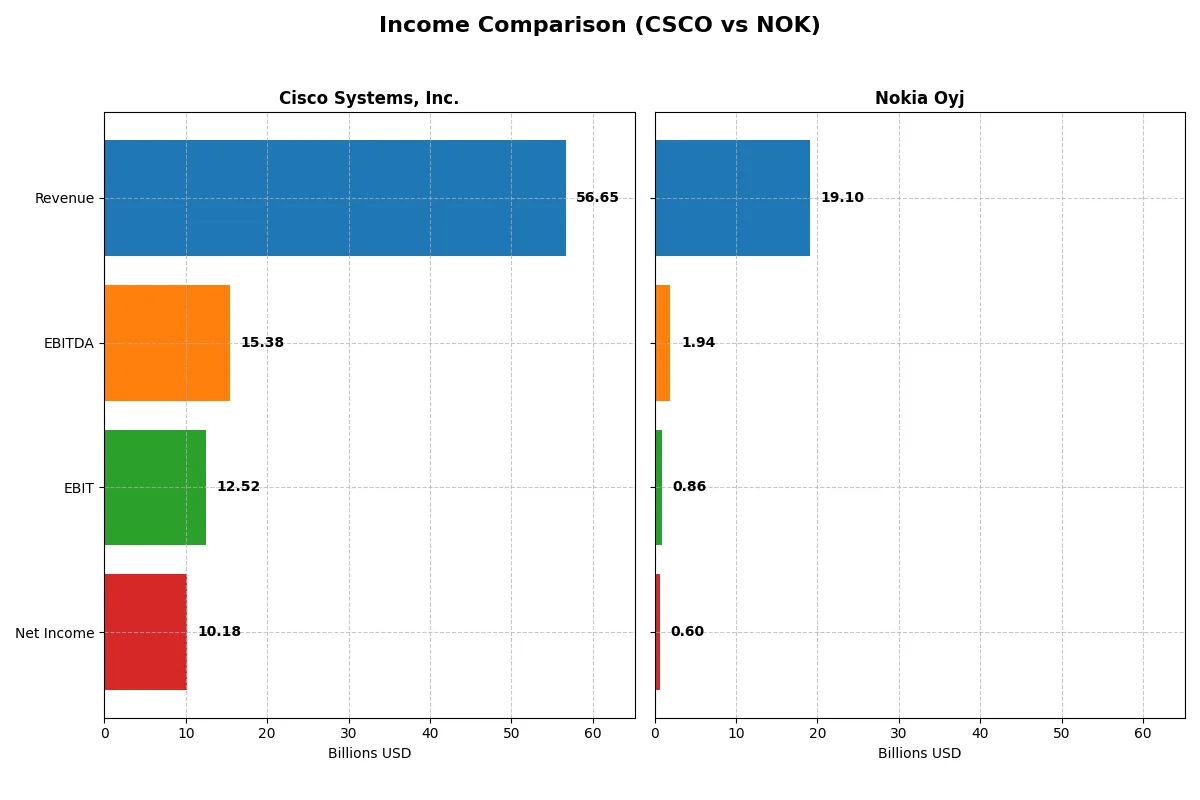
This table dissects the core profitability and scalability of both corporate engines to reveal who dominates the bottom line:
| Metric | Cisco Systems, Inc. (CSCO) | Nokia Oyj (NOK) |
|---|---|---|
| Revenue | 56.7B | 19.1B EUR |
| Cost of Revenue | 19.9B | 11.1B EUR |
| Operating Expenses | 25.0B | 6.5B EUR |
| Gross Profit | 36.8B | 8.0B EUR |
| EBITDA | 15.4B | 1.9B EUR |
| EBIT | 12.5B | 862M EUR |
| Interest Expense | 1.6B | 0 |
| Net Income | 10.2B | 604M EUR |
| EPS | 2.56 | 0.11 EUR |
| Fiscal Year | 2025 | 2025 |
Income Statement Analysis: The Bottom-Line Duel
The upcoming income statement comparison will expose which company drives superior profitability and operational efficiency in their respective markets.
Cisco Systems, Inc. Analysis
Cisco’s revenue climbed steadily to $56.7B in 2025, with net income slightly declining to $10.2B. Its gross margin remains robust at nearly 65%, supporting strong profitability. Despite a 5% revenue growth in the past year, net margin slipped 6%, signaling margin pressure amid rising operating expenses. Efficiency challenges emerged but fundamentals remain favorable.
Nokia Oyj Analysis
Nokia’s revenue declined marginally to €19.1B in 2025, with net income falling sharply to €604M. Gross margin at 42% is moderate, while net margin contracts to just 3.2%. The company faces a steep 64% EBIT drop year-over-year, reflecting operational difficulties. Overall, Nokia’s income trends show weakening momentum and deteriorating profitability.
Verdict: Margin Strength vs. Shrinking Profits
Cisco outperforms Nokia with higher margins and more consistent revenue growth, despite recent margin compression. Nokia’s profits and margins have eroded significantly, underscoring operational strain. Investors seeking resilient earnings and margin power will find Cisco’s profile markedly more attractive than Nokia’s troubled trajectory.
Financial Ratios Comparison
These vital ratios act as a diagnostic tool to expose the underlying fiscal health, valuation premiums, and capital efficiency of the companies compared below:
| Ratios | Cisco Systems, Inc. (CSCO) | Nokia Oyj (NOK) |
|---|---|---|
| ROE | 21.7% | 2.9% |
| ROIC | 11.6% | 3.8% |
| P/E | 26.8 | 49.4 |
| P/B | 5.83 | 1.42 |
| Current Ratio | 1.00 | 1.58 |
| Quick Ratio | 0.91 | 1.36 |
| D/E | 0.63 | 0.25 |
| Debt-to-Assets | 24.2% | 13.9% |
| Interest Coverage | 7.38 | 0 (no coverage ratio) |
| Asset Turnover | 0.46 | 0.51 |
| Fixed Asset Turnover | 16.6 | 7.68 |
| Payout ratio | 63.2% | 119.7% |
| Dividend yield | 2.36% | 2.43% |
| Fiscal Year | 2025 | 2025 |
Efficiency & Valuation Duel: The Vital Signs
Financial ratios act as a company’s DNA, uncovering hidden risks and revealing operational excellence through key profitability and valuation metrics.
Cisco Systems, Inc.
Cisco demonstrates strong profitability with a 21.7% ROE and 18% net margin, signaling efficient capital use. However, its valuation looks stretched with a P/E of 26.8 and high P/B of 5.8. The company rewards shareholders with a 2.36% dividend yield, balancing returns amid a strategy focused on steady cash flow and moderate reinvestment.
Nokia Oyj
Nokia’s profitability lags with a 2.9% ROE and 3.2% net margin, reflecting operational challenges. The stock appears expensive at a P/E of 49.4 but trades at a reasonable P/B of 1.42. Nokia maintains a 2.43% dividend yield, signaling consistent shareholder returns, while prioritizing R&D with over 23% revenue reinvested to drive future growth.
Valuation Stretched but Profitable vs. Leaner Growth Play
Cisco offers higher profitability and a balanced dividend amid a stretched valuation, while Nokia’s lower profitability contrasts with a more reasonable book value and robust R&D investment. Investors seeking operational strength may prefer Cisco; those favoring growth potential might lean toward Nokia’s profile.
Which one offers the Superior Shareholder Reward?
I compare Cisco Systems, Inc. (CSCO) and Nokia Oyj (NOK) on their 2025 distribution strategies. Cisco pays a 2.36% dividend yield with a 63% payout ratio, well covered by nearly 94% free cash flow. It also maintains a strong buyback program, boosting total returns sustainably. Nokia yields 2.43%, but with a payout ratio exceeding 119%, raising sustainability concerns. Its free cash flow coverage lags at 71%, and buybacks are less intense. Cisco’s balanced dividend and aggressive buybacks offer a more durable and attractive total return profile in 2026. I favor Cisco for superior shareholder reward.
Comparative Score Analysis: The Strategic Profile
The radar chart reveals the fundamental DNA and trade-offs of Cisco Systems, Inc. and Nokia Oyj, highlighting their strategic strengths and weaknesses:
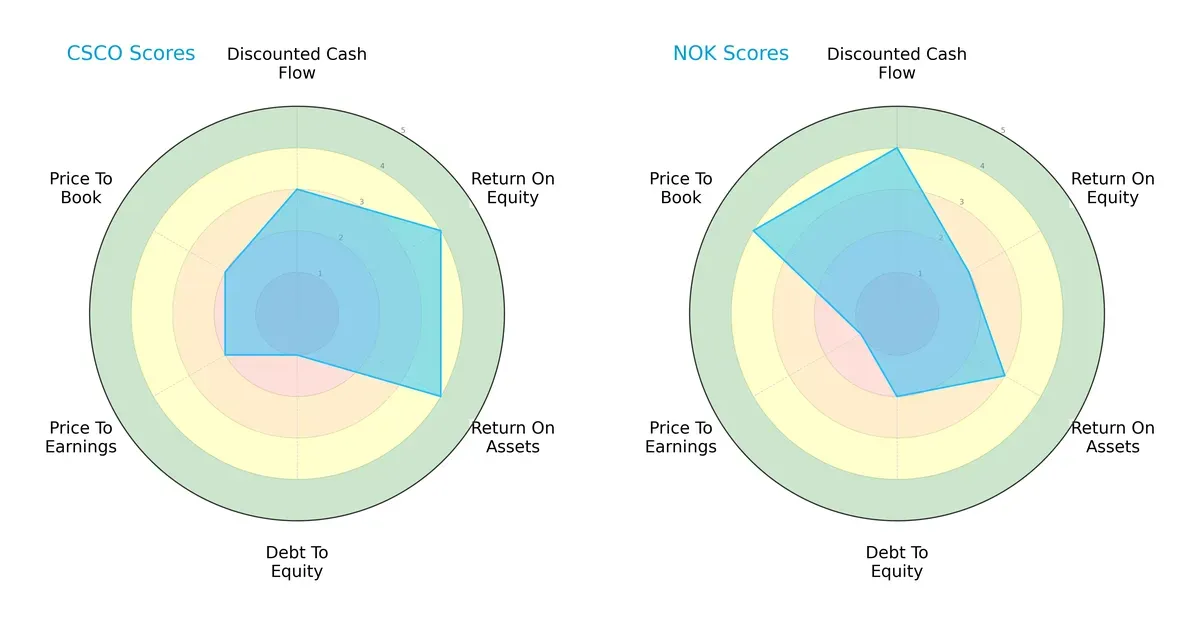
Cisco shows strength in profitability metrics, with a higher ROE (4) and ROA (4) than Nokia’s moderate scores (ROE 2, ROA 3). Nokia leads in discounted cash flow (4 vs. Cisco’s 3) and price-to-book valuation (4 vs. 2), indicating better cash flow expectations and relative bargain pricing. Cisco’s debt-to-equity score (1) is notably weaker, flagging higher leverage risk compared to Nokia’s moderate rating (2). Overall, Cisco’s profile relies on operational efficiency, while Nokia presents a more balanced valuation and financial risk mix.
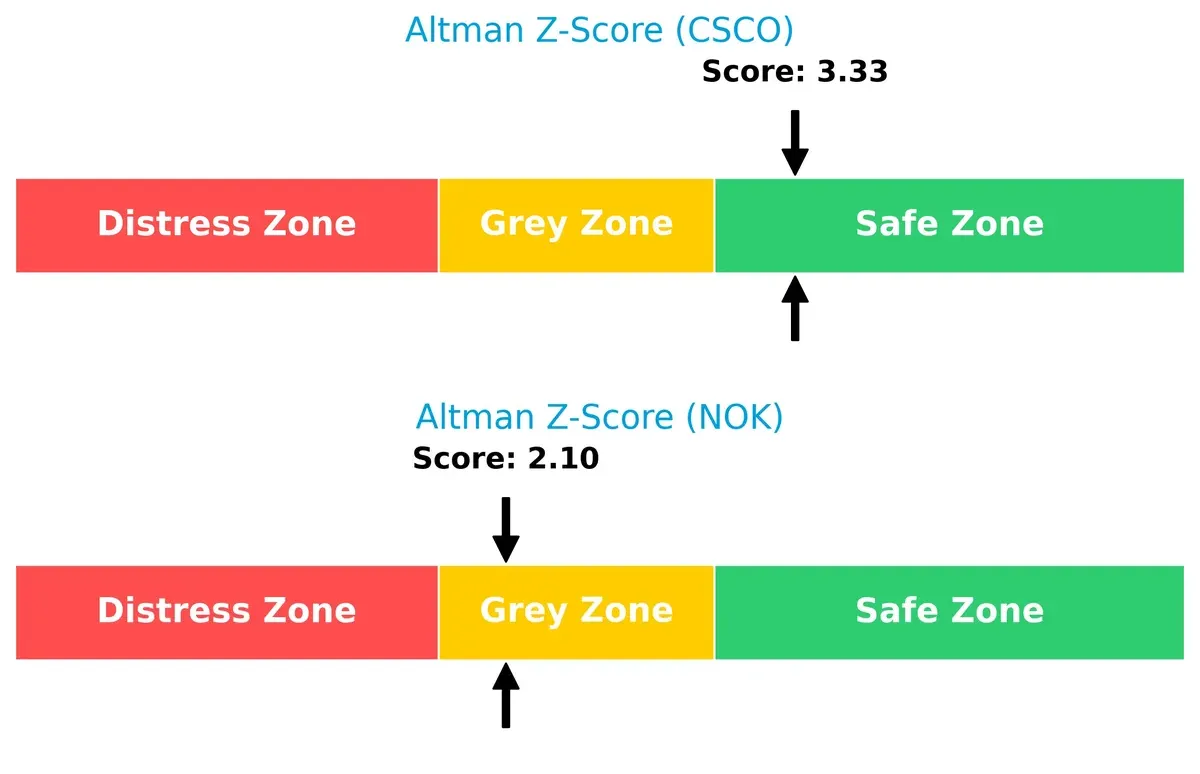
Bankruptcy Risk: Solvency Showdown
Cisco’s Altman Z-Score of 3.33 places it safely above the distress threshold, signaling solid long-term survival prospects. Nokia’s 2.10 score lands in the grey zone, indicating moderate bankruptcy risk in this cycle:
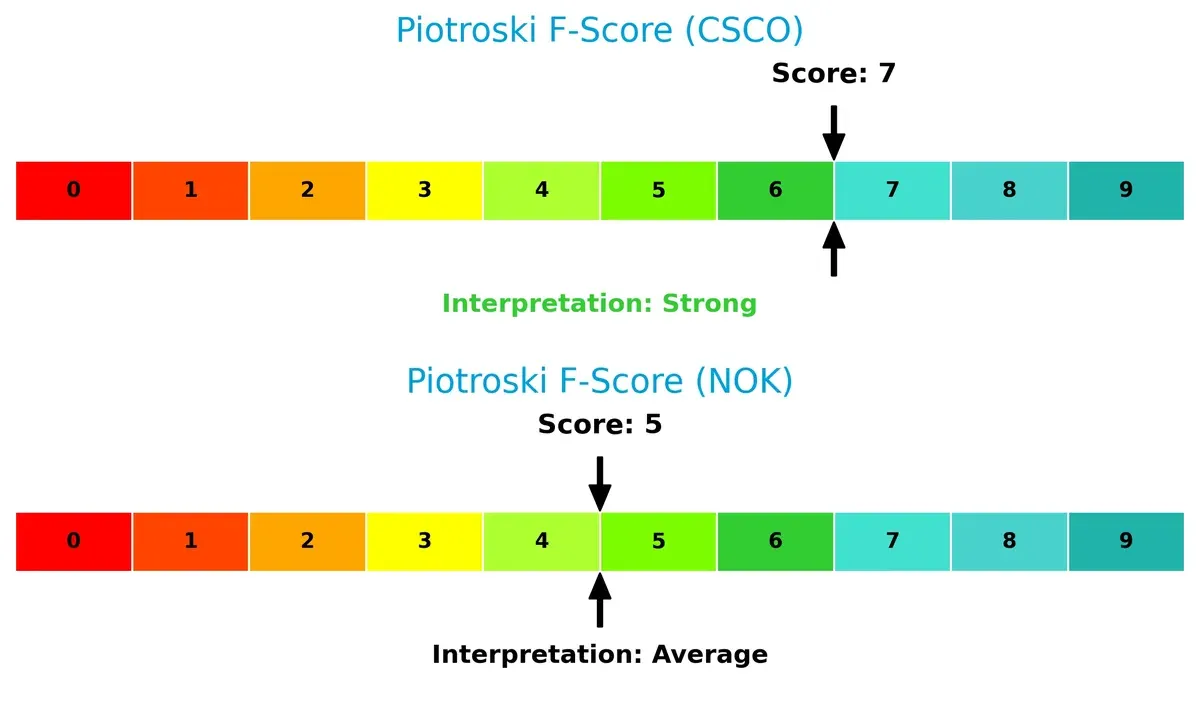
Financial Health: Quality of Operations
Cisco’s Piotroski F-Score of 7 signals strong financial health and operational quality. Nokia’s score of 5 suggests average performance with some internal red flags compared to Cisco’s robust metrics:
How are the two companies positioned?
This section dissects the operational DNA of CSCO and NOK by comparing their revenue distribution and internal dynamics. The goal is to confront their economic moats and reveal which model offers the most resilient competitive advantage today.
Revenue Segmentation: The Strategic Mix
This visual comparison dissects how both firms diversify their income streams and highlights where their primary sector bets lie:
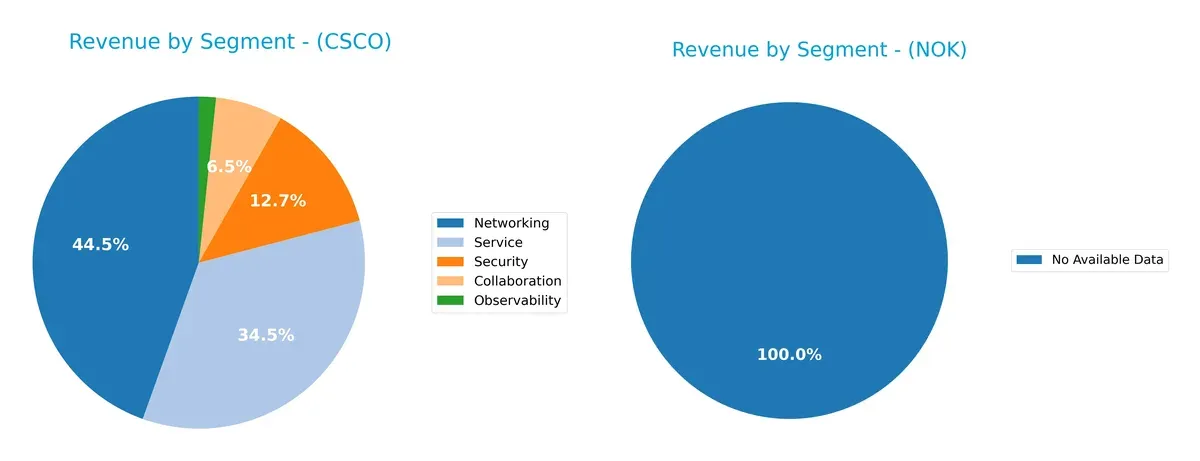
Cisco Systems, Inc. anchors its revenue heavily in Networking at $28.3B and Services at $21.9B, with meaningful contributions from Security ($8.1B) and Collaboration ($4.2B). Nokia Oyj lacks available segment data, preventing direct comparison. Cisco’s diversified portfolio reduces concentration risk and leverages ecosystem lock-in, reinforcing its infrastructure dominance in networking and security markets. This strategic mix supports strong competitive moats in a highly competitive sector.
Strengths and Weaknesses Comparison
This table compares the Strengths and Weaknesses of Cisco Systems, Inc. and Nokia Oyj:
Cisco Strengths
- Strong profitability with 18% net margin and 22% ROE
- Favorable ROIC well above WACC at 11.6% vs 7.6%
- Diverse product portfolio across services, security, and networking
- Significant global presence with $33.7B US and $14.8B EMEA sales
- High dividend yield of 2.36% supports shareholder returns
Nokia Strengths
- Favorable balance sheet metrics including current ratio at 1.58
- Low debt-to-assets at 13.9%, strong interest coverage
- Solid global footprint with balanced revenues across North America, Europe, Asia
- Price-to-book ratio favorable at 1.42 indicating potential undervaluation
- Dividend yield slightly higher at 2.43% reflects stable income
Cisco Weaknesses
- Elevated valuation multiples: P/E 26.8 and P/B 5.8, may limit upside
- Liquidity concerns with current ratio at 1.0 and asset turnover low at 0.46
- Asset turnover lagging, indicating potential inefficiencies
- Limited quick ratio at 0.91 signals tighter short-term liquidity
Nokia Weaknesses
- Low profitability with net margin at 3.2% and ROE only 2.9%
- ROIC at 3.8% barely above WACC of 5.7%, weak capital efficiency
- High P/E at 49.4 signals expensive earnings
- Revenue segmentation data less detailed, indicating possible concentration
Both companies maintain favorable overall financial health but exhibit contrasting profiles. Cisco’s profitability and product diversification stand out, yet valuation and liquidity pose risks. Nokia shows better liquidity and balance sheet strength but struggles with profitability and capital efficiency. These dynamics shape their strategic priorities in managing growth and risk.
The Moat Duel: Analyzing Competitive Defensibility
A structural moat shields long-term profits from relentless competitive pressures and market disruptions. Here’s how Cisco and Nokia stack up:
Cisco Systems, Inc.: Intangible Assets and Network Effects Moat
Cisco leverages a powerful intangible asset base and network effects, reflected in a strong 65% gross margin and 18% net margin. Despite a slight ROIC decline, its advanced security and collaboration platforms deepen its moat in 2026.
Nokia Oyj: Cost Advantage with Eroding Profitability
Nokia relies on cost efficiency in network infrastructure but suffers from a weak 42% gross margin and only 3% net margin. Its shrinking ROIC and steep earnings decline signal a fragile moat amid intensifying 5G competition.
Verdict: Intangible Assets vs. Cost Efficiency Under Pressure
Cisco’s intangible asset-driven moat proves wider and more durable, sustaining higher returns and resilience. Nokia’s cost advantage is eroding rapidly, leaving it poorly positioned to defend market share going forward.
Which stock offers better returns?
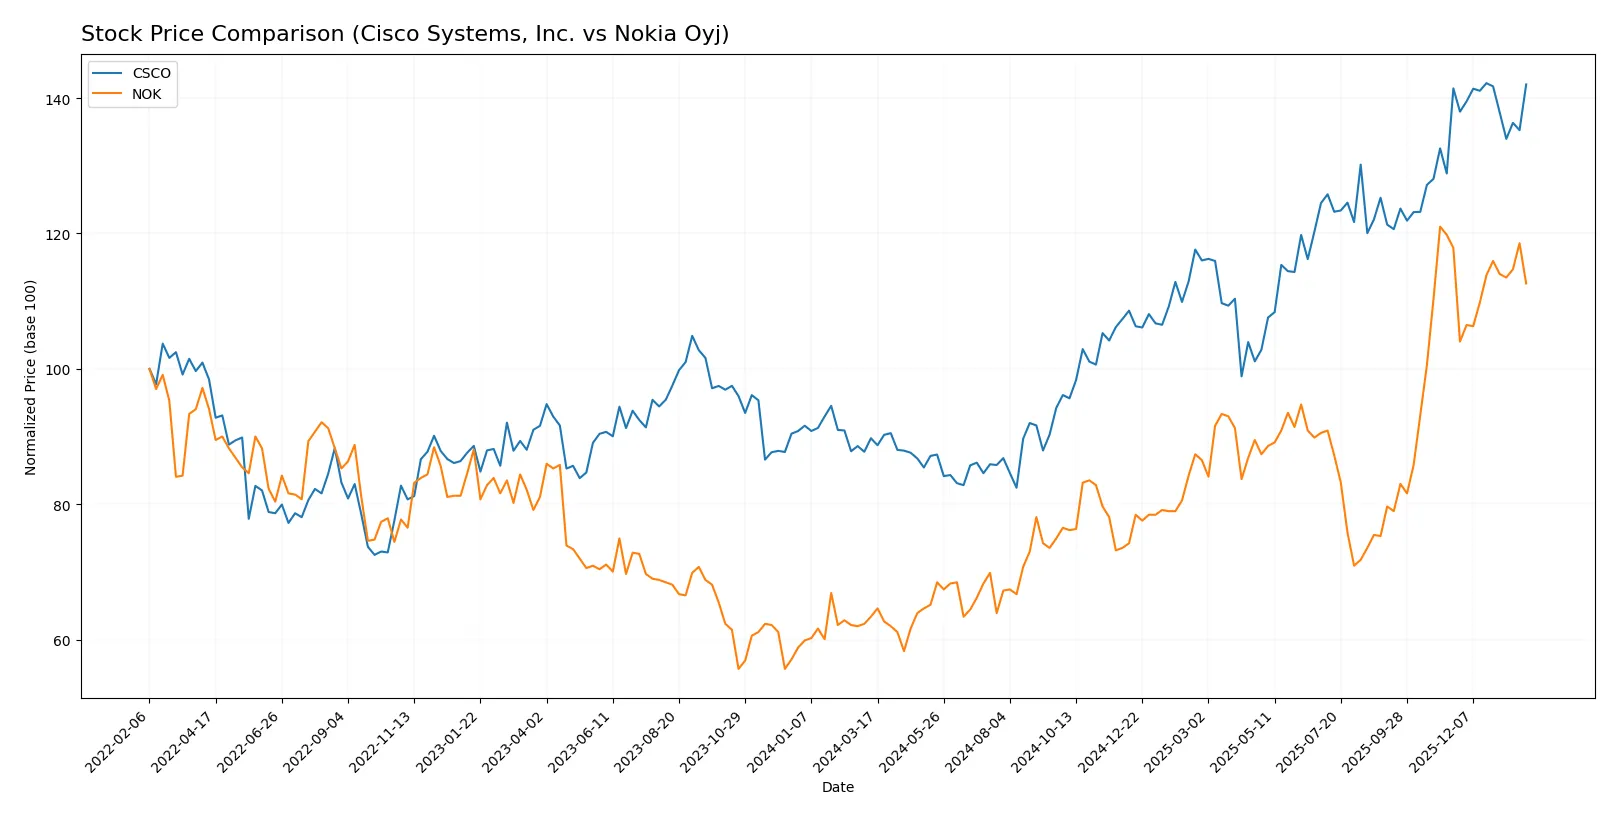
Over the past year, Cisco Systems, Inc. and Nokia Oyj exhibited strong price gains with distinct volume dynamics and recent trend shifts highlighting evolving investor sentiment.
Trend Comparison
Cisco Systems, Inc. shows a 58.22% bullish price increase over 12 months with decelerating momentum and a high volatility of 9.8%. The recent three-month trend is neutral, edging up 0.41% with low volatility.
Nokia Oyj outperformed with a 77.62% bullish price increase over the same period, accelerating its trend amid low volatility of 0.9%. However, its recent three-month trend turned bearish, declining 4.46%.
Nokia delivered the highest market performance for the year, though Cisco’s recent stability contrasts Nokia’s short-term weakness.
Target Prices
Analysts present a moderately bullish consensus for Cisco Systems and Nokia, reflecting cautious optimism in the communication equipment sector.
| Company | Target Low | Target High | Consensus |
|---|---|---|---|
| Cisco Systems, Inc. | 69 | 100 | 89.6 |
| Nokia Oyj | 5 | 8.5 | 6.69 |
Cisco’s consensus target of 89.6 exceeds its current price of 78.32, indicating upside potential. Nokia’s target consensus of 6.69 slightly surpasses its current price of 6.43, suggesting modest gains ahead.

Don’t Let Luck Decide Your Entry Point
Optimize your entry points with our advanced ProRealTime indicators. You’ll get efficient buy signals with precise price targets for maximum performance. Start outperforming now!
How do institutions grade them?
Cisco Systems, Inc. Grades
The following table shows recent institutional grades for Cisco Systems, Inc.:
| Grading Company | Action | New Grade | Date |
|---|---|---|---|
| Evercore ISI Group | Upgrade | Outperform | 2026-01-26 |
| Morgan Stanley | Maintain | Overweight | 2025-12-17 |
| Citigroup | Maintain | Buy | 2025-11-13 |
| Barclays | Maintain | Equal Weight | 2025-11-13 |
| Melius Research | Maintain | Buy | 2025-11-13 |
| B of A Securities | Maintain | Buy | 2025-11-13 |
| Wells Fargo | Maintain | Overweight | 2025-11-13 |
| Morgan Stanley | Maintain | Overweight | 2025-11-13 |
| JP Morgan | Maintain | Overweight | 2025-11-13 |
| Rosenblatt | Maintain | Buy | 2025-11-13 |
Nokia Oyj Grades
The following table lists recent institutional grades for Nokia Oyj:
| Grading Company | Action | New Grade | Date |
|---|---|---|---|
| JP Morgan | Maintain | Overweight | 2025-12-01 |
| Jefferies | Upgrade | Buy | 2025-10-28 |
| JP Morgan | Maintain | Overweight | 2025-10-24 |
| JP Morgan | Maintain | Overweight | 2025-07-29 |
| JP Morgan | Maintain | Overweight | 2025-02-21 |
| Craig-Hallum | Maintain | Buy | 2025-01-06 |
| JP Morgan | Upgrade | Overweight | 2024-12-09 |
| JP Morgan | Maintain | Neutral | 2024-10-21 |
| Northland Capital Markets | Maintain | Outperform | 2024-10-18 |
| Northland Capital Markets | Maintain | Outperform | 2024-09-04 |
Which company has the best grades?
Cisco holds consistently strong buy and overweight ratings across multiple firms, including a recent upgrade to outperform. Nokia also receives solid overweight and buy ratings but fewer outright outperform grades. Cisco’s stronger consensus may attract more investor confidence.
Risks specific to each company
The following categories identify the critical pressure points and systemic threats facing both firms in the 2026 market environment:
1. Market & Competition
Cisco Systems, Inc.
- Faces intense competition in enterprise networking with strong innovation demands.
Nokia Oyj
- Battles pricing pressure in telecom infrastructure amid 5G and cloud transitions.
2. Capital Structure & Debt
Cisco Systems, Inc.
- Moderate leverage with debt-to-assets at 24%, interest coverage strong but debt-to-equity score very unfavorable.
Nokia Oyj
- Lower leverage, favorable debt ratios, and infinite interest coverage indicating robust debt service ability.
3. Stock Volatility
Cisco Systems, Inc.
- Beta at 0.86 suggests moderate market sensitivity, typical for tech sector stalwarts.
Nokia Oyj
- Lower beta at 0.51 indicates less stock volatility and defensive behavior in turbulent markets.
4. Regulatory & Legal
Cisco Systems, Inc.
- Subject to US tech regulations and export controls, increasing compliance costs.
Nokia Oyj
- Faces EU regulatory scrutiny and geopolitical trade restrictions impacting supply chains.
5. Supply Chain & Operations
Cisco Systems, Inc.
- Complex global supply chains vulnerable to component shortages and geopolitical tensions.
Nokia Oyj
- Exposure to European supply chain disruptions but benefits from diversified manufacturing footprint.
6. ESG & Climate Transition
Cisco Systems, Inc.
- Strong ESG initiatives but technology footprint and data center energy use remain concerns.
Nokia Oyj
- Progressive sustainability targets aligned with EU climate goals, enhancing long-term resilience.
7. Geopolitical Exposure
Cisco Systems, Inc.
- Significant US-China trade tensions risk, impacting international sales and supply sourcing.
Nokia Oyj
- European base mitigates some US-China risks but exposes Nokia to Russia-Ukraine conflict fallout.
Which company shows a better risk-adjusted profile?
Cisco’s most impactful risk is its relatively high leverage and regulatory complexity amid global tensions. Nokia’s key risk lies in low profitability amid competitive pressure and geopolitical uncertainties. Despite Cisco’s debt concerns, its superior profitability and financial strength provide a better risk-adjusted profile. Cisco’s Altman Z-score of 3.33 confirms financial safety, contrasting with Nokia’s 2.10 in the grey zone. This highlights Cisco’s resilience despite macro risks.
Final Verdict: Which stock to choose?
Cisco Systems, Inc. wields unmatched operational efficiency and strong value creation, evident in its solid ROIC exceeding WACC. Its point of vigilance lies in a flat current ratio, signaling liquidity caution. Cisco suits portfolios aiming for steady, aggressive growth with an eye on quality cash flow.
Nokia Oyj’s strategic moat is grounded in its conservative balance sheet and resilient dividend yield, offering a safety cushion compared to Cisco. Despite weaker profitability metrics, its lower leverage and favorable price-to-book ratio make it a candidate for GARP portfolios seeking value with moderate risk.
If you prioritize value creation and robust profitability, Cisco outshines with superior capital efficiency and cash generation despite some liquidity concerns. However, if you seek a more defensive stance with a focus on balance sheet strength and reasonable valuation, Nokia offers better stability and income potential in a volatile sector.
Disclaimer: Investment carries a risk of loss of initial capital. The past performance is not a reliable indicator of future results. Be sure to understand risks before making an investment decision.
Go Further
I encourage you to read the complete analyses of Cisco Systems, Inc. and Nokia Oyj to enhance your investment decisions: