Investors looking at the communication equipment sector often compare industry leaders to identify the best growth and value opportunities. Cisco Systems, Inc. (CSCO) and Motorola Solutions, Inc. (MSI) stand out due to their overlapping markets, strong innovation strategies, and focus on secure, mission-critical communications. This article will help you understand which company offers the most compelling investment potential in today’s evolving tech landscape. Let’s explore which one deserves a spot in your portfolio.

Table of contents
Companies Overview
I will begin the comparison between Cisco Systems, Inc. and Motorola Solutions, Inc. by providing an overview of these two companies and their main differences.
Cisco Systems, Inc. Overview
Cisco Systems, Inc. designs and sells Internet Protocol-based networking products and services globally. Its offerings include switching, routing, wireless, security, collaboration, and observability solutions tailored for various network environments. Serving diverse sectors such as businesses, governments, and service providers, Cisco supports customers through direct sales and partners, focusing on secure, reliable connectivity and hybrid cloud collaboration. The company is headquartered in San Jose, California.
Motorola Solutions, Inc. Overview
Motorola Solutions, Inc. provides mission-critical communications and analytics primarily for government, public safety, and commercial customers. Its two segments include Products and Systems Integration—offering radios, video security devices, and infrastructure—and Software and Services, delivering maintenance, cybersecurity, and command center software solutions. Founded in 1928 and based in Chicago, Illinois, it operates internationally with a focus on private communication networks and video security management.
Key similarities and differences
Both companies operate in the communication equipment industry with technology-driven portfolios, serving government and commercial sectors. Cisco emphasizes IP networking, collaboration, and cloud-enabled observability, whereas Motorola Solutions specializes in mission-critical communications, video security, and integrated command center software. Cisco’s market cap is substantially larger at $298B compared to Motorola’s $65B, reflecting differences in scale and product breadth.
Income Statement Comparison
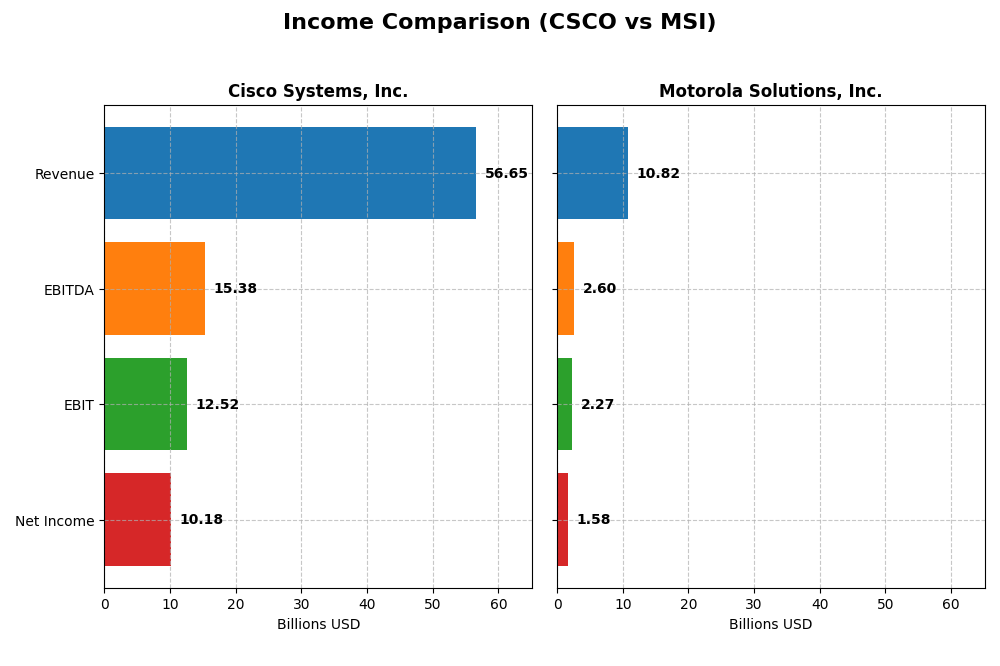
The table below presents a side-by-side comparison of key income statement metrics for Cisco Systems, Inc. and Motorola Solutions, Inc. for their most recent fiscal years, highlighting their financial performance.
| Metric | Cisco Systems, Inc. | Motorola Solutions, Inc. |
|---|---|---|
| Market Cap | 298B | 65.1B |
| Revenue | 56.7B | 10.8B |
| EBITDA | 15.4B | 2.60B |
| EBIT | 12.5B | 2.27B |
| Net Income | 10.2B | 1.58B |
| EPS | 2.56 | 9.45 |
| Fiscal Year | 2025 | 2024 |
Income Statement Interpretations
Cisco Systems, Inc.
Cisco’s revenue increased moderately by 5.3% in the latest fiscal year, continuing a favorable overall growth of 13.7% since 2021. However, net income declined by 3.9% over the same period, with a 6.3% drop in net margin recently. Despite this, Cisco maintains strong gross and EBIT margins above 60% and 22%, respectively, though EBIT decreased by 5.5% last year, signaling some margin pressure.
Motorola Solutions, Inc.
Motorola Solutions demonstrated robust revenue growth of 8.4% in the latest year, contributing to a substantial 45.9% increase since 2020. Net income rose impressively by 66.2% overall, supported by improving net margins that grew 13.9% over the period. Despite a recent 5.3% EBIT decline and 14.9% net margin contraction last year, the company maintains solid profitability with a gross margin near 51% and EBIT margin just under 21%.
Which one has the stronger fundamentals?
Both companies show favorable income statement fundamentals, but Motorola Solutions displays stronger growth in revenue, net income, and margins over the longer term. Cisco holds higher absolute margins but faces recent declines in EBIT and net margin. Motorola’s more consistent margin improvements and significant net income growth suggest comparatively stronger operational momentum in the latest fiscal years.
Financial Ratios Comparison
The table below presents a side-by-side comparison of key financial ratios for Cisco Systems, Inc. and Motorola Solutions, Inc. for their most recent fiscal years, providing an overview of their profitability, liquidity, leverage, and efficiency metrics.
| Ratios | Cisco Systems, Inc. (2025) | Motorola Solutions, Inc. (2024) |
|---|---|---|
| ROE | 21.7% | 92.6% |
| ROIC | 11.6% | 21.6% |
| P/E | 26.8 | 48.9 |
| P/B | 5.83 | 45.3 |
| Current Ratio | 1.00 | 1.28 |
| Quick Ratio | 0.91 | 1.13 |
| D/E (Debt to Equity) | 0.63 | 3.85 |
| Debt-to-Assets | 24.2% | 44.9% |
| Interest Coverage | 7.38 | 9.11 |
| Asset Turnover | 0.46 | 0.74 |
| Fixed Asset Turnover | 16.6 | 7.0 |
| Payout ratio | 63.2% | 41.5% |
| Dividend yield | 2.36% | 0.85% |
Interpretation of the Ratios
Cisco Systems, Inc.
Cisco shows a generally favorable ratio profile with strong net margin (17.97%), ROE (21.73%), and ROIC (11.62%), indicating efficient profitability and capital use. However, its high P/E (26.83) and P/B (5.83) ratios and a current ratio at 1.0 may raise liquidity and valuation concerns. The 2.36% dividend yield is well-covered, reflecting a sustainable payout.
Motorola Solutions, Inc.
Motorola Solutions presents mixed ratios: a very high ROE (92.6%) and good net margin (14.58%) contrast with a weak debt/equity ratio (3.85) and high P/E (48.89) and P/B (45.27) valuations. The current ratio (1.28) is acceptable, but the low dividend yield (0.85%) is less attractive, implying limited income returns despite a favorable interest coverage ratio.
Which one has the best ratios?
Cisco’s ratios are more balanced with a majority favorable metrics, especially regarding profitability and dividend sustainability, despite some liquidity and valuation drawbacks. Motorola Solutions has outstanding profitability ratios but suffers from high leverage and inflated valuation multiples, resulting in a slightly favorable overall assessment compared to Cisco’s more consistent profile.
Strategic Positioning
This section compares the strategic positioning of Cisco Systems, Inc. and Motorola Solutions, Inc. in terms of market position, key segments, and exposure to technological disruption:
Cisco Systems, Inc.
- Leading global player in communication equipment with high competitive pressure.
- Diverse segments include networking, security, collaboration, observability, and services driving business.
- Faces disruption risks across cloud collaboration and network security technology advancements.
Motorola Solutions, Inc.
- Mid-sized competitor focused on mission critical communications with moderate pressure.
- Two main segments: Products and Systems Integration, and Software and Services.
- Exposed to technological change in video security, analytics, and integrated communications software.
Cisco Systems, Inc. vs Motorola Solutions, Inc. Positioning
Cisco has a diversified portfolio across networking, security, and collaboration, supporting broad market reach. Motorola concentrates on mission critical communications and video security, focusing on government and public safety sectors, offering specialization but less diversification.
Which has the best competitive advantage?
Motorola demonstrates a very favorable moat with growing ROIC, indicating durable competitive advantage and increasing profitability, while Cisco shows a slightly favorable moat with declining ROIC, reflecting value creation but reduced profitability trends.
Stock Comparison
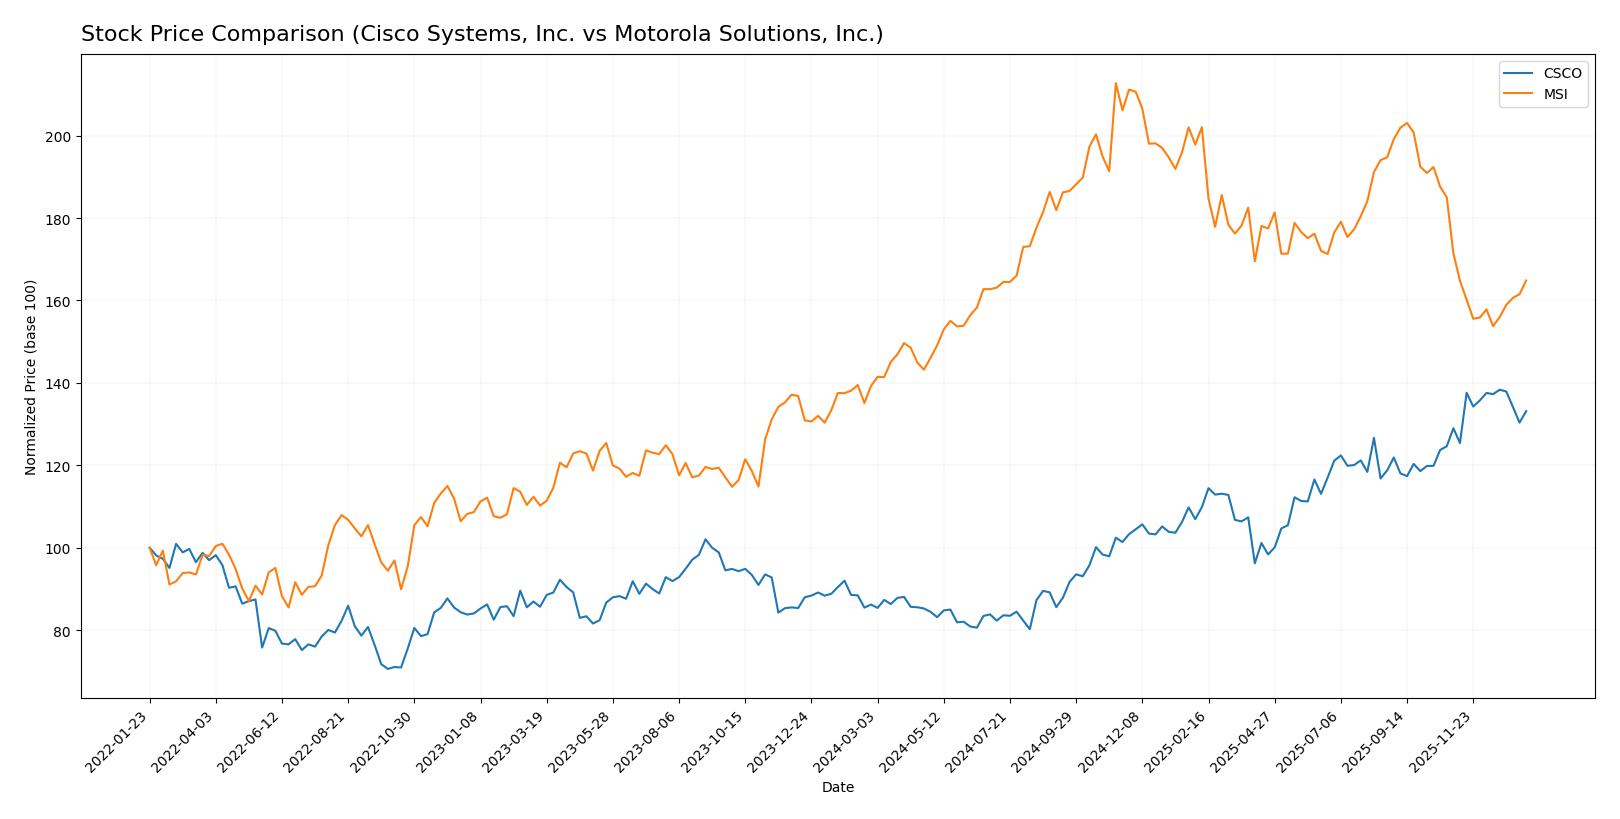
The stock price movements of Cisco Systems, Inc. and Motorola Solutions, Inc. over the past year reveal distinct bullish trends with notable deceleration, marked by significant price gains and varying volatility profiles.
Trend Analysis
Cisco Systems, Inc. (CSCO) exhibited a strong bullish trend with a 54.46% price increase over the past 12 months, accompanied by moderate volatility (9.65 std dev) and a deceleration in acceleration. The recent period showed a mild gain of 3.23%.
Motorola Solutions, Inc. (MSI) also followed a bullish trend with an 18.39% price increase over the same period, but with much higher volatility (44.18 std dev) and decelerating momentum. Recently, MSI experienced a slight bearish move, declining 3.86%.
Comparatively, CSCO delivered the highest market performance over the past year with a significantly larger price gain and more stable recent upward momentum than MSI.
Target Prices
Analysts present a clear consensus on target prices for Cisco Systems, Inc. and Motorola Solutions, Inc.
| Company | Target High | Target Low | Consensus |
|---|---|---|---|
| Cisco Systems, Inc. | 91 | 69 | 82.67 |
| Motorola Solutions, Inc. | 525 | 436 | 469.8 |
The consensus target prices for both Cisco and Motorola Solutions exceed their current stock prices ($75.47 and $391 respectively), indicating analyst optimism for potential price appreciation.
Analyst Opinions Comparison
This section compares analysts’ ratings and grades for Cisco Systems, Inc. and Motorola Solutions, Inc.:
Rating Comparison
CSCO Rating
- Rating: B, classified as Very Favorable
- Discounted Cash Flow Score: 4, indicating Favorable
- ROE Score: 4, considered Favorable
- ROA Score: 4, considered Favorable
- Debt To Equity Score: 1, rated Very Unfavorable
- Overall Score: 3, categorized as Moderate
MSI Rating
- Rating: B+, classified as Very Favorable
- Discounted Cash Flow Score: 4, indicating Favorable
- ROE Score: 5, considered Very Favorable
- ROA Score: 5, considered Very Favorable
- Debt To Equity Score: 1, rated Very Unfavorable
- Overall Score: 3, categorized as Moderate
Which one is the best rated?
Based strictly on the provided data, MSI holds a higher rating of B+ compared to CSCO’s B. MSI also outperforms CSCO in ROE and ROA scores, though both share similar DCF, debt, and overall scores.
Scores Comparison
Here is a comparison of the Altman Z-Score and Piotroski Score for Cisco Systems and Motorola Solutions:
CSCO Scores
- Altman Z-Score: 3.19, in the safe zone, indicating low bankruptcy risk.
- Piotroski Score: 7, categorized as strong financial health.
MSI Scores
- Altman Z-Score: 3.65, in the safe zone, indicating low bankruptcy risk.
- Piotroski Score: 5, categorized as average financial health.
Which company has the best scores?
Based on the provided data, MSI has a higher Altman Z-Score indicating slightly stronger bankruptcy safety, while CSCO has a better Piotroski Score, reflecting stronger overall financial health. Each score highlights different aspects of financial stability.
Grades Comparison
Here is a detailed comparison of the recent grades assigned to Cisco Systems, Inc. and Motorola Solutions, Inc.:
Cisco Systems, Inc. Grades
This table summarizes recent grades from notable financial institutions for Cisco Systems, Inc.:
| Grading Company | Action | New Grade | Date |
|---|---|---|---|
| Morgan Stanley | Maintain | Overweight | 2025-12-17 |
| Morgan Stanley | Maintain | Overweight | 2025-11-13 |
| B of A Securities | Maintain | Buy | 2025-11-13 |
| Evercore ISI Group | Maintain | In Line | 2025-11-13 |
| Barclays | Maintain | Equal Weight | 2025-11-13 |
| Piper Sandler | Maintain | Neutral | 2025-11-13 |
| UBS | Maintain | Buy | 2025-11-13 |
| Melius Research | Maintain | Buy | 2025-11-13 |
| JP Morgan | Maintain | Overweight | 2025-11-13 |
| Keybanc | Maintain | Overweight | 2025-11-13 |
Overall, Cisco’s grades predominantly show a stable “Overweight” and “Buy” consensus, with several firms maintaining their positive outlook through late 2025.
Motorola Solutions, Inc. Grades
This table presents recent grades from recognized analysts for Motorola Solutions, Inc.:
| Grading Company | Action | New Grade | Date |
|---|---|---|---|
| Piper Sandler | Upgrade | Overweight | 2026-01-05 |
| Morgan Stanley | Upgrade | Overweight | 2025-12-17 |
| Barclays | Maintain | Overweight | 2025-10-31 |
| Piper Sandler | Maintain | Neutral | 2025-10-31 |
| Evercore ISI Group | Maintain | Outperform | 2025-08-29 |
| Barclays | Maintain | Overweight | 2025-08-08 |
| UBS | Maintain | Buy | 2025-08-08 |
| Barclays | Maintain | Overweight | 2025-05-05 |
| JP Morgan | Maintain | Overweight | 2025-04-17 |
| Barclays | Maintain | Overweight | 2025-02-14 |
Motorola Solutions has seen recent upgrades to “Overweight” from Piper Sandler and Morgan Stanley, reflecting a strengthening positive consensus through early 2026.
Which company has the best grades?
Both Cisco Systems and Motorola Solutions have strong institutional support with predominantly “Buy” and “Overweight” grades. Motorola Solutions shows a recent upgrading trend, which may indicate improving sentiment, whereas Cisco maintains a steady positive consensus. Investors should note these trends as signals of relative analyst confidence.
Strengths and Weaknesses
Below is a comparative overview of the key strengths and weaknesses of Cisco Systems, Inc. (CSCO) and Motorola Solutions, Inc. (MSI) based on recent financial and strategic data:
| Criterion | Cisco Systems, Inc. (CSCO) | Motorola Solutions, Inc. (MSI) |
|---|---|---|
| Diversification | Highly diversified with strong segments in Networking (28.3B), Services (21.9B), and Security (8.1B) in 2025 | Moderate diversification focused on Products (6.45B) and Services (4.36B) in 2024 |
| Profitability | Favorable profitability: net margin 17.97%, ROE 21.73%, ROIC 11.62% with declining ROIC trend | Very strong profitability: net margin 14.58%, ROE 92.6%, ROIC 21.59% with growing ROIC trend |
| Innovation | Consistent innovation in Networking and Security sectors, but ROIC trend suggests margin pressure | Strong innovation focus with increasing ROIC indicating durable competitive advantage |
| Global presence | Extensive global footprint supported by large-scale product and service offerings | Solid presence, particularly in government and enterprise sectors, but smaller scale than Cisco |
| Market Share | Leader in enterprise networking hardware and services | Strong niche player in communication solutions with growing market share in public safety |
Key takeaways: Cisco offers broad diversification and solid profitability but faces challenges with a declining ROIC trend. Motorola Solutions shows exceptional profitability growth and a durable competitive advantage despite a narrower product base. Risk-aware investors should consider Cisco’s stability versus Motorola’s growth momentum.
Risk Analysis
Below is a comparison table of key risks for Cisco Systems, Inc. (CSCO) and Motorola Solutions, Inc. (MSI) based on their latest available data in 2025 and 2024 respectively:
| Metric | Cisco Systems, Inc. (CSCO) | Motorola Solutions, Inc. (MSI) |
|---|---|---|
| Market Risk | Moderate beta at 0.863; stable demand but tech sector volatility | Beta near 1.0; exposed to government and commercial budgets |
| Debt Level | Moderate debt-to-equity 0.63; debt-to-assets 24.24% favorable | High debt-to-equity 3.85; debt-to-assets 44.89% neutral risk |
| Regulatory Risk | Moderate, due to global operations and data security regulations | Moderate, with focus on public safety compliance |
| Operational Risk | Large scale operations with 90.4K employees; supply chain complexities | Smaller scale, 21K employees; integration of systems critical |
| Environmental Risk | Moderate, technology manufacturing footprint and energy use | Moderate, focus on durable communications equipment |
| Geopolitical Risk | Exposure to Americas, EMEA, Asia-Pacific markets | Exposure to U.S., UK, Canada, and global markets; defense sector ties |
Cisco’s most impactful risk is moderate market volatility and operational complexity given its global footprint. Motorola Solutions faces higher financial risk from elevated debt levels but benefits from steady demand in mission-critical communications. Both companies must navigate regulatory and geopolitical uncertainties, with Cisco’s broader global exposure increasing sensitivity to international tensions. Investors should weigh Cisco’s solid financial health and moderate leverage against MSI’s higher leverage but strong niche positioning.
Which Stock to Choose?
Cisco Systems, Inc. (CSCO) shows moderate income growth over 2021-2025 with a 13.72% revenue increase but slight declines in net income and margin. Its profitability ratios like ROE at 21.73% are favorable, debt levels are moderate with a net debt to EBITDA of 1.31, and it holds a very favorable overall rating of B.
Motorola Solutions, Inc. (MSI) demonstrates stronger income growth overall, with a 45.9% revenue increase and 66.17% net income growth over 2020-2024. Its profitability metrics are robust, notably a very high ROE of 92.6%, though it carries higher debt (net debt to EBITDA 1.71) and a similarly strong rating of B+.
For investors balancing risk and growth, CSCO’s stable profitability and moderate debt might suggest suitability for those favoring quality and income stability. Conversely, MSI’s higher growth and exceptional ROE could appeal to growth-oriented investors willing to accept increased leverage. Both companies appear to create value, with MSI showing a very favorable moat and CSCO a slightly favorable one.
Disclaimer: Investment carries a risk of loss of initial capital. The past performance is not a reliable indicator of future results. Be sure to understand risks before making an investment decision.
Go Further
I encourage you to read the complete analyses of Cisco Systems, Inc. and Motorola Solutions, Inc. to enhance your investment decisions: