In the fast-evolving technology sector, Cisco Systems, Inc. (NASDAQ: CSCO) and Hewlett Packard Enterprise Company (NYSE: HPE) stand as influential players in the communication equipment industry. Both companies drive innovation in networking and data solutions, competing across overlapping markets with distinct strategies. This article will analyze their strengths and risks to help you identify which stock might be the most compelling addition to your investment portfolio today.
Table of contents
Companies Overview
I will begin the comparison between Cisco Systems, Inc. and Hewlett Packard Enterprise Company by providing an overview of these two companies and their main differences.
Cisco Systems, Inc. Overview
Cisco Systems, Inc. focuses on designing, manufacturing, and selling Internet Protocol-based networking products and solutions for communications and IT industries worldwide. Its portfolio includes campus and data center switching, enterprise routing, wireless products, security, and collaboration tools like Webex. Cisco serves a diverse customer base, including businesses, governments, and service providers, offering both on-premise and cloud solutions.
Hewlett Packard Enterprise Company Overview
Hewlett Packard Enterprise Company offers a broad range of IT infrastructure products and services, including servers, storage, networking hardware, and intelligent edge solutions. The company emphasizes seamless data capture, analysis, and action across various regions, serving commercial and large enterprise clients. Its portfolio also includes software, support services, and flexible consumption models to facilitate IT deployment and solutions acquisition.
Key similarities and differences
Both Cisco and Hewlett Packard Enterprise operate in the communication equipment industry, providing hardware and software solutions to enterprise customers. Cisco emphasizes networking and collaboration technologies, including security and cloud services, while Hewlett Packard Enterprise focuses more on IT infrastructure, servers, storage, and intelligent edge solutions. Both companies serve global markets but differ in product specialization and service delivery models.
Income Statement Comparison
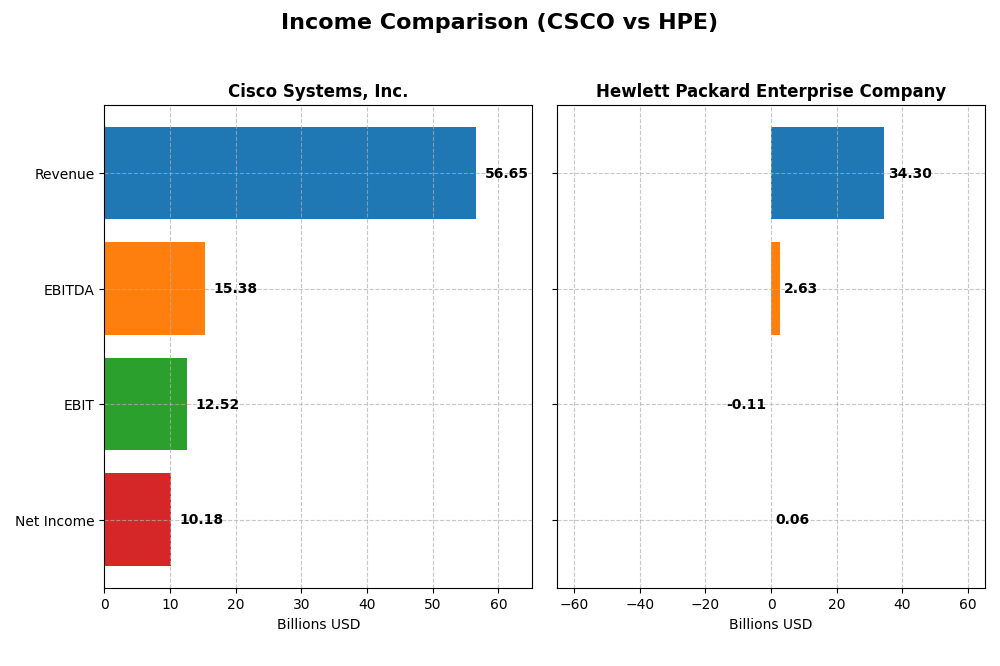
The table below compares key income statement metrics for Cisco Systems, Inc. and Hewlett Packard Enterprise Company for the fiscal year 2025, providing a clear view of their financial performance.
| Metric | Cisco Systems, Inc. | Hewlett Packard Enterprise Company |
|---|---|---|
| Market Cap | 298.2B | 29.5B |
| Revenue | 56.7B | 34.3B |
| EBITDA | 15.4B | 2.6B |
| EBIT | 12.5B | -0.11B |
| Net Income | 10.2B | 0.057B |
| EPS | 2.56 | -0.045 |
| Fiscal Year | 2025 | 2025 |
Income Statement Interpretations
Cisco Systems, Inc.
Cisco’s revenue displayed a steady growth trend over 2021-2025, increasing by 13.72%, while net income slightly declined by 3.88%. Margins remained generally favorable, with a gross margin near 65% and net margin close to 18%. In 2025, despite a modest revenue growth of 5.3%, net margin and EBIT margins saw a slight contraction, indicating some pressure on profitability.
Hewlett Packard Enterprise Company
HPE experienced stronger revenue growth of 23.08% from 2021 to 2025 but faced a sharp decline in net income and margins, with net income dropping nearly 98%. The gross margin stood at about 29%, while EBIT margin turned negative in 2025. The latest year showed continued revenue expansion but deteriorating profitability and earnings per share.
Which one has the stronger fundamentals?
Cisco Systems demonstrates stronger fundamentals with consistently favorable margins, steady revenue growth, and only mild net income declines. Conversely, Hewlett Packard Enterprise, despite higher revenue growth, suffers from significant net income and margin deterioration, reflecting weaker profitability. Overall, Cisco’s income statement profile appears more robust and stable over the assessed period.
Financial Ratios Comparison
This table provides a side-by-side comparison of key financial ratios for Cisco Systems, Inc. and Hewlett Packard Enterprise Company based on the most recent fiscal year data available.
| Ratios | Cisco Systems, Inc. (2025) | Hewlett Packard Enterprise Company (2025) |
|---|---|---|
| ROE | 21.7% | 0.23% |
| ROIC | 11.6% | -0.59% |
| P/E | 26.8 | 567.2 |
| P/B | 5.83 | 1.31 |
| Current Ratio | 1.00 | 1.01 |
| Quick Ratio | 0.91 | 0.76 |
| D/E | 0.63 | 0.91 |
| Debt-to-Assets | 24.2% | 29.5% |
| Interest Coverage | 7.38 | 9.39 |
| Asset Turnover | 0.46 | 0.45 |
| Fixed Asset Turnover | 16.6 | 5.71 |
| Payout ratio | 63.2% | 1396% |
| Dividend yield | 2.36% | 2.46% |
Interpretation of the Ratios
Cisco Systems, Inc.
Cisco’s financial ratios demonstrate overall strength with favorable net margin at 17.97%, ROE at 21.73%, and ROIC at 11.62%, indicating effective profitability and capital management. Concerns include an elevated P/E of 26.83 and a low current ratio of 1.0. The company pays dividends with a 2.36% yield, supported by sustainable payout ratios and consistent share buybacks.
Hewlett Packard Enterprise Company
HPE’s ratios show weakness with an extremely low net margin of 0.17%, ROE at 0.23%, and negative ROIC, reflecting profitability challenges. The high P/E at 567.23 contrasts with a modest PB of 1.31. It pays dividends yielding 2.46%, but interest coverage is negative, suggesting potential risks to dividend sustainability amid financial strain.
Which one has the best ratios?
Cisco Systems exhibits predominantly favorable ratios, particularly in profitability and returns, despite some valuation and liquidity concerns. Hewlett Packard Enterprise displays a majority of unfavorable metrics, especially profitability and interest coverage, signaling weaker financial health. Thus, Cisco’s ratios are clearly more robust compared to HPE’s slightly unfavorable profile.
Strategic Positioning
This section compares the strategic positioning of Cisco Systems, Inc. and Hewlett Packard Enterprise Company, focusing on market position, key segments, and exposure to technological disruption:
Cisco Systems, Inc.
- Leading market position with a large market cap of $298B; faces moderate competitive pressure.
- Diverse segments including Networking ($28.3B), Services ($21.9B), Security ($8.1B), and Collaboration ($4.2B).
- Exposure to technological disruption through cloud, security, and collaboration solutions.
Hewlett Packard Enterprise Company
- Smaller market cap of $29.5B; operates under higher beta indicating greater volatility and competitive pressure.
- Key segments: Server ($17.7B), Networking ($6.9B), Hybrid Cloud ($5.8B), Financial Services ($3.5B).
- Focus on hybrid cloud, intelligent edge, and high-performance computing to address disruption.
Cisco Systems, Inc. vs Hewlett Packard Enterprise Company Positioning
Cisco adopts a diversified approach spanning networking, security, and collaboration with broad global reach. HPE concentrates on servers, hybrid cloud, and intelligent edge, which may offer focused innovation but less segment diversification.
Which has the best competitive advantage?
Cisco shows a slightly favorable moat with value creation despite declining ROIC, indicating some competitive advantage. HPE’s very unfavorable moat and value destruction suggest weaker competitive positioning and profitability challenges.
Stock Comparison
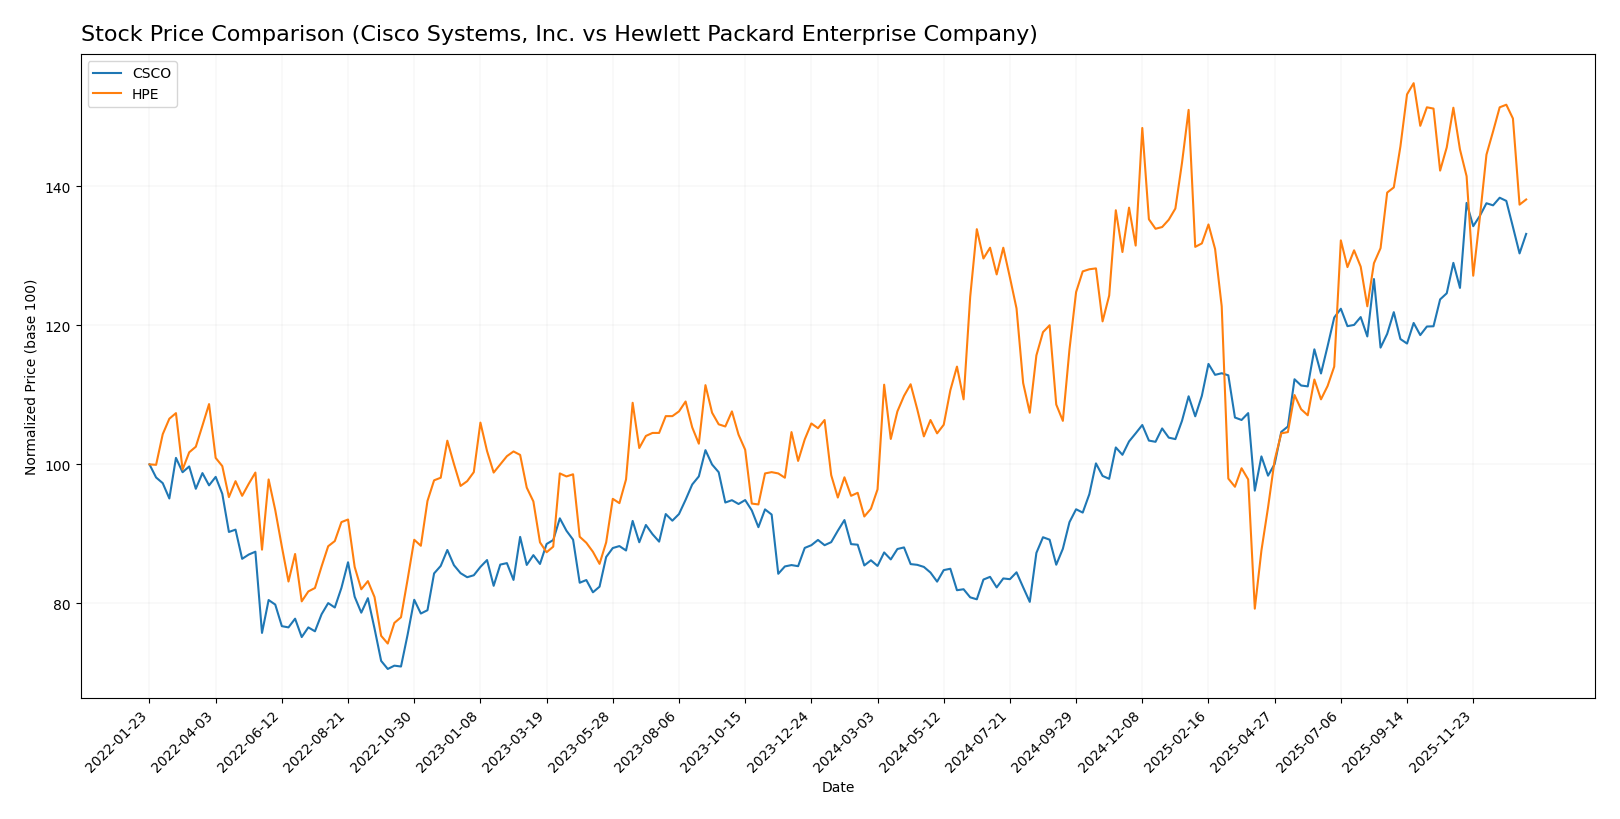
The past year showed strong bullish trends for both Cisco Systems, Inc. and Hewlett Packard Enterprise Company, with significant price gains and decelerating momentum as trading volumes increased steadily.
Trend Analysis
Cisco Systems, Inc. exhibited a bullish trend with a 54.46% price increase over the past 12 months, marked by decelerating acceleration and notable volatility at a 9.65 standard deviation. The stock ranged from a low of 45.47 to a high of 78.42.
Hewlett Packard Enterprise Company also followed a bullish trend with a 47.52% price increase over the past year, showing deceleration in its upward momentum and lower volatility at 2.81 standard deviation. Its price fluctuated between 12.79 and 24.99.
Comparing both, Cisco Systems, Inc. delivered the highest market performance with a larger overall price increase, despite Hewlett Packard Enterprise maintaining slightly higher buyer dominance in recent trading volume.
Target Prices
Here is the consensus target price overview for Cisco Systems, Inc. and Hewlett Packard Enterprise Company based on verified analyst data.
| Company | Target High | Target Low | Consensus |
|---|---|---|---|
| Cisco Systems, Inc. | 91 | 69 | 82.67 |
| Hewlett Packard Enterprise Company | 31 | 21 | 27.25 |
Analysts expect Cisco’s stock to appreciate modestly from its current price of 75.47 USD, while Hewlett Packard Enterprise shows upside potential compared to its current 22.30 USD price.
Analyst Opinions Comparison
This section compares analysts’ ratings and grades for Cisco Systems, Inc. (CSCO) and Hewlett Packard Enterprise Company (HPE):
Rating Comparison
CSCO Rating
- Rating: B, considered Very Favorable by analysts.
- Discounted Cash Flow Score: 4, indicating favorable valuation based on cash flow projections.
- ROE Score: 4, showing strong efficiency in generating profit from equity.
- ROA Score: 4, demonstrating effective use of assets to generate earnings.
- Debt To Equity Score: 1, indicating a very unfavorable balance sheet leverage.
- Overall Score: 3, reflecting a moderate overall financial standing.
HPE Rating
- Rating: B-, also rated Very Favorable.
- Discounted Cash Flow Score: 4, similarly favorable cash flow valuation.
- ROE Score: 2, moderate efficiency in generating equity profits.
- ROA Score: 2, moderate effectiveness in asset utilization.
- Debt To Equity Score: 1, also very unfavorable leverage.
- Overall Score: 2, suggesting a moderate but lower overall financial standing.
Which one is the best rated?
Based strictly on provided data, CSCO holds a higher overall score (3 vs. 2) and stronger profitability scores (ROE and ROA at 4 vs. 2), while both share very unfavorable debt-to-equity scores. CSCO is better rated overall.
Scores Comparison
The scores comparison between Cisco Systems, Inc. and Hewlett Packard Enterprise Company is as follows:
CSCO Scores
- Altman Z-Score: 3.19, indicating a safe zone.
- Piotroski Score: 7, reflecting strong financial health.
HPE Scores
- Altman Z-Score: 0.75, indicating a distress zone.
- Piotroski Score: 5, reflecting average financial health.
Which company has the best scores?
Based on the provided data, CSCO has the better Altman Z-Score and Piotroski Score, indicating stronger financial stability and health than HPE.
Grades Comparison
Here is a comparison of recent grades and ratings for Cisco Systems, Inc. and Hewlett Packard Enterprise Company:
Cisco Systems, Inc. Grades
The table below summarizes recent grades assigned by reputable grading companies for Cisco Systems, Inc.:
| Grading Company | Action | New Grade | Date |
|---|---|---|---|
| Morgan Stanley | Maintain | Overweight | 2025-12-17 |
| Morgan Stanley | Maintain | Overweight | 2025-11-13 |
| B of A Securities | Maintain | Buy | 2025-11-13 |
| Evercore ISI Group | Maintain | In Line | 2025-11-13 |
| Barclays | Maintain | Equal Weight | 2025-11-13 |
| Piper Sandler | Maintain | Neutral | 2025-11-13 |
| UBS | Maintain | Buy | 2025-11-13 |
| Melius Research | Maintain | Buy | 2025-11-13 |
| JP Morgan | Maintain | Overweight | 2025-11-13 |
| Keybanc | Maintain | Overweight | 2025-11-13 |
Cisco’s grades show a consistent pattern of positive ratings, largely clustered around “Buy” and “Overweight,” indicating general analyst confidence.
Hewlett Packard Enterprise Company Grades
The following table compiles recent grades from recognized grading companies for Hewlett Packard Enterprise Company:
| Grading Company | Action | New Grade | Date |
|---|---|---|---|
| Argus Research | Maintain | Buy | 2025-12-10 |
| BWG Global | Upgrade | Positive | 2025-11-24 |
| Morgan Stanley | Downgrade | Equal Weight | 2025-11-17 |
| Barclays | Maintain | Overweight | 2025-10-16 |
| Goldman Sachs | Maintain | Neutral | 2025-10-16 |
| UBS | Maintain | Neutral | 2025-10-16 |
| Citigroup | Maintain | Buy | 2025-10-06 |
| Goldman Sachs | Maintain | Neutral | 2025-10-02 |
| Citigroup | Maintain | Buy | 2025-09-04 |
| UBS | Maintain | Neutral | 2025-09-04 |
HPE’s grades reveal a mixed trend, with upgrades and downgrades reflecting some uncertainty, though Buy and Overweight ratings are present alongside Neutral and Equal Weight assessments.
Which company has the best grades?
Cisco Systems, Inc. generally receives stronger and more consistent Buy and Overweight ratings compared to Hewlett Packard Enterprise Company, which shows a more mixed consensus with Hold ratings. For investors, Cisco’s steadier positive outlook may imply greater analyst confidence, while HPE’s varied grades suggest more cautious investor sentiment.
Strengths and Weaknesses
Below is a comparative overview of key strengths and weaknesses for Cisco Systems, Inc. (CSCO) and Hewlett Packard Enterprise Company (HPE) based on the latest financial and strategic data available in 2026.
| Criterion | Cisco Systems, Inc. (CSCO) | Hewlett Packard Enterprise Company (HPE) |
|---|---|---|
| Diversification | Strong diversification across Networking (28.3B), Security (8.1B), and Services (22.0B) segments | Moderate diversification with Server Segment (17.7B), Networking (6.9B), Hybrid Cloud (5.8B), and Financial Services (3.5B) |
| Profitability | Favorable net margin (18%) and ROIC (11.6%), creating value though ROIC is declining | Very low net margin (0.17%) and negative ROIC (-0.6%), destroying value with declining profitability |
| Innovation | Solid investment in Collaboration and Security solutions, maintaining competitive edge | Focus on Hybrid Cloud and Intelligent Edge, yet profitability issues suggest challenges in innovation monetization |
| Global presence | Extensive global footprint supported by strong product and service sales worldwide | Global operations with diversified segments but facing efficiency and profitability constraints |
| Market Share | Leading market share in networking equipment and enterprise security | Significant in server and storage markets but lagging behind in growth and profit margins |
Key takeaways: Cisco maintains a favorable financial position with strong diversification and profitability despite a slight decline in ROIC. HPE struggles with profitability and value creation despite decent diversification and innovation focus, indicating higher investment risk.
Risk Analysis
Below is a risk comparison table for Cisco Systems, Inc. (CSCO) and Hewlett Packard Enterprise Company (HPE) based on the most recent 2025 financial data and market information:
| Metric | Cisco Systems, Inc. (CSCO) | Hewlett Packard Enterprise (HPE) |
|---|---|---|
| Market Risk | Moderate (Beta 0.86) | Higher (Beta 1.33) |
| Debt Level | Moderate (D/E 0.63, Debt/Assets 24%) | Higher (D/E 0.91, Debt/Assets 29%) |
| Regulatory Risk | Moderate (Global operations, compliance complexity) | Moderate (Global presence, complex IT regulations) |
| Operational Risk | Moderate (Large workforce, complex supply chain) | Moderate to High (Lower margins, operational inefficiencies) |
| Environmental Risk | Moderate (Industry standard compliance, sustainability initiatives) | Moderate (Focus on IT lifecycle management) |
| Geopolitical Risk | Moderate (Global market exposure including China) | Moderate (Global exposure, especially Americas and Asia) |
Synthesis: Cisco presents balanced risks with a strong financial position but faces moderate market and operational risks. HPE shows higher market risk and financial distress indicators, including a low Altman Z-score indicating bankruptcy risk and operational challenges. Investors should weigh Cisco’s relative stability against HPE’s higher risk and potential volatility.
Which Stock to Choose?
Cisco Systems, Inc. (CSCO) shows a generally favorable income evolution with a 5.3% revenue growth in 2025 and high profitability, despite some recent margin declines. Its financial ratios are mostly positive, with strong returns on equity (21.7%) and invested capital (11.6%), moderate debt levels, and a very favorable overall rating of B.
Hewlett Packard Enterprise Company (HPE) displays a mixed income evolution with strong revenue growth of 14.1% in 2025 but persistent net income and margin challenges. Its financial ratios are less favorable, reflecting low profitability and high net debt to EBITDA (6.3), though it holds a slightly favorable rating of B- with moderate scores.
For investors, CSCO might appear more suitable for those prioritizing stable profitability and value creation, given its favorable rating and strong income statement metrics. Conversely, HPE could be considered by those with a higher risk tolerance or focused on growth, despite its financial challenges and less favorable ratios.
Disclaimer: Investment carries a risk of loss of initial capital. The past performance is not a reliable indicator of future results. Be sure to understand risks before making an investment decision.
Go Further
I encourage you to read the complete analyses of Cisco Systems, Inc. and Hewlett Packard Enterprise Company to enhance your investment decisions: